City, University of London Institutional Repository
Citation
:
Devlin, N., Parkin, D. and Browne, J. (2009). Using the EQ-5D as a performance measurement tool in the NHS (09/03). London, UK: Department of Economics, CityUniversity London.
This is the unspecified version of the paper.
This version of the publication may differ from the final published
version.
Permanent repository link: http://openaccess.city.ac.uk/1502/
Link to published version
:
09/03Copyright and reuse:
City Research Online aims to make research
outputs of City, University of London available to a wider audience.
Copyright and Moral Rights remain with the author(s) and/or copyright
holders. URLs from City Research Online may be freely distributed and
linked to.
City Research Online: http://openaccess.city.ac.uk/ [email protected]
Department of Economics
Using the EQ-5D as a performance measurement tool in the NHS
Nancy J. Devlin1 Office of Health Economics
David Parkin2
City Health Economics Centre, City University London
John Browne
London School of Hygiene and Tropical Medicine
Department of Economics Discussion Paper Series
No. 09/03
1 Office of Health Economics12 Whitehall London SW1A 2DY Telephone: +44 (0)20 7747 8858
Using the EQ-5D as a performance measurement tool in the NHS
Nancy J. Devlin1, David Parkin2 and John Browne3.
1. Office of Health Economics, London
2. City Health Economics Centre, Department of Economics, City University, London. 3. London School of Hygiene and Tropical Medicine, London
Correspondence to:
Professor Nancy J. Devlin Office of Health Economics 12 Whitehall
London SW1A 2DY
Telephone: ++44 (0)20 7747 8858 Fax: ++44 (0)20 7747 8851 Mobile: 07 515 974 978
Using the EQ-5D as a performance measurement tool in the NHS
Abstract
1. Patient Reported Outcomes and health sector decision making.
There has been a marked shift, internationally, in thinking about what health is and how it is measured. Traditional clinical ways of measuring of health and the effects of treatment are increasingly accompanied by or indeed replaced with patient reported outcomes (PROs). The United States’ Food and Drug Administration, which recently recommended the inclusion of PROs in clinical trials [1], notes that “the use of PRO instruments is part of a general movement toward the idea that the patient, properly queried, is the best source of information about how he or she feels’ [2]. In the UK, the National Institute for Health and Clinical Excellence (NICE) has, since its inception, required the use of PROs data in evidence submitted to it [3]. More recently, the potential for using PROs data in still other ways, to inform a wide range of different decisions, has been recognised [4,5,6].
A landmark development in this area is currently taking place in the National Health Service (NHS) in England. From April 2009, the English Department of Health (DH) will require the routine measurement of patient reported health outcomes for all NHS patients before and after receiving surgery, via its PROMs (Patient Reported Outcome Measures) initiative. Initially this requirement applies to four surgical procedures - hernia repair, hip and knee replacement and varicose veins [7] – but the intention is to roll out PROMs across a wide range of NHS services.
The DH plans to use the PROMs data to measure and manage the performance of hospitals in improving patient health. The results will be included in the information provided to patients being referred for surgery, to assist them in choosing the hospital at which they will receive treatment. Ultimately, and as it is rolled out over a wider range of NHS-funded treatments in subsequent years, the data will also be used to inform wide ranging issues about productivity in the NHS [8], value for money, resource allocation and demand management [4,5]. The possibility of directly linking hospitals’ reimbursement to their performance in terms of PROMs, rather than to the delivery of services, has also been proposed [9]. A related UK development is the proposal to introduce ‘value based pricing’ for pharmaceuticals, with prices to be based on ‘value to patients’, presumably reflecting improvements in patient reported health outcomes and extensions in length of life [10].
overarching intention is that, in addition to clinical measures of outcome, PROMs will enable patient perspectives to be taken into account at a variety of levels within the UK health care system. This reflects key themes in NHS reforms to improve responsiveness to patients’ views, preference and choices. [11]
From an economics perspective the PROMs initiative is of considerable interest. A key aspect of PROMs is that they will allow each hospital’s performance to be benchmarked against others’. Analyses of productivity and efficiency can be refocused on health rather than the traditional measures of activity. Further, the initiative represents the first attempt internationally to use the EQ-5D [12] as a routinely collected performance indicator. The EQ-5D, a generic PRO instrument that is described in the following section, is widely used in studies to determine the cost effectiveness of health care – for example, it is the instrument required by NICE for evidence submitted to its technology appraisals process [3]. Because the EQ-5D is accompanied by value sets [13], it facilitates the estimation of Quality Adjusted Life Years (QALYs). The use of the EQ-5D in the context of PROMs will therefore enable these data also to be used to undertake economic evaluations. Whereas economic evaluation has tended to focus on new technologies, these data will enable much broader assessments of value for money across the NHS, comparing both new technologies and extant services.
The aim of this paper is to report analysis of the EQ-5D data included in a pilot study which preceded the implementation of PROMs, and to consider the implications of these results for PROMs’ use as performance indicators and measures of patient benefit.
2. The PROMs initiative
The data to be collected in the DH’s PROMs initiative include a condition-specific health status measurement instrument relevant to each surgical procedure and the EQ-5D, a generic instrument [2]. The EQ-5D comprises two elements. The first, the EQ-5D self-classifier, asks patients to classify themselves as having one of three levels of health - no problems, some
problems or extreme problems - in each of five dimensions of health - mobility, self-care, usual
pain/discomfort, and some problems with anxiety/depression. The second element is a visual analogue scale, the EQ-VAS, which records patients’ overall assessment of their health on a scale from 100 (best imaginable health) to 0 (worse imaginable health).
The DH’s introduction of the routine collection and reporting of these PROMs was informed by evidence from a pilot study commissioned from a team of researchers based in the London School of Hygiene and Tropical Medicine (LSHTM) and the Royal College of Surgeons (RCS) [14]. The first phase of the project, PROMs1, entailed a critical review of the literature. PROMs2 was a pilot study to determine the feasibility of collecting pre- and post-operative PROMs from patients undergoing elective surgery, and to investigate how such data could best be analysed and presented. The Patient Outcomes in Surgery (POIS) project currently underway [15] is an extended pilot with a larger sample of patients and hospitals.
The PROMs2 study entailed recruitment and tracking of prospective cohorts of patients receiving surgery for each of 5 surgical procedures: unilateral hip replacement; unilateral knee replacement; groin hernia repair; varicose vein surgery; and cataract surgery. These had been selected by the DH for the variety of medical complexity and specialty that they represented.
In each case, the PROMs data were collected from patients both before and after surgery. They included the EQ-5D profile, but not the EQ-VAS, the SF-36 [16] and a disease specific measure. Data were also collected on a wide range of clinical and other patient characteristics, for example age, sex, duration of symptoms, previous surgery, co-morbidity, pre-operative health status and post-operative complications.
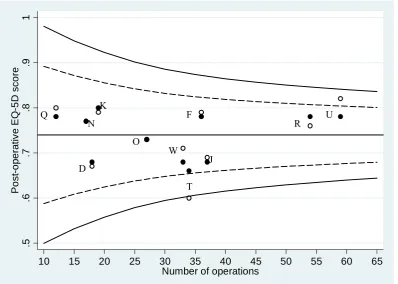
Funnel plots were used as the principal means of comparing performance between centres, both for health outcomes and post-operative complications. The health outcome was defined as the health state reported by patients after surgery. For the EQ-5D, this was the mean of a
Figure 1 shows an example funnel plot for hip replacement surgery. The hollow circles represent each centre’s unadjusted post-operative EQ-5D score; the solid circles show the score adjusted for various risk factors. The horizontal line represents ‘target performance’: the mean post-operative score for all centres combined, which in this case = 0.74. In the case shown here, there is no statistically significant difference, at the 95% control limit, between each centre’s adjusted post-operative EQ-5D score and the target performance.
The pilot study made considerable headway in establishing the feasibility of collecting PROMs data, and in understanding the nature of the data likely to emerge from larger scale use of them in the NHS. However, questions remain about the data and findings relating to the use of the EQ-5D in this context.
First, as noted above, the EQ-5D profile data were analysed by calculating a single summary score, by assigning each profile its ‘social value’. Although having a single value to represent a health state makes the data more amenable to statistical analysis, it means that the descriptive richness provided by the profile is lost, with the potential to lose information that might inform the assessment of performance.
Moreover, the method of assigning a summary score has conceptual and statistical problems attached to it. The ‘social values’ were obtained by statistical modelling of valuation data obtained from members of the general public, using the Time Trade Off (TTO) method for EQ-5D states that were hypothetical to them [17]. Although the rationale for using social values in economic evaluation is clear and widely accepted, it is less clear that there is a compelling rationale for their use in PROMs. Arguably, the use of social values means that the data can no longer be regarded as purely Patient Reported Outcome Measures, since each patient’s score
If a single score is required for the purposes of statistical analysis, this problem may be avoided by using the EQ-VAS scores. However, the PROMs2 study did not collect these.
Secondly, the analysis focused on post-operative scores as the indicator of final health outcomes
arising from surgery. However, economic analysis would usually regard the outcome of health care as the changes in health that it produces. Re-focusing the analysis on the change in
patient-reported health might reveal a different picture of variations between surgical procedures, patient types, and providers.
In the light of these concerns, specific objectives of this paper are: (i) to test the insights that emerge from focusing the analysis on the change in health outcomes instead of post surgical outcomes; and (ii) to develop and test new ways of analysing EQ-5D profile data that require the use of neither social value sets nor patients’ EQ-VAS scores. Even when EQ-VAS data are available to summarise the EQ-5D profile, or where the use of social value sets is clearly justified, the profile data themselves comprise an important source of information about patients’ perceptions of their own health. Analysis of the profile data adds important insights into underlying changes in patient reported health. EQ-5D profile data tend to be under-analysed - and there is relatively little guidance currently available to users on useful and creative means of doing so.
In the following section we describe the data available from PROMs2. We describe standard ways of reporting EQ-5D profile data, and then outline new analytical approaches we have developed for that purpose, and the corresponding results. We conclude by discussing the implications of our results, and note a number of remaining issues and challenges for this innovative use of the EQ-5D.
3. Data
Patients were surveyed before and after surgery, using paper based self-completion questionnaires. In each case, the questionnaire included both the generic (EQ-5D) profile, and a condition specific instrument. These were the VF-14 (for cataract surgery); Aberdeen Varicose Vein questionnaire (varicose vein surgery); Oxford Knee Score (knee replacement) and Oxford Hip Score (hip replacement). In the case of groin hernia repair, no disease specific instrument was available, so the SF-36 was used. SF-36 data were also collected for patients undergoing hip replacement.
In addition to patients’ self-reported health, data were collected on clinical characteristics (frequency and duration of symptoms; previous surgery; co-morbidities; general health) and socio-demographic characteristics (age; sex; and an indicator of socioeconomic deprivation based on participants’ postcodes). Post surgical questionnaires additionally sought the patients’ views about the results of their surgery and post surgical complications.
The overall response rate to the post-operative questionnaires was 86%, ranging from 75% for varicose vein patients to 92% for hip replacement. Full details of the sample recruitment and questionnaires are available in Browne et al (2007) [14].
4. Analysing and reporting EQ-5D profiles
Simple approaches to reporting of EQ-5D profiles and profile changes
The EQ-5D profile data in effect consist of five ordinal variables, one for each dimension. The simplest way of reporting these data is to describe the number and proportion of the sample reporting each of the levels on each of the dimensions. The change in numbers and proportions
This way of presenting the health profile data can be useful, particularly when, as in this case, the impact on quality of life of the disease and its treatment are clear. However, the disadvantage of reporting EQ-5D profiles in this way is that it is difficult to get a clear picture of overall health and how it has changed, which will be especially important where more subtle impacts and changes are involved. We therefore proceed by developing and testing a number of ways in which the overall changes in health on the EQ-5D profile might be summarised without creating a single summary score.
Using Paretian principles to judge overall improvements in EQ-5D profiles
The challenge is in judging whether overall health has improved when we cannot compare the relative importance of changes in different dimensions of health. This is analogous to the task in welfare economics of judging whether overall social welfare has improved when changes in the utility of different individuals are not interpersonally comparable. A well-known solution to the latter is to apply the Pareto principle: that there is an improvement if at least one person is made better off and no-one is made worse off 1. Translated to the health profile context, this suggests the following:
A health profile is better than another if it is better in at least one dimension, and is no worse in any other dimension.
A health profile is worse than another if it is worse in at least one dimension, and is no better in any other dimension.
Overall health has improved if it has improved in at least one dimension, and has not worsened in any other dimension.
Overall health has worsened if it has worsened in at least one dimension, and has not improved in any other dimension.
Using this principle, it is possible for every pair of different EQ-5D health profiles, x and y, to determine logically one of three relationships: x is better than y; x is worse than y; or they are non-comparable. Non-comparability arises when there is a mix of ‘better’ and ‘worse’ across dimensions and no weight is assigned to the relative size or value of these differences. This in turn means that there is a logical ordering of all of the possible health profiles within the EQ-5D descriptive system, but it has many tied ranks and is therefore a partial rather than a full
1 This is the strong variant of the Pareto principle. The weak variant is that if all persons are better off, then the
ordering. Moreover the relationships ‘better than’ and ‘worse than’ are both transitive, but the relationship ‘cannot be compared to’ is not, making the ordering much more complex2.
In comparing two actual EQ-5D health profiles - which, in the context of PROMs, means before and after surgery - there are therefore four possibilities:
1 The health profiles are the same; there has been no change in health state.
2 The second profile is better than the first; there has been an unequivocal improvement in health.
3 The second profile is worse than the first; there has been an unequivocal worsening in health.
4 The first and second health profiles are non-comparable; there has been a change in health but without further information we cannot say if it is an improvement or worsening.
Table 2 shows the overall distribution of changes for the five surgical procedures in the PROMs data according to this Paretian Classification of Health Change.
The advantage of reporting profile data in this way, compared to Table 1, is that it is much simpler and captures what is happening at the level of the patient rather than at the level of the dimension. A potential disadvantage is that if the ‘mixed change’ category dominates, the Paretian approach will not be of much practical use. However, for each of these five surgical procedures, more than 90% of the changes are not mixed but fall quite straightforwardly into the
other categories. This is especially interesting because it is only these mixed changes that require the use of value sets to weigh up improvements in health in some dimensions against the deterioration of health in others.
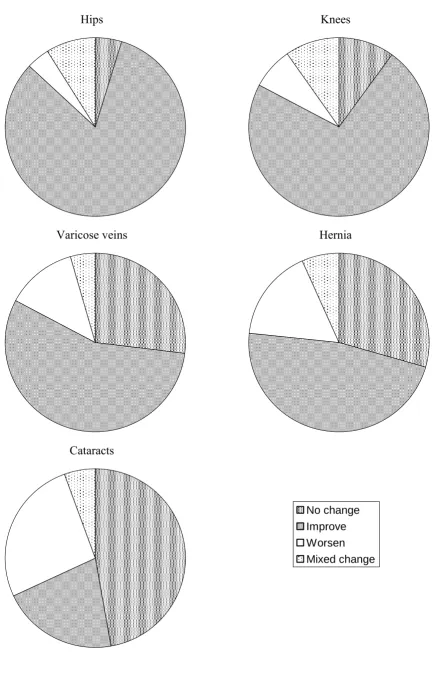
Looking at the results themselves, there are interesting differences across the surgical procedures on this categorisation. Hip and knee surgery result, in the vast majority of patients, in an unequivocal improvement in health. However, only around half of the patients who had hernia or vein surgery and just one fifth of those who had cataract surgery experience an unequivocal improvement in health. These data are displayed as pie charts in Figure 2. Pie charts have the merit of being readily understood (by patients, for example), and have the additional advantage
2 Denoting ‘better than’ as > and ‘worse than’ as <, if x>y and y>z then x>z and if x<y and y<z then x<z.
in this context of avoiding an implied ordering of the categories. While ‘improve’ is clearly better than ‘worsen’, ‘mixed change’ could potentially be better than ‘improve’ or worse than ‘worsen’.
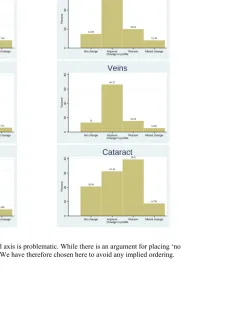
A notable feature of the results in Table 2 is the number of patients reporting ‘no change’ in their EQ-5D profile. That is, these patients’ self reported health on the EQ-5D after surgery was identical to that before surgery. We investigated further those with ‘no change’, which revealed that some cataract, hernia and veins patients classified as having ‘No change’ had, according to the EQ-5D, no problems in any dimension both before and after their operation. There were no such cases for hip or knee operations. Taking account of this gives the distribution of outcomes in Table 3.
In each case, more patients can be categorised as having ‘No problems’ than ‘No change’ and there are in particular a very large number of cataract patients who did not have any problems before surgery according to the EQ-5D. The effect of considering such patients separately is to improve the view of how effective the procedures are. This is clearly demonstrated when these data are represented as histograms, as in Figure 3. Histograms are one alternative to pie charts as a means of visually displaying these data; they are a better means of comparing different sets of proportions across multiple series of data. If those with ‘no problems’ are included as having no change, as in the second column of histograms, this gives a less clear indication of the dominance of improvements, in the cases of hernia and veins, and of worsening, in the case of cataracts, compared with if they are excluded, as in the third column of histograms.
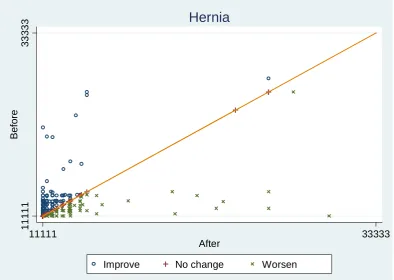
Displaying individual changes in health status using a Health Profile Grid
The EQ-5D has five dimensions, with three levels within each, which defines 35 = 243 possible unique profiles. The number of possible pairs of health states in before-and-after treatment comparisons is 243 x 243 = 59,049. Because of these large numbers, it is difficult to display each individual change in the health profile. However, it is possible to do this in graphical format on a Health Profile Grid if the 243 health profiles can be placed in rank order.
which a fully ordered ranking of the EQ-5D profiles might be achieved – for example, by considering the average EQ-VAS score reported by the patients reporting themselves in each of the EQ-5D profiles. Another means of imposing a ranking ordering is to use a social value set. For illustrative purposes, we proceed using the UK TTO value set [17]. These values do not in fact provide a full ordering, since 10 pairs of profiles have tied ranks; in those cases, the order is chosen at random3. It is then possible to display the health impact of the operation as before and after pairs of health profiles, as in Figures 4-9.
Figure 4 show the changes for hip operations. The diagonal line represents the same health profile before and after. Patients whose health profiles lie on the line, marked as ‘+’, experienced no change in their health state. Those whose profiles lie above the line, marked as ‘o’, experienced an improvement; and those below the line, marked as ‘x’, experienced a worsening. It should be noted that improvement and worsening are not according to the ‘Paretian’ definition, but represent a positive or negative change in the UK TTO values.
The most obvious aspect of this display is the dominance of patients whose health has improved, but there are more subtle aspects. The pre-operative health states are quite varied, but the post-operative health states are within a relatively narrow band. The pre-post-operative health states appear to be clusters that manifest themselves as horizontal lines with gaps between them that are sometimes large; however, this is an artefact that arises from the fact that many EQ-5D health states are rarely, if ever, found in nature. It would be possible to reduce this effect by including only those health states actually found within the data, at the cost of reducing comparability between different sets of data.
To explore this issue, we looked at some large data sets, totalling over 20 000 observations of patient and general public self-reported health using the EQ-5D. In this, 161 of the 243 EQ-5D profiles are not found at all, and 22 profiles cover 90% of health states found. Although not demonstrated here, it is possible to produce a set of Health Profile Grids with different degrees of focus and comparability, based on the percentage of health states found in nature. The Health Profile Grid in Figure 4 shows 100% of the 243 states; alternative Grids could display 90%, 95% and 99% of the most frequently occurring states. The 90% Grid would contain only 22 states
3 In the diagrams shown here, we impose a condition of 243 unique ranks. An alternative would be to allow ties,
and reduce the artefactual clustering problem but limit comparability; a 99% Grid might contain only 100 states but be very informative.
The Grid for knee operations is quite similar to that for hips, and is therefore omitted. The Grids for hernia and varicose vein operations are quite different to those for hip and knee operations; however they are similar to each other and therefore only the Grid for hernia operations is shown - see Figure 5.
A few obvious observations can be based on a comparison with the Grid for hip operations. The dominance of improvement is much less marked. The improvements are also mainly for patients who had relatively good health both before and after the operation. However, the same is true for those whose health worsened. More subtle observations are that those with poorer health before the operation virtually all improved; and that those who got worse were virtually all in reasonable health before. The same is true for varicose vein operations.
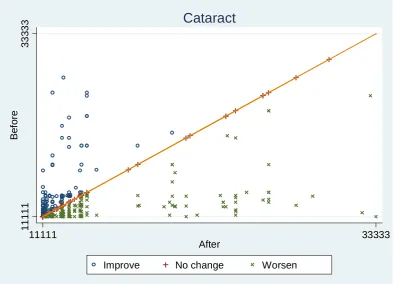
Figure 6 shows the same Grid for cataract operations, which shows a picture that is different to both hip or knee and hernia or varicose vein operations.
This demonstrates most obviously the more equivocal nature of the effectiveness of cataract operations in improving health, as indicated by the EQ-5D.
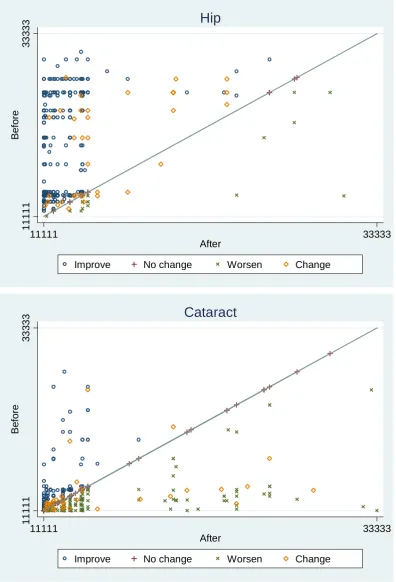
It is possible to incorporate the Paretian Classification of Health Changes described earlier into these Health Profile Grids, by distinguishing those above and below the line according to whether the change in their health state was unambiguously an improvement or worsening, or is defined as such only by the index. Unambiguous changes are marked as ‘o’ or ‘+’ or ‘x’, as before, and those that are ‘mixed changes’ are marked as ‘◊’. Figure 7 demonstrates this for hip and cataract operations, chosen because of the differences between them in terms of severity and pattern of changes.
have slightly more unambiguous worsening than improvement, and the mixed changes are also predominantly categorised as worsening according to the MVH values.
Comparing providers
One of the main catalysts in the introduction of PROMs is their potential in comparing provider performance. The analyses described above can be undertaken to distinguish between providers. This introduces additional complexity into the analysis that requires further development of these techniques; the following is provided for illustrative purposes to demonstrate the potential of these analyses as a basis for performance indicators.
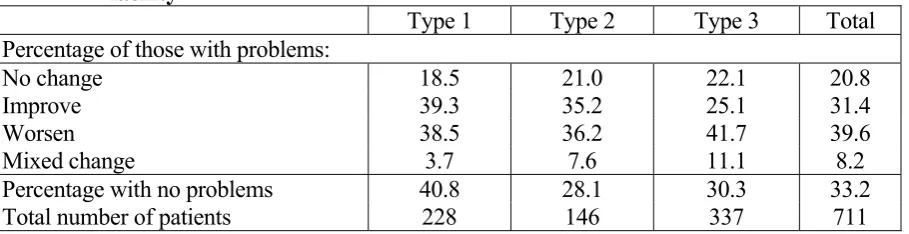
Table 4 shows the breakdown of outcomes in terms of changes in health classified in terms of the ‘Paretian’ definition, and taking account of those with no problems before or after treatment. The percentages in each category are recorded for three different types of facility. Although these are real data, the actual type of facility is not reported here to avoid any possible over-interpretation of results based on such a small sample of providers.
Taken at face value, these results suggest that Type 1 attracts a less severe case mix than Types 2 and 3. Looking at patients who do have problems according to the EQ-5D, Type 1 and Type 2 both have equal numbers who are made better or worse, but Type 3 makes many more patients worse than better, as well as having a slightly higher proportion who have no change.
Because there are different numbers of patients receiving treatment in each of the different types, the graphical representation is harder to interpret as can be seen in Figure 8, which is provided for illustration only.
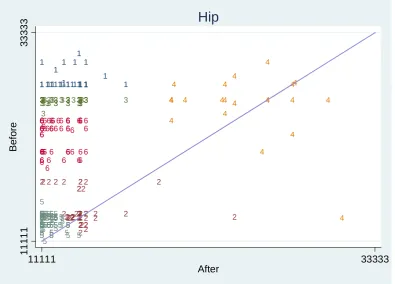
Finding clusters of patient types
These clusters are obviously not perfect, and they are confounded by the artefactual gaps between profiles. However, taking them at face value, Cluster 4 identifies mainly patients with poor health pre-operatively who remain at poor health; Clusters 5, 6, 3 and 1 represent patients who all experienced an improvement in health to approximately the same post-operative level, but who had increasingly severe levels of ill-health pre-operatively; and Cluster 2 represents patients who had a reasonable level of health pre-operatively – better than Cluster 5, but worse than Cluster 6 - but a mixed pattern of improvement and worsening. Clearly, this interpretation of Cluster 2 is highly dubious, but the others are more plausible.
Analysing factors that affect outcomes
One of the most valuable potential uses of outcome data is to analyse the factors that are associated with better outcomes. This has value in its own right, but it is also an important component of performance measurement, to ensure that this is not distorted by possible confounding factors, such as the different case mix that providers have. The PROMS2 report analysed post-operative EQ-5D index scores in this way as ‘risk indicators’; here we analyse the Paretian change categories. Because some of these categories have small numbers of cases, the results should be interpreted with particular caution and regarded as indicative only of the potential of analysing the data in this way.
These outcome data are categorical, and cannot even be ordered because of the ‘mixed change’ category. We therefore estimated a multinomial logistic model, using Stata’s maximum-likelihood mlogit command. Because the analyses are for demonstration, we report analyses for cataract and hip operations only, chosen because they demonstrate very different patterns of outcome categories.
representing whether one or two eyes were operated on. We also examined models which included individual treatment centres instead of the centre type. However the results for other variables were very similar between the two models and as the analysis of centre types is of more interest in this context, especially since the centres were anonymous, the results including individual centres are excluded.
Table 5 shows the results. The baseline in each case is the category ‘No change’. For hip operations, there were no patients that fell into the ‘No problems’ category. In general the models were of low explanatory power, although that might be expected given the small number of observations.
For both cataracts and hips, the preoperative condition-specific measure had a significant impact on all categories except ‘Worsen’, and in each case the sign was as expected for ‘Improve’, representing a better outcome for a better condition-specific score4, and was the same for both ‘Improve’ and ‘Mixed change’. For cataracts, a better VF-14 score also raised the probability that the patient would be classified as having no problems. Neither age nor symptom duration had any effect on outcomes for either operation. For both operations, the number of co-morbidities decreased the probability of improved health, but had no other effect on outcomes; however cataract patients with more co-morbidities were less likely to be classified as having no problems. Sex had no impact except that male cataract patients were more likely to have a mixed-change outcome. The general health measure did not have any impact on outcomes, except that cataract patients with fair or poor health were less likely to be classified as having no problems. A higher IMD score raised the probability that cataract patients would improve and lowered the probability that hip patients would be classified as mixed change. Whether one or two eyes were operated on had little impact on cataract operation outcomes, though if two eyes were done, this raised the probability that the patient would be classified as having no problems. In general, centre type appeared to have little effect on outcomes, and those effects that were detected had no obvious pattern.
5. The EQ-5D as a performance measurement tool in the NHS: further challenges and remaining questions.
Measures of patient-reported health potentially have a number of important applications in health sector decision making, from macro-level analyses of NHS productivity to micro-level considerations of referral and demand management of patients. The introduction of PROMs in the NHS appears to have been motivated principally by the policy agenda around patient choice and the ‘payment by results’ reimbursement system. The performance of providers in improving patient health is the dominant consideration in patients’ stated preferences regarding choice of provider at the point of referral [21], and the PROMs initiative is in part a response to the need to generate data to inform those choices.
There are clearly other uses of the PROMs data reported here – for example, because the EQ-5D can generate ‘utility’ scores and therefore Quality Adjusted Life Years, the data would facilitate cost effectiveness analysis of the surgical procedures. The availability of condition-specific and generic health outcomes data can also be used to identify issues around the appropriateness of referral and surgery, and to develop explicit means of prioritising patients on waiting lists in terms of their ability to benefit [22]. However, the policy emphasis on patient choice and ‘Payment By Results’ means that the initial focus is on the use of the EQ-5D and other PROMs data to generate an indicator that identifies differences between providers in the production of
health benefit.
A PROMs-based performance indicator will provide a useful signal if the provider can influence patient reported health outcomes and if the provider’s influence can be isolated from other factors that might affect health outcomes – notably, the characteristics of the patients themselves and of the local health economy. While Browne et al (2007) examined the effect of patient and
clinical characteristics on health outcomes from surgery, they did not attempt to control for the influence of services received outside the hospital, following surgery [14]. For example, the quantity and quality of physiotherapy and other rehabilitation services received by patients after discharge may plausibly affect health outcomes attributed to a hospital, while not being under its control.
ensure that variations in hospital-level indicators reflect variations in performance ‘caused’ by the hospital, and to develop simple, high-impact ways of capturing the relevant differences.
Finally, the two ways of analysing and reporting EQ-5D profile data demonstrated in this paper, the Paretian Classification of Health Change and the Health Profile Grid, while essentially simple, yield some though provoking results. For example, with respect to cataract surgery, one third of patients receiving surgery report no problems on the EQ-5D before surgery and, following surgery, more patients reported a worsening in health than reported an improvement. These results are obscured somewhat when the analysis focuses just on the final (post-operative) outcome, and when the profiles are summarised by their values.
Taken at face value, these results might suggest important issues about the benefit of cataract surgery for some patients. Cataract removal is one of the most common operations performed in the NHS. While some of the worsening in health may be due to aging or deteriorations in co-morbidities, the size of the group reporting worse health after surgery, and the absence of corresponding improvements in any dimension of their health following surgery, is of concern.
And while the absence of any problems prior to surgery does not mean these patients are perfectly healthy, the value of treating such patients merits investigation, given the opportunity cost of the resources devoted to cataract surgery.
An alternative interpretation of these results is that the EQ-5D descriptive system is not sensitive enough to detect the particular effects on quality of life associated with visual problems. There is evidence elsewhere of the apparent failure of generic instruments, such as the SF-6D and EQ-5D, to reflect changes in visual acuity [23]; although others papers have shown clear relationships between reduced visual acuity and quality of life [22, 24].
Acknowledgements
We are grateful to the PROMs research team, led by Professor Nick Black, for providing access to the data used in this study. Helpful comments on this paper were received from David Nuttall, Jon Sussex and Adrian Towse, and from participants at the London Health Economics Group seminar at City University, October 2008.
Conflicts of interest
References
1. Food and Drug Administration. (2006) Guidance for Industry: Patient Reported Outcome Measures: Use in medical product development to support labelling claims. Draft Guidance. www.fda.gov/cder/guidance/index.htm
2. Bren L. (2006) The importance of patient-reported outcomes…Its all about the patients. FDA Consumer Magazine, November-December. Food and Drug Adminstration.
www.fda.gov.fdac/features/2006/606_patients.html (accessed 3rd February 2009).
3. National Institute for Health and Clinical Excellence (2008) Guide to the Methods of Technology Appraisals. Publication reference N1618. London: NICE.
4. Appleby J, Devlin N. (2004) Measuring success in the NHS: using patient assessed health outcomes to manage the performance of health care providers. London: Dr Foster.
www.drfoster.co.uk/library/reports/measuringSuccess.pdf
5. Office of Health Economics (2008) NHS Outcomes, performance and productivity. Report of
the Office of Health Economics Commission. OHE: London.
6. Kind P, Williams A. (2004) Measuring success in healthcare: the time has come to do it properly. Health Matters, issue no.9, University of York.
http://www.york.ac.uk/healthsciences/pubs/HPM9final.pdf
7. Department of Health (2008) Guidance of the routine collection of Patient Reported Outcome Measures (PROMs). Department of Health document DH_081179[1].pdf
8. Black N, Browne J, Cairns J. (2006) Health care productivity. British Medical Journal
333:312-3.
9. Advancing quality in the North West (2008) Health Service Journal 27 November.
www.hsj.co.uk/news/news_analysis/2008/11/advancing_quality_in_the_north_west.html
10. Office for Fair Trading (2007) The Pharmaceutical Price Regulation Scheme. An OFT Market Study. London: OFT. www.oft.gov.uk/shared_oft/reports/comp_policy/oft885.pdf
11. Darzi, Lord (2008) High Quality Care for all. NHS Next Stage Review: Final Report.
London: Department of Health
www.dh.gov.uk/en/Publicationsandstatistics/Publications/PublicationsPolicyAndGuidance/DH_ 085825
12. Brooks R, Rabin R, de Charro F. (eds) (2003) The measurement and valuation of health status using EQ-5D: A European perspective. Dordrecht: Kluwer.
13. Szende, A., Oppe, M., Devlin, N. (2007) EQ-5D valuation sets: an inventory, comparative review and users' guide. Rotterdam: EuroQol Foundation. Springer.
elective surgery. Report to the Department of Health. www.lshtm.ac.uk/hsru/research/PROMs-Report-12-Dec-07.pdf
15. https://www.poisaudit.org.uk/
16. Ware JE Jr, Sherbourne CD. (1992) The MOS 36-item short-form health survey (SF-36): I. Conceptual framework and item selection. Medical Care. 30 : 473-483.
17. Dolan P. (1997) Modelling valuations for EuroQol health states. Medical Care.
35(11):1095-108.
18. Parkin D, Rice N, Devlin N. (2009) Statistical analysis of EQ-5D profiles: does the use of value sets bias inference? Medical Decision Making (forthcoming).
19. Steinberg EP, Tielsch JM, Schein OD, Javitt JC, Sharkey P, Cassard SD, Legro MW, Diener WM, Bass EB, Damiano AM, Steinwachs DM, Sommer A (1994) The VF-14: an index of functional impairment in patients with cataract Archives of Ophthalmology. 112 : 630-638.
20. Fitzpatrick R, Dawson J (1997) Heath-related quality of life and the assessment of outcomes of total hip replacement surgery. Psychology and Health 12 : 793-803.
21. Burge, P, Devlin, N, Appleby J, Gallo F, Nason E, Ling T. (2006) Understanding patients’ choices at the point of referral. Technical report TR359-DOH, Cambridge: RAND Europe. www.rand.org/pubs/technical_reports/TR359/
22. Derrett S, Devlin N, Hansen P, Herbison P. (2003) Prioritising patients for elective surgery. A prospective study of Clinical Priority Assessment Criteria in New Zealand. International Journal of Technology Assessment in Health Care 19(1):91-105.
23. Espallargues, M., Czoski-Murray, C.J., Bansback, N.J., Carlton, J., Lewis, G., Hughes, L., Brand, C., Brazier, J. (2005) The impact of age-related macular degeneration on health status utility values. Investigative Ophthalmology and Visual Science 46: 4016-4023.
24. Clarke, P.M., Simon, J., Cull, C., Holman, R. (2006) Assessing the impact of visual acuity on quality of life in individuals with Type 2 diabetes using the SF-36. Diabetes Care 29:
Table 1. Numbers and proportions reporting levels within EQ-5D dimensions: pre- and post-operation for hip replacements.
Mobility Self-care Usual activities Pain/discomfort Anxiety/depression
Level
pre-op post-op pre-op post-op pre-op post-op pre-op post-op pre-op post-op
1 (4.3%) 19 (54.4%)239 (38.6%)168 (73.3%) 319 (3.4%) 15 (45.6%)199 (0.2%) 1 (50.5%)219 (55.5%) 240 (80.8%) 349
2 420
(95.7%)
200 (45.6%)
264 (60.7%)
115 (26.4%)
347 (79.6%)
221 (50.7%)
240 (55.3%)
200 (46.1%)
183 (42.4%)
74 (17.1%)
3 0
(0%)
0 (0%)
3 (0.7%)
1 (0.2%)
74 (17.0%)
16 (3.7%)
193 (44.5%)
15 (3.4%)
9 (2.1%)
9 (2.1%) Total5 (100%) 439 (100%) 439 (100%) 435 (100%) 435 (100%) 436 (100%) 436 (100%) 434 (100%) 434 (100%) 432 (100%) 432
Number reporting some problems6 (95.7%) 420 (45.6%)200 (61.4%)267 (26.6%) 116 (96.6%)421 (54.4%)237 (99.8%)433 (49.5%)215 (44.5%) 192 (19.2%) 83
Change in numbers reporting problems -220 -151 -184 -218 -109
% change in numbers reporting
problems -52% -57% -44% -53% -57%
Rank of dimensions in terms of %
changes 3 1= 4 2 1=
5 Results are for those who responded to both the pre- and the operative questionnaire. 84% of respondents to the pre-operative EQ-5D also responded to the
post-operative EQ-5D.
Table 2. Changes in health for five surgical procedures according to the Paretian classification
Hip Knee Hernia Veins Cataract
No change 21 (4.8%) 45 (10.0%) 127 (29.5%) 72 (27.1%) 335 (47.1%) Improve 356 (82.0%) 329 (73.3%) 203 (47.2%) 148 (55.6%) 149 (21.0%) Worsen 18 (4.2%) 34 (7.6%) 71 (16.5%) 34 (12.8%) 188 (26.4%) Mixed change 39 (9.0%) 41 (9.1%) 29 (6.7%) 12 (4.5%) 39 (5.5%)
Total 434 449 430 266 711
Table 3. Changes in health state for three conditions according to the Paretian classification, taking account of those with no problems
Hernia Veins Cataract
Number with problems (% of those with problems):
No change 53 (14.9%) 29 (10.9%) 99 (13.9%)
Improve 203 (57.0%) 481 (55.6%) 149 (21.0%)
Worsen 71 (19.9%) 34 (12.8%) 188 (26.4%)
Mixed change 29 (8.2%) 12 (4.5%) 39 (5.5%)
Total with problems 356 (82.8%) 223 (83.8%) 475 (66.8%)
No problems 74 (17.2%) 43 (16.2%) 236 (33.2%)
Table 4. Changes in health state for cataract operations in three different types of facility
Type 1 Type 2 Type 3 Total
Percentage of those with problems:
No change 18.5 21.0 22.1 20.8
Improve 39.3 35.2 25.1 31.4
Worsen 38.5 36.2 41.7 39.6
Mixed change 3.7 7.6 11.1 8.2
Percentage with no problems 40.8 28.1 30.3 33.2
[image:25.595.71.526.439.556.2]Table 5. Multinomial logistic regression analysis of factors affecting outcomes of cataract and hip operations
Cataracts No problems Improve Worsen Mixed change
Preoperative VF14 0.0230* (0.00968) -0.0225** (0.00821) -0.0142 (0.00790) -0.0333** (0.0105)
Male 0.110 (0.272) 0.274 (0.282) 0.177 (0.266) 0.811* (0.406)
Age -0.0255 (0.0145) 0.00773 (0.0153) 0.0106 (0.0145) 0.0121 (0.0217)
Symptom duration 0.00801 (0.0446) -0.0549 (0.0514) -0.0346 (0.0473) -0.0218 (0.0728)
Comorbidity -0.615*** (0.0980) -0.166* (0.0821) -0.136 (0.0753) -0.183 (0.122)
Fair/poor -1.548*** (0.439) -0.496 (0.342) -0.00499 (0.305) -0.0177 (0.477)
Eyes 0.667* (0.284) 0.177 (0.298) 0.254 (0.278) 0.0537 (0.421)
IMD score -0.00261 (0.0115) 0.0257* (0.0110) 0.0163 (0.0105) 0.0138 (0.0154)
Centre Type 2 -0.436 (0.386) -0.403 (0.386) -0.291 (0.381) 0.353 (0.663)
Centre Type 3 -0.749* (0.318) -0.762* (0.332) -0.171 (0.315) 0.796 (0.569)
Constant 2.069 (1.389) 2.034 (1.376) 1.091 (1.317) 0.0639 (1.918)
N = 679; Log likelihood = -894.2, χ2(40) = 222.9, P < 0.0000; Pseudo R2 = 0.1108
Hips Improve Worsen Mixed change
Preoperative Oxford 0.113** (0.0350) 0.0364 (0.0472) 0.0817* (0.0411)
Male 0.512 (0.541) 0.244 (0.735) 0.453 (0.636)
Age 0.0365 (0.0270) -0.00433 (0.0369) 0.0378 (0.0322)
Symptom duration -0.0153 (0.0506) -0.0740 (0.0917) -0.00502 (0.0584)
Comorbidity -0.385* (0.176) -0.0768 (0.248) -0.125 (0.200)
Fair/poor -0.320 (0.679) -1.395 (1.256) 0.324 (0.771)
IMD score -0.0277 (0.0154) -0.0232 (0.0243) -0.0393* (0.0195)
Centre Type 2 1.022 (1.103) 1.049 (1.372) 2.524* (1.218)
Centre Type 3 0.534 (0.567) 0.366 (0.808) 1.360 (0.725)
Centre Type 4 -0.286 (0.867) 0.545 (1.099) 0.817 (1.056)
Constant -3.163 (2.352) -0.538 (3.196) -5.329 (2.858)
N = 410; Log likelihood = -246.4, χ2(30) = 46.72, Prob > 0.0265; Pseudo R2 = 0.0866
Figure 1. Funnel plot of post-operative EQ-5D scores in hip replacement surgery
.5
.6
.7
.8
.9
1
Po
st
-o
p
e
ra
ti
v
e
EQ
-5
D
sco
re
10 15 20 25 30 35 40 45 50 55 60 65
Number of operations
Source: Browne et al (2007) [7]. Reproduced with the permission of the authors.
Q
N
D K
O
W
T F
J
Figure 2. Changes in health for the five surgical procedures, according to the Paretian Classification of Health Change.
Hips
Varicose veins
Cataracts
Knees
Hernia
No change
Improve
Figure 3. Changes in health state for three conditions according to the Paretian Classification of Health Change, accounting for those with no problems7
Overall Including ‘No problems’ Excluding ‘No problems’
17.21 12.33 47.21 16.51 6.744 0 10 20 30 40 50 Pe rc e n t
No problems No change Improve Worsen Mixed change Change in profile
Hernia 29.53 47.21 16.51 6.744 0 10 20 30 40 50 Pe rc e n t
No change Improve Worsen Mixed change Change in profile
Hernia 14.89 57.02 19.94 8.146 0 20 40 60 Pe rc e n t
No change Improve Worsen Mixed change Change in profile
Hernia 16.17 10.9 55.64 12.78 4.511 0 20 40 60 Pe rc e n t
No problems No change Improve Worsen Mixed change Change in profile
Veins 27.07 55.64 12.78 4.511 0 20 40 60 Pe rc e n t
No change Improve Worsen Mixed change Change in profile
Veins 13 66.37 15.25 5.381 0 20 40 60 80 Pe rc e n t
No change Improve Worsen Mixed change Change in profile
Veins 32.91 13.81 20.92 26.5 5.858 0 10 20 30 40 Pe rc e n t
No problems No change Improve Worsen Mixed change Change in profile
Cataract 46.72 20.92 26.5 5.858 0 10 20 30 40 50 Pe rc e n t
No change Improve Worsen Mixed change Change in profile
Cataract 20.58 31.19 39.5 8.732 0 10 20 30 40 Pe rc e n t
No change Improve Worsen Mixed change Change in profile
Cataract
7 A disadvantage of histograms, compared to pie charts, is that the positioning of the bars on the horizontal axis is problematic. While there is an argument for placing ‘no
Figure 4. Health Profile Grid for hip operations
11
11
1
33
3
3
3
Bef
o
re
11111 33333
After
Improve No change Worsen
Hip
Figure 5. Health Profile Grid for hernia operations
11
11
1
33
3
3
3
Be
fo
re
11111 33333
After
Improve No change Worsen
[image:30.595.78.473.447.727.2]Figure 6. Health Profile Grid for cataract operations
11
11
1
33
3
3
3
Bef
o
re
11111 33333
After
Improve No change Worsen
Figure 7. Health Profile Grids for hip and cataract operations, incorporating the Paretian Classification of Health Changes
11
11
1
33
3
3
3
Bef
o
re
11111 33333
After
Improve No change Worsen Change
Hip
11
11
1
33
3
3
3
Be
fo
re
11111 33333
After
Improve No change Worsen Change
[image:32.595.77.474.117.700.2]Figure 8. Health Profile Grid for cataract operations, by facility type 1 1 1 1 1 11 1 1 1 1 1 1 1 1 1 1 1 1 1111
1 1 1 1 1 1 1 1 1 1 1 1 1 1 1 1 1 1 1 1 1 1 1 1 1 1 111 111 1 1 1 1 1 1 1 1 1 1 1 1 11 1 1 1 1 1 11 1 1 1 1 1 1 1 1 1 1 1 1 11 1 1 1 1 1 1 1 1 1 1 1 1 1 1 1 1 11 1 1 1 1 1 1 1 1 1
1 1 1
1 1 1 1 1 1 1 1 1 1 1 1 1
1 1 2
2 2 2 2 2 2 2 2
22 2
2
2 22 2 2 2 2 22 2 2
222
22 2
2 2 2 2 2 2 22 2 2 2 2 2 2 2 2 2 2 2 2 2 2 2 2 2 2 2 2 2 2 2 2
22 22
2 2 2 2 2 2 2 2 2 2 2 2 2 2 2 2 2 2 2 2 2 2 2 2 2 2 2 2 2 2 2 2 2 2 2 2 2
2 3 2
3
3 3 3
3 33
3 3 3 3 3 3 3 3 3 3 3 3 3 3 3 3
3 33 3 3 3 3 3 3 3 3 3 3 3 3 3 3 3 3 3 3 3 3 3 3 3 3 3 3 3 3 3 3 3 3 3 3 3 3 3
3 333 3
3 3 3 3 3 3 3 3 3 3 3 3 3 3 3 3 3 3 3 3 3 33 3 3 3 3 3 3 3 3 3
3 33 3
3 3 3 3 3 3 3 3 3 3 3 3 3 3 3 3 3 3 3 3 3 3 3 3 3 3 3 3
33 3
3 3 3 3 3 3 3
3 3 3
3 3 3 3 3 3 3 3 3 3 3 3 3 3 3 3 3 33 3 3 3 333
3 3 3 3 3 3 3 3 3 3 3 3 3 3 3 3 3 333 3 3 3 3 3 3 3 3 3 3 3 3
33 3
3 3 3 3 3 3 3 3 3
3 33 3
3 3 3 3 3 3 3 3 3 3 3 3 3 3 3 3 11 1 1 1 33 3 3 3 Be fo re 11111 33333 After
Cataract
Figure 9. Health Profile Grid showing clusters of changes in health state for hip operations
1 11
1
1 1 11 1 1 1 1 1 1 1 1 1 1 1 1 1
11 1
1 1
1 1 1
1
11 1 1 1
2 2 2 2 2 2 2 2 2 2 2 2 2 2 2 2 2 2 2 22 2 2 2 2
2 22 2 2 2
2 2
2 22
2 2 2 2 2 2 2 2 2 2 2 2 2 2 2 2 2 2
2 22
3 3
3 33
3 333 3 3 333333 33333
33 3 33
3 3
33 3 33 3
3 3 333
3 3
3 3
33 3 33 33 333 333 3
33 3
3
3 3 3
4 4 4 4 4 4 4 4 4 4 4 4
4 4 4
4 4 4 4 4 4 4 4 4 5 5 5 55 5 5 5 5 5 5 5 5 5 5 5 5 5 5 5 5 5 5 5 5 5 555 5 5 5 5 5 5 5 5 5 5 5 5 5 5 5 5 5 5 5 5 5 5 5 5 555 5 5 5 5 5 5 5 5 5 5 5 55 5 5 5 5 5 5 5 5 5 5 5 5 5 5 5 55 5 5 5 5 5 55 5 5 5 5 5 5 5 5 5 5 5 55 5 5 5 5 5 5 5 5 55 5 5 5 5 5 5 5 5 55 5 55555
5 5 5 5 5 5 5 5 55 5 5 5 5 5 5 5 5 5 5 5 5 5 5 5 55 5 55 5 5 5 5 5 5 5 5 5 5 5 5 5 6 6 6
6 6 6
6 6 66 6 6 6 6 6 6 6 6 6 6 6 6 6 6 6 6 6 6 6 6 6 6 6 6 6 6 6
6 6 6
[image:33.595.79.475.468.752.2]