COTS Developers Lead Best Practice Adoption
Aileen P Cater-Steel
Department of Information Systems
Faculty of Business
The University of Southern Queensland
Toowoomba, Australia
Email:
[email protected]
Abstract
As part of an Australian National Industry Improvement Program, a software development 'best practice' survey was conducted in Queensland. The questionnaire was adapted from the European Software Institute's (ESI) Best Practice Questionnaire and the preliminary findings from Queensland are compared with the ESI's 1997 results. This paper explains the background and aims of the study, the execution of the survey, and presents some interesting findings related to levels of adoption of best practice. Analysis of the 205 responses revealed that the leaders in best practice adoption are organisations involved in developing commercial off-the-shelf (COTS) systems. A comparison of the use of software engineering practices is made between COTS and non-COTS developers.
1. Introduction
In recent years, concern has been expressed about the need for the Australian Computer Services industry to achieve global competitiveness [11, 15]. Software process improvement (SPI) is recognised as having the potential to improve competitiveness by increasing productivity; reducing costs, defect and rework; and improving time to market and customer satisfaction [9].
In the 1995-96 financial year, income in Australia from software consultancy and maintenance services, and packaged software development totalled over $3 billion, with 9,673 businesses employing about 55,000 persons [1]. In formulating national policies and programs for the industry, it must be remembered that the computer services industry is dominated by very small businesses - 88 percent employ less than five persons [2]. This presents a challenge in terms of determining the current practices of industry participants, and in devising improvement initiatives which are feasible for these very small organisations.
This paper details the background, execution and some interesting findings of a survey recently conducted in Queensland. The survey, which forms part of the National Industry Improvement Program (NIIP), was conducted by SEA Queensland and the Software Quality Institute (SQI) of Griffith University. The aim of the survey was to determine to what extent software developers are using best practice techniques. The survey has been conducted initially in Queensland, but is planned to be used in all Australian states.
A best practice is defined as "a management practice that is widely recognised as excellent and is recommended by most practitioners and experts in the field" [10]. The ESI survey instrument groups practices under five headings:
• organisational issues eg. project management, change control, training programmes for managers; • standards and processes eg. formal assessment of
benefits and risks, management reviews, control of subcontractors, independent audits, coding standards, formal handovers, test planning;
• metrics eg. records of actual and estimated resources, error sources, test efficiency, computer performance, project tracking;
• control of the development process eg. accountability for estimates and schedules, requirements management, control of code and specification changes, regression testing;
• tools and technology eg. use of design notations, automated testing tools, prototyping, data dictionary, project management tools.
As far as this researcher can ascertain, the ESI set of best practices does not map directly to any recognised SPI model (eg. Capability Maturity Model, Bootstrap or SPiCE), but has been derived to aid the assessment of project proposals to the European Commission for SPI funding applications [20].
exploring the distribution of the variable representing adoption of best practice. Then comparisons are made between the extent and variety of practices adopted by COTS developers, compared to developers who do not develop COTS systems. The discussion suggests factors which may explain the difference in adoption levels, and then the conclusion looks at how the results of this study may benefit the software industry in Australia.
2. Background
Software Engineering Australia Limited (SEA) is a newly-formed not-for-profit association, funded under grants and in-kind contributions from the Australian Federal Government, State governments, universities and the private sector. Its aim is to coordinate national expertise and resources to deliver internationally competitive software engineering environment skills throughout Australia [19]. Each State-based resource centre offers a range of facilities, including information services, education and training, technical problem solving and process improvement activities [18]. In 1997, the Minister for Industry, Science and Tourism commissioned a report by the Information Industries Taskforce: "The Global Information Economy: the Way Ahead". One of the recommendations (action 2.4) was to "support the collection and dissemination of improved industry statistics and undertake regular benchmarking" [11 p.6]. Consequently, as part of the NIIP, SEA Qld and SQI undertook a survey to determine the level of adoption of best practice by software developers in Queensland. The results of the survey will be used to determine strategies to improve the processes used by software developers. Although the survey is not specifically designed to analyse training needs, the results do highlight topics for potential training courses. The survey responses will also be used to identify 30 organisations to participate in SEA's 'Faster Better Cheaper Process Improvement' Program.
3. Methodology
The unit of analysis was Queensland organisations undertaking software development. The target population was all organisations in Queensland which develop software for sale (custom and COTS developers) and in-house software developers of large organisations. Several sampling frames were used as a single list of all developers was not available. Rather than identify a sample of the population, the aim was to reach the entire population of organisations which develop software.
A list of 5,600 likely organisations was compiled sourced from the Australia on Disk and MIS 3000 databases and contact lists from the Queensland
Government's Information Industries Board (IIB) and SQI.
Survey design
To overcome constraints of time and cost, it was decided to approach ESI for permission to customise and use the European Software Institute (ESI) questionnaire. Permission was granted on condition that minimal changes were made, and that the Australian results would be made available to ESI for comparison with the European data. During the pretest, concerns were raised about the section headings and question groupings of the ESI questionnaire. It was decided to group the questions in more of a lifecycle sequence so that very small developers would feel less threatened by the survey format, and thus respond more readily. The new headings used were Requirements and Design; Code and Test; Configuration Management; Estimates and Schedules; and Project Management and Training.
The format of the questionnaire was changed to appear more compact, and the few double-barrel questions were split to reduce ambiguity. Two additional questions were included in the body of the questionnaire to provide information relating to the use of programming languages and development tools. The International Software Benchmarking Standards Group (SBSG) Benchmark Release 5 report [12] was used to provide a list of the 12 most common languages. To further customise the instrument to local conventions, the ANZSIC list of industrial sectors was used in place of the European sector breakdown.
Data collection and analysis
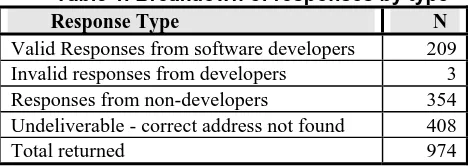
[image:2.595.309.543.621.704.2]A total of 5,600 survey forms were mailed in January 1999 with a cover letter and reply-paid envelope. Of these, 525 surveys were returned as 'undeliverable', all these addresses were checked using the Telstra White Pages web site and 117 of these surveys were re-addressed and sent to the correct addresses. In March, SEA and SQI engaged a tele-marketer to contact 450 organisations by phone in a targeted follow-up. A further 200 surveys were sent as a result of this activity.
Table 1. Breakdown of responses by type
Response Type N
Valid Responses from software developers 209 Invalid responses from developers 3 Responses from non-developers 354 Undeliverable - correct address not found 408
Table 1 provides a breakdown of the number of survey responses.
A web site was created to enable data entry and only responses from software developers are being keyed in at this stage, although large organisations which acquire software may be involved in other phases of the NIIP. Survey data has been analysed using Microsoft Excel and SPSS. These programs were used to provide descriptive statistics, assess normality, and calculate correlations.
4. Findings
Primary involvement in software industry
It was recognised that organisations may play a variety of roles in the software industry. For example, most large organisations would develop and use in-house systems as well as purchasing 3rd party software.
Also, many software development companies produce off-the-shelf packages as well as providing custom systems to clients.
[image:3.595.54.283.432.610.2]The survey included a question to determine the primary involvement of organisations in the software industry. Although the question was worded to encourage respondents to select only one option as their primary involvement, the results (in table 2) show many respondents elected to select more than one option.
Table 2. Responses to primary involvement question
Primary Involvement in Industry N
Software user - developed in-house 54 Software user - developed by a 3rd party 44 Software developer producing off-the-shelf
systems
88
Software developer producing custom software systems
128
Research and Development Institute or University
10
Interest Group eg professional society or standards body
2
Other 5 Total options selected
Average options selected per respondent
331 1.6
Adoption levels
For each response, the level of adoption of the best practices was calculated. The number of 'yes' responses to the 43 best practice questions were summed and a percentage calculated based on the proportion of 'yes' responses to 'yes' and 'no' responses. Blank and 'not applicable' responses were ignored in this calculation. Of
the 209 valid responses, four provided demographic details but left the best practice section blank. These four responses have been excluded from analysis of adoption.
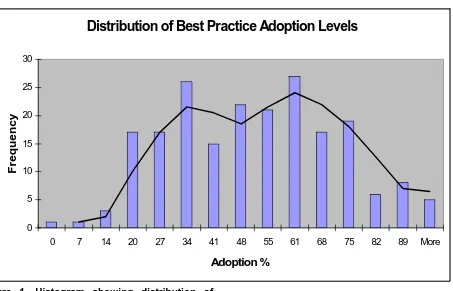
The mean adoption level of 47.5 percent with a standard deviation of 21 percent is slightly lower than the average reported by the ESI from its 1997 questionnaire (51% s.d.21%) [10].
A histogram of adoption levels was produced, and rather than the expected normal distribution, a bi-modal distribution has occurred as shown in figure 1.
Adoption levels by size
Two questions relating to size were included in the survey. The first question related to the total number of employees in the organisation and the second to the number of employees involved in software development or maintenance. On the basis of the total number of staff, organisations were scaled as small (less than ten staff); medium (10 - 500 staff); and large (more than 500 staff). As can be seen in table 3, adoption of best practice appears to be associated with organisation size. Large organisations exhibited significantly greater adoption than medium organisations, which in turn out-performed small companies.
Table 3. Average adoption levels by organisation size
Organisation Size N Average Adoption Level
Small: less than 10 staff 129 44.0% Medium: 10-500 staff 65 52.9% Large: more than 500 staff 11 56.4%
Looking at size from the perspective of the number of software developers engaged in programming or maintenance, a stronger pattern emerges.
Table 4. Average adoption by development team size
Size of Development Team N Average Adoption Level
Small: 0-5 developers 139 43.0% Medium: 5-50 developers 58 54.9% Large: 50-500 developers 8 71.7%
Distribution of Best Practice Adoption Levels
0 5 10 15 20 25 30
0 7 14 20 27 34 41 48 55 61 68 75 82 89 More
Adoption %
[image:4.595.73.526.74.365.2]Frequency
Figure 1. Histogram showing distribution of adoption levels and moving average trendline.
Assessing normality
Prior to undertaking any correlation analysis to statistically prove the association between variables such as organisation size and adoption of best practice, the characteristics of the data were explored in order to ensure the correct statistical approach was selected. The assumption of normality is a prerequisite for many inferential statistical techniques.
As advised by Coakes & Steed [6] the Lilliefors statistic was calculated to assess if the distribution of adoption level was distributed normally. The significance level of this test on the 205 responses was less than the required level of .05, indicating that normality cannot be assumed.
[image:4.595.311.536.378.596.2] [image:4.595.308.538.382.596.2]It was then decided to select smaller groups of responses to assess the normality of the adoption level within each group. Firstly, the total number of employees in the organisation was used to group responses. Organisations with less than ten staff were selected. This group did not exhibit a normal distribution in regard to the variable adoption level. Next, the 139 respondents with small development teams (of up to five staff) were assessed. This group also failed the test of normality in regard to adoption level. On the basis of the options selected for organisation's primary involvement in the industry, a series of groups were assessed.
Table 5. Lilliefors statistic for selected groups
Group Selected K-S (Lilliefors)
Df Sig
All responses .067 205 .025 Small organisations
(<10 staff)
.087 129 .017
Small development team (0-5 staff)
.084 139 .018
Does not develop COTS
.057 117 >.200
COTS Software Developer
.088 88 .085
Custom developers .099 128 .004 Developers (COTS or
Custom)
.090 167 .002
Software Users (in-house or 3rd party)
.075 62 >.200
Non-users .087 143 .009
The results presented in table 5 show that the complimentary groups of COTS and non-COTS developers were the only subsets of responses which exhibit a normal distribution for the variable adoption level.
positively skewed, and the negative kurtosis shows them to be flatter than a normal distribution (see table 6).
Table 6. Skewness and kurtosis for adoption
Developer Group
Skewness Kurtosis
Non-COTS .18 -.55
COTS .11 -.89
To confirm that the COTS and non-COTS developers represent different populations, the Independent Groups t-test was conducted. There are two assumptions for this test:
1. Independence of groups - subjects should appear in only one group and these groups are unrelated; 2. Homogeneity of Variance - the groups should come
from populations with equal variances.
The first assumption was met as the variable COTS was set to zero (indicating the respondent was not a COTS developer) if the COTS option was not selected. To check the second assumption, Levene's test was used to check for equality of variance. This test confirmed that the population variances are relatively equal (P=.402).
Therefore, it is acceptable to use the t-test for equality of means to determine whether COTS/non-COTS differences exist. This test indicates that the two groups (non-COTS and COTS) come from different populations (p<.05).
To prove statistically if size is associated with adoption of best practice, Pearson product moment correlation coefficient was calculated to firstly describe the relationship between adoption levels and organisation size, and secondly between adoption levels and the size of the software development teams. As the COTS and non-COTS responses come from two different populations, the tests were executed on each group.
A significant positive relationship was found between adoption levels and the size of the development team for both COTS and non-COTS groups (COTS: r=.3016, p<.05; non-COTS: r=.2658, p<.05). However, the relationship between adoption levels and organisation size was not confirmed for either COTS or non-COTS developers.
Adoption levels by primary involvement
In comparing adoption levels of COTS and custom software developers, highest adoption of best practice was reported from organisations which develop COTS software (see table 7). According to the CEO of SEA Qld, Phil Scanlan, the large number of developers (88) who saw their primary role as COTS developers reflects
the large concentration of vertical niche market package developers in the Brisbane area.
Table 7. Comparison of adoption levels for COTS and custom developers
Developer Type N Average
Adoption Level
Develop COTS software 88 51.8% Do not develop COTS software 117 44.3% Develops Custom software 128 47.9% Does not develop Custom
software
77 46.8%
[image:5.595.309.537.347.651.2]As can be seen from the adoption level breakdown by country (table 8), best practice in Queensland rates higher than a number of European countries. However, care should be exercised in comparisons at this stage as full details of the ESI calculation method have not been published.
Table 8. Overall responses and average adoption level by country (source: [10])
Country Number of
Responses
Average Adoption Level
France 18 65%
United Kingdom 52 60%
Greece 18 57%
Denmark 17 55%
Finland 4 55%
Norway 6 53%
Austria 16 53%
Italy 77 52%
COTS developers Qld, Australia
88 52%
Netherlands 30 49%
Germany 62 49%
Queensland, Australia 205 47.5%
Israel 11 46%
Ireland 12 45%
Non-COTS developers, Qld, Australia
117 44%
Spain 34 44%
Belgium 15 43%
Sweden 13 32%
question by question basis, it was found that for the following five practices, COTS developers reported adoption levels of at least 17 percent higher than the non-COTS developers:
• Maintain records from which all current versions and variants of software systems and their components can be quickly and accurately reconstructed in the development environment • Establish a change control function for each
software project
• Log, track and analyse post-implementation software problem reports
• Apply common coding standards to each software project
• Use software tools used for tracking and reporting the status of the software /subroutines in the software development library.
In fact, there was only one practice where non-COTS developers exhibited higher adoption: the use of automated testing tools.
[image:6.595.307.540.132.329.2]The ESI report [10] groups the practices under five headings: organisational issues; standards and processes; metrics; control of the development process; and tools and technology. As can be seen from the data provided in table 9, COTS developers, although only showing an adoption level of 42 percent on the metrics group of practices, are exhibiting more advanced use of metrics compared to the non-COTS developers (31%).
Table 9. Comparison of adoption by ESI groups
Average Adoption Levels Software
Engineering Practice Group
Non-COTS
COTS Difference
Organisational Issues
44.11 53.23 9.12
Standards and Processes
48.67 53.52 4.85
Metrics 30.73 41.92 11.19
Control of Development Process
47.19 51.91 4.72
Tools and Technology
39.84 44.93 5.10
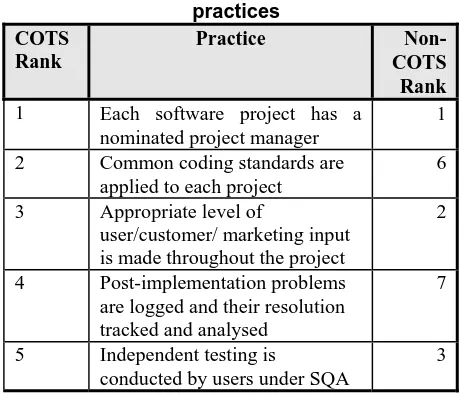
To gain an understanding of which software engineering practices are most used in Queensland, the highest scoring questions were collated and ranked for COTS and non-COTS developers (refer to table 10).
Three of the most popular practices relate to coding and testing, the other two involve requirements and project management. This is not surprising, as the importance of these practices has been recognised in the
industry press and stressed in information systems and software engineering training courses for some time.
Table 10. Most used software engineering practices
COTS Rank
Practice
Non-COTS Rank
1 Each software project has a nominated project manager
1
2 Common coding standards are applied to each project
6
3 Appropriate level of
user/customer/ marketing input is made throughout the project
2
4 Post-implementation problems are logged and their resolution
tracked and analysed
7
5 Independent testing is
conducted by users under SQA
3
5. Discussion
Why are COTS developers exhibiting higher adoption of best practice techniques compared to their non-COTS counterparts? One reason could be that, due to the limited size of the domestic market, COTS developers are competing in the global marketplace. In order to be commercially successful, these developers may have realised that their software processes must be of a high standard to respond quickly with a quality software product. In contrast, the overall shortage of information technology staff may have caused complacency amongst in-house and custom developers. This staff shortage offers a sense of job and contract security, their clients may be prepared to suffer poor practices rather than risk delayed development.
However, in studying the adoption of structured systems analysis techniques, Leonard-Barton [14] found that, contrary to expectations, more experienced analysts were more likely to use the new processes than were their less experienced colleagues. She explains this by suggesting that the veterans were more aware of the potential benefits of the new techniques. Adoption of best practice involves similar training and documentation activities to structured systems analysis, so it may be expected that experienced systems analysts would also be more likely than novices to adopt software engineering best practice techniques.
In a Korean study more closely related to this one, Lee and Kim [13] expected that the degree of procedural formalisation would be positively associated with the age of the MIS department. They were surprised to find a significant negative effect, and acknowledge the inertia effect which may prevent the adoption of modern software development methodologies by older MIS departments.
So, while results of previous research in this area have been inconclusive, Bawden’s [3] emphasis on the value of reputation may suggest a solution: long-established organisations may have gained the trust of their clients, enabling them to compete on reputation and past performance. In contrast, new organisations may see adoption of best practice as a competitive necessity to break into the market.
The positive association between adoption of best practice and the size of the development team is consistent with prior studies. In the diffusion of innovation literature, it has been reported that organisational size and structural complexity are related to the adoption of innovations (e.g. [17]). This is exemplified in Zmud’s [23] modern software practices study, one of the three administrative process innovations was the unit development folder which:
... collects into an electronic folder all of the artefacts involved in the development of a single-programmer software unit: unit requirements, design, code, test cases, test results, and documentation. It also includes a management template for tracking the programmer’s schedule and actual completion of each artefact [4, p. 522].
The adoption of the unit development folder requires a standardised approach to documenting processes and project progress, and thus would be similar to the adoption of software engineering best practice. Zmud [23] found that size was positively associated with technical innovation adoption (such as top down design, structured design, structured reviews) but had a negative influence with the implementation of administrative innovations (such as chief programmer team, configuration management and unit development folder).
He offers the possible explanation that ‘... larger software groups require more software managers and that this larger decision body would experience difficulty in making administrative adoption decisions and in implementing those decisions’ [23, p. 1428].
Considering the cost overhead involved in implementing SPI initiatives, it is likely that the decision to adopt best practice would probably be made at the most senior level of management, not by individual software managers.
In analysing the relationship between quality practices and development group size in Singapore, Tan and Yap [21] suggest that small development groups may be constrained by their resources and preoccupied with fire-fighting techniques of error detection. On the other hand, large organisations are ‘... able to explore greater avenues of process management, like design and code reviews, change controls and the use of sophisticated tools and techniques’ (p. 234). After using ISO 9001 clauses to determine capability maturity, Tan and Yap [18] found that size was associated with maturity.
For their UK study, Davis, Gillies, Smith and Thompson [7] anticipated that larger organisations would be ‘... able to afford both the time and money for a third-party audit’ (p. 158). They found that the number of staff employed on software development provided a better indication of certification levels, than the total number of staff in the organisation. Similarly, in their Australian study relating to adoption of quality assurance and capability maturity, Cater-Steel and Fitzgerald [5] confirmed a strong positive association between the number of software developer staff and the organisation's progress towards certification.
In their study of small Italian software firms, Raffa and Zollo [16] noted that small firms are disadvantaged in regard to adopting innovations. Their comments, made about innovations generally, can be applied to the adoption of software development best practice. The large company usually:
• has the financial, organisational and human resources necessary to manage a variety of activities (eg. QA, metrics);
• can maintain software process improvement professionals inside the company;
• can use effectively the past experience with methodologies to foster new process improvements;
6. Conclusions
It is recognised that results from a survey such as this provide a rosy view of the industry [10]. Best practice could be exaggerated due to optimistic self-reporting. However, the results do provide an interesting profile of the software industry in Queensland, and the difference in adoption of various practices by COTS and non-COTS developers. Also, SEA Qld and SQI now have a large target list of up-to-date contacts which can be used to plan assessments, training courses and other elements of the National Industry Improvement Program.
The challenge now is how to identify appropriate software process improvement models, techniques and tools suitable for the myriad of very small software development organisations whose organisational structure cannot support the conventional set of best practice techniques. Thompson [22] is concerned that technology transfer of appropriate software engineering practices is inhibited by poor attitudes, held by management and developers, to change. He advises that the software development community needs a much better understanding of the practices, their use and potential actual benefits. As an outcome of their role in the NIIP, SEA and SQI plan to publish case studies of SPI success, hopefully local developers will appraise such information in an impartial manner and adopt best practice willingly and with enthusiasm. The Federal Government's support for software incubators, such as the one operating at SEA Qld, promises an opportunity for small start-up companies to overcome traditional resource limitations. These steps may facilitate the achievement of the goal of improved global competitiveness for the Australian software industry.
REFERENCES
[1] ABS (1997) Computing Services Industry, Australia
1995-96, Australian Bureau of Statistics, Canberra.
[2] ABS (1997) Information Technology in Australia 1995-96,
Australian Bureau of Statistics, Canberra.
[3] Bawden, V. (1994), Software Quality Certification: A Rational Client's Perspective. MIT Thesis, UQ, Brisbane. [4] Boehm, B.W. (1990), 'A Spiral Model of Software
Development and Enhancement', in System and Software
Requirements Engineering, Thayer, R.H. & Dorfman M. IEEE Computer Society Press, Los Alamitos, CA, pp. 513-38.
[5] Cater-Steel A.P. & Fitzgerald E.P. (1998), ‘Australian Software Developers Embrace Quality Assurance Certification', in SQM ’98 Proceedings (Amsterdam).
[6] Coakes, S. & Steed, G. (1996) SPSS for Windows: Analysis without anguish, Wiley, Brisbane
[7] Davis, C.J., Gillies, A.C., Smith, P., & Thompson, J.B. (1993), 'Current Practice in Software Quality and the Impact
of Certification Schemes', Software Quality Journal, vol. 2,
pp. 145-61.
[8] Eisenhardt, K.M. (1988), 'Agency- and Institutional-Theory Explanations: the Case of Retail Sales Commission',
Academy of Management Journal, vol. 31, no. 3, pp. 488-511.
[9] El Emam K. & Briand, L. (1997) Costs and Benefits of Software Process Improvement, International Software Engineering Research Network technical report, ISERN-97-12.
[10] ESI (1999) European Software Institute 1997 Software Best Practice Questionnaire: Analysis of Results, URL
http://www.esi.es/Publications/Reports/tr-sbpqaor3.htm. [11] Goldsworthy, A. (1997) The Global Information Economy
- The Way Ahead - Executive Summary, Report of the Information Industries Taskforce, DIST, Aug 1997.
[12] ISBSG (1998) International Software Benchmarking Standards Group: The Benchmark Release 5, URL http://www.isbsg.org.au/bmark5.htm.
[13] Lee, J. & Kim, S. (1992), 'The Relationship Between Procedural Formalization in MIS Development and MIS
Success', Information and Management, vol. 22, no. 2, pp.
89-111.
[14] Leonard-Barton, D. (1987), 'Implementing Structured Software Methodologies: A Case of Innovation in Process
Technology', Interfaces, vol. 17, no. 3, pp. 6-17.
[15] McKerlie Consulting (1996) Needs Analysis for Enhancement for Software Development Capability within Australian Industry, DIST.
[16] Raffa M. & Zollo G. (1993) 'The Role of Professionals in
Italian Small Software Firms', Proceedings 2nd International
Conference on Achieving Quality in Software, Venice, Italy, pp.335-48.
[17] Rogers, E.M. (1995), Diffusion of Innovations, Free Press,
New York.
[18] SEA (1999) Overview of SEA, URL
http://www.sea.net.au.
[19] SEAQ (1997) Software Engineering Network Business Plan - Technical Support Centres Program, v1.0A, Sept 1997.
[20] Smith, R. (1999) Proceedings of the Software Engineering
Conference SEA'99, Canberra, April.
[21] Tan, M. & Yap, C.Y. (1995), 'Impact of Organisational
Maturity on Software Quality', in Software Quality and
Productivity: Theory practice, education and training,
Editors M. Lee, B. Barta, & P. Juliff, Chapman and Hall for IFIP, London, pp. 231-4.
[22] Thompson, J.B. (1994) The Development of Quality
Software: Problems and Solutions, Software Quality Concern
for People: Proceedings of the 4th European Conference on Software Quality, Oct 17-20, 1994, Basel, Switzerland, 448-456.
[23] Zmud, R.W. (1982), 'Diffusion of Modern Software Practices: Influence of Centralization and Formalization',

![Table 8. Overall responses and average adoption level by country (source: [10])Country Number of Average](https://thumb-us.123doks.com/thumbv2/123dok_us/360293.67309/5.595.309.537.347.651/overall-responses-average-adoption-country-country-number-average.webp)