This is a repository copy of Transient overshoot extensional rheology of long chain branched polyethylenes: experimental and numerical comparisons between filament stretching and cross-slot flow.
White Rose Research Online URL for this paper: http://eprints.whiterose.ac.uk/74712/
Article:
Hoyle, DM, Huang, Q, Auhl, D et al. (6 more authors) (2013) Transient overshoot
extensional rheology of long chain branched polyethylenes: experimental and numerical comparisons between filament stretching and cross-slot flow. Journal of Rheology, 57 (1). 293 - 313 . ISSN 0148-6055
https://doi.org/10.1122/1.4767982
[email protected] https://eprints.whiterose.ac.uk/ Reuse
See Attached Takedown
If you consider content in White Rose Research Online to be in breach of UK law, please notify us by
Transient overshoot extensional rheology of long chain
branched polyethylenes: experimental and numerical
comparisons between filament stretching and cross-slot
flow
D. M. Hoyle,1, 2,∗ Q. Huang,3 D. Auhl,4, 5 D. Hassell,6, 7 H. K. Rasmussen,8 A. L. Skov,3 O. G. Harlen,2 O. Hassager,3 and T. C. B. McLeish1, 9
1
Department of Chemistry, University of Durham, Durham DH1 3LE, United Kingdom
2
Department of Applied Mathematics, University of Leeds, Leeds LS2 9JT, United Kingdom
3
The Danish Polymer Centre, Department of Chemical and Biochemical Engineering, Technical University of Denmark, DK-2800 Kgs. Lyngby, Denmark
4
Interdisciplinary Research Centre for Polymer Science and Technology (IRC), University of Leeds, Leeds LS2 9JT, United Kingdom
5
Institute of Condensed Matter, Bio- and Soft Matter, Universit´e Catholique de Louvain, Louvain-la-Neuve, Belgium, B-1348
6
Department of Chemical Engineering, University of Cambridge, Cambridge, CB2 3RA, United Kingdom
7
Institut Teknologi Brunei, Jalan Tungku Link, Gadong BE1410, Brunei Darussalam
8
The Danish Polymer Centre, Department of Mechanical Engineering, Technical University of Denmark, DK-2800 Kgs. Lyngby, Denmark
9
Department of Physics, Durham University, Durham, DH1 3HP, United Kingdom
(Dated: October 31, 2012)
Synopsis
This work analyses the high-strain extensional behaviour of long chain branched (LCB) polyethylenes, employing two novel extensional rheometer devices, the filament stretching rheometer and the cross-slot extensional rheometer. The filament stretching rheometer uses an active feedback loop to control the imposed strain rate on a filament, allowing Hencky strains of around 7 to be reached. The cross-slot extensional rheometer uses optical bire-fringence patterns to determine the steady state extensional viscosity from planar stagna-tion point flow. The two methods probe different strain-rate regimes and in this paper we demonstrate the agreement when the operating regimes overlap and explore the steady state extensional viscosity in the full strain rate regime that these two complimentary techniques offer. For long chain branched materials the cross-slot birefringence images show a double cusp pattern around the outflow centre line (named W-cusps). Using constitutive modelling of the observed transient overshoot in extension seen in the filament stretching rheometer and using finite element simulations we show that the overshoot explains the W-cusps seen in the cross-slot extensional rheometer, further confirming the agreement between the two experimental techniques.
2
I. INTRODUCTION
A long standing issue in characterising polymer stress-strain relationships is their ex-tensional response. It still remains a challenge both experimentally and constitutively to capture and explain the extensional stress response of polymer melts over a broad range of strain rates. The extensional stress growth coefficient provides an excellent material char-acterising technique as the flow direction and gradient are parallel, and probes the chain stretching response. It is much more effective than shear flow in detecting differences in molecular structure [Bent et al. (2003)]. For branched polymer melts the stress response usually exhibits some degree of strain hardening, where the tensile stress growth coeffi-cient rises above the linear-viscoelastic reference case that is predicted using the Boltzmann superposition principle [Dealy (1990)].
Extensional flow is commonly achieved by uniaxial stretching [e.g. Cogswell (1972); Meissner (1971); Meissner and Hostettler (1994); M¨unstedt (1979); Sridhar et al. (1991)]. In a series of papers Meissner, M¨unstedt, Laun and co-workers investigated the strain-rate and stress dependence of the elongational viscosity as well as the recoverable strain in the steady-state for low-density polyethylene (LDPE) melts [for example Laun and M¨unstedt (1976, 1978); Raible et al. (1979)]. These constant strain-rate tests were performed on LDPE samples using a Meissner type elongational rheometer with rotating clamps. These tests indicated that the tensile stress runs through a broad maximum as a function of strain. This effect was found to be even more pronounced at higher strain rates. However, M¨unstedt and Laun (1981) used the same Meissner-type apparatus to suggest that the stress maximum may be an artifact, because when the case of decreasing stress at high elongation occurs the sample homogeneity becomes insufficient to return significant data.
In subsequent studies steady-state elongational viscosities were determined by creep tests in elongation [e.g. by M¨unstedt and Auhl (2005) for linear and long-chain branched polypropylenes using a M¨unstedt type tensile rheometer]. In comparison to stretching ex-periments a steady-state flow in elongation can already be reached in creep exex-periments for smaller strain rates. The steady-state values are independent of the flow type by which they are obtained and can be used to compare to the maximum values from constant strain-rate experiments. From the prescribed constant stress and the resulting steady-state elonga-tional rate, the steady-state elongaelonga-tional viscosities were compared to the maximum vis-cosities from stressing experiments. The difference in the results when comparing steady state extensional creep and constant strain rate (maximums) measurements were similar for linear and weakly branched materials but somewhat larger for the materials with the highest long-chain branching.
Non-linear elongational flow behaviour is often explored using a double roller stretching device, the Sentmanat Elongational Rheometer (SER, Xpansion Instruments [Sentmanat (2004)]) attached to a standard shear rheometer. Typically different Hencky strain rates between 0.001s−1 and 30s−1 are applied to specimens with a width from 3mm to 10mm
and a thickness of about 1mm [c.f. for example M¨unstedt and Auhl (2005)]. However, the extensional data obtained from the SER never reaches a steady state plateau as stretching experiments are prone to sample inhomogeneity and sample rupture, [c.fMcKinley and Srid-har(2002);Minoshima and White(1986a,b) andAho et al.(2010a,b)] and these experiments are limited to Hencky strains less than four.
3
et al. (2003); Rasmussen et al.(2005)] to measure the elongational viscosity of low-density polyethylenes at strains beyond the onset of localised necking of the sample. However, even with active feedback a true steady-state flow condition is impossible to establish in fila-ment stretching flows (see for instance McKinley and Sridhar (2002)) since an unlimited deformation is required and the sample cross-sections become very small. Despite this, the observation of an effective steady state stress at high strains following a stress maximum was reported for two LDPE melts (Lupolen3020D and Lupolen1840D) [Rasmussen et al. (2005)]. In subsequent work, a similar high strain “steady state” stress plateau following a stress maximum has been reported for a model branched (Pompom) polystyrene of known architecture [Nielsen et al. (2006)].
Stretching devices have also been developed to measure the response of materials to planar extensional flow [Laun and Schuch (1989); Meissner et al. (1982); Meissnera et al. (1981)]. In the linear viscoelastic limit the extensional viscosities for these two flow types differ by a factor of 4/3. However, this difference decreases in the nonlinear strain hardened regime where the stress response tends to the same steady state values [as seen for example in the LDPE measurements of Laun and Schuch (1989)] captured by the multimode Pompom model [Inkson et al. (1999)]. Consequently in this paper we shall compare uniaxial and planar extensional data.
Auhl et al. (2011) used a closed cell stagnation point flow to measure the planar steady state extensional response of various polyethylenes produced using flow induced birefringence patterns. Much work has been done to investigate complex flow geometries [e.g. Boukel-lal et al. (2011); Coventry and Mackley (2008); Crowley et al. (1976); Frank and Mackley (1976); Janeschitz-Kriegl (1983); Macosko et al. (1980); Schoonen et al. (1998); Scrivener et al.(1979);Soulages et al.(2008);Verbeeten et al.(2001);Winter et al.(1979)], often com-paring constitutive predictions to flow induced birefringence images. Compared to filament stretching flows the stagnation point geometries have the advantage that flow properties can be investigated without free surface flow [Minoshima and White(1986a)]. However, the flow history at other points in flow is more complex and so only at the stagnation point is the stress the result of simple planar elongational flow.
4
into our finite element simulations. The physical mechanism of the overshoot is yet to be fully resolved, but the Pompom model used here helps demonstrate the link between the transient extensional overshoot and the flow features seen in cross-slot flow experiments.
Various constitutive equations have been examined previously in a cross-slot geometry. For example,Bogaerds et al.(1999) showed that the Giesekus and Phan-Thien Tanner mod-els fail to predict downstream principal stresses in cross-slot geometry for polymer solutions due to a failure of capturing extensional stresses. Abedijaberi et al. (2009) investigated the flow of LDPE branched polymer melts in a lubricated cross-slot channel by experiments and flow simulations. Hassell et al. (2009) compared the birefringence patterns of a range of moderately branched (metallocene-catalysed) polyethylenes with the predictions of the Pompom model[Blackwell et al.(2000)]. As the degree of branching increases they observed a transition in the birefringence pattern from a single cusp along the outflow axis to a double cusp, which they named (W-cusps). This pattern indicates that the position of maximum stress difference is no longer at the stagnation point, but away from the outflow axis. While the Pompom model was able to reproduce the general levels of principal stress difference it did not reproduce the W cusp pattern. Our subsequent extensive exploration of the consti-tutive parameter space of the multimode Pompom model, including fully three-dimensional simulations, have also failed to produce this phenomenon.
In this paper we compare extensional stress measurements on a set of long chain branched polymers using two different extensional rheometers: the actively controlled filament stretch-ing rheometer (FSR) Bach et al. (2003) and the cross-slot extensional rheometer (CSER) Auhl et al. (2011). We show that for range of strain-rates where both instruments can be used that the extensional stress at large strains is in good agreement, suggesting that it is possible to define an effective “steady state” extensional viscosity for these materials. Fi-nally, we show that by incorporating a transient maximum in the extensional stress response into the constitutive model we are able to reproduce the W-cusps.
II. EXPERIMENTAL
A Filament stretching rheometry 5
TABLE I Material properties of polyethylenes studied.
Sample Code MW [kg/mol] MW/MN [-] T [◦C] η0 [kPa s] τ¯b [s]
LDPE1 Dow150R 242 11 160 368 428
HDPE1 HDB4 96 2.1 155 200 56
HDPE2 HDB6 68 2.2 155 50 28
A. Filament stretching rheometry
Extensional measurements using the SER rheometer are limited to cases where the sample remains homogeneous. In order to explore higher strains as the deformation becomes inho-mogeneous we require an experiment in which the material whose stress is being measured experiences a kinematically steady extensional flow. These measurements are performed with a Filament Stretching Rheometer (FSR) equipped with an oven to allow measurements up to about 200◦C [Bach et al. (2003)]. The key feature of this rheometer is that it uses
active feedback through the measurement of the mid-plane diameter to control the strain rate at the mid-plane of the filament, which provided a critical strain rate ˙ǫsag = ρgL0/η0
is exceeded, [McKinley and Sridhar (2002)] is the thinnest part of the filament. Therefore, on-line measurements of the mid-plane diameter serve the dual purpose of recording the actual strain and strain-rate at the mid-filament plane and providing input for the feedback control on the plate motion to achieve desired kinematics. Specifically the Hencky strain and the mean value of the stress difference over the mid-filament plane [Szabo (1997)] are calculated from observations of the diameter D(t) and the force on the bottom plate F(t) as
ǫ(t) =−2 ln(D(t)/D0) (II.1)
and
hσzz−σrri=
F(t)−mfg/2
πR(t)2 , (II.2)
where the angular brackets denote an average over the symmetry plane, R(t) = D(t)/2 is the radius of the filament,g the gravitational acceleration andmf the weight of the polymer filament. Consequently on the assumption that the stress is uniform across the mid-plane, the force measurement gives the normal stress difference at the mid-plane of the filament where the fluid has experienced a constant rate, eventhough the overall extension-rate of the filament is non-uniform. Each material was tested a number of times to ensure reproducibility of the results.
Since the initial sample length isL0 = 2.5mm compared with a plate radiusR0 = 4.5mm,
the initial sample aspect is small, and consequently at small strains not all of the stress difference is due to the extensional viscosity. Part of the stress difference comes from a radial pressure variation in the cross-section due to the shear flow that is unavoidable at small aspect ratios. To compensate for this effect we define the corrected transient uniaxial elongation viscosity by
¯
η+corr = hσzz−σrri ˙
ǫ0
1 + exp(−5ǫ/3−Λ
3 0)
3Λ2 0
−1
(II.3)
where Λ0 =L0/R0 is the initial aspect ratio. The correction is a modification [Rasmussen
[image:6.595.92.517.96.161.2]A Filament stretching rheometry 6
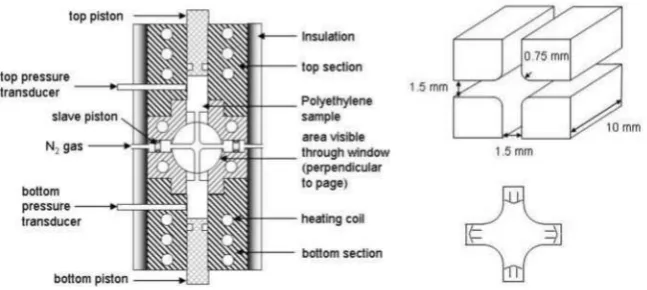
FIG. 1 (a) Schematic outlining the Cambridge Multi-Pass Rheometer (MPR) core and (b) the dimensions and flow direction for the Cross-Slot geometry insert as used in the mid-section of the MPR. The associated flow directions are indicated by arrows
et al.(1996)]. For large strains the correction vanishes and the radial variation of the stress in the symmetry plane becomes negligible [Kolte et al. (1997)].
B. Cross-slot extensional rheology
The cross-slot flow experiments to measure the steady planar extensional rheology were performed using the Cross-Slot Extensional Rheometer, (CSER), in a which a cross-slot insert is used in the Cambridge Multi-Pass Rheometer (MPR) [Mackley et al.(1995)]. This instrument allows simultaneous measurement of pressure and optical birefringence as de-tailed in Coventry and Mackley (2008) and used for a number of different polymer melt flow studies, [e.g. Hassell and Mackley (2008), Hassell and Mackley (2009), Hassell et al. (2009)]. The birefringence was measured using a circularly polarised monochromatic light beam of 514nm using polarisers and quarter waveplates either side of the optical test sec-tion which contained stress free quartz windows. The stress-induced birefringence patterns were captured by a digital video camera [Collis and Mackley (2005)]. From the top and bottom reservoirs the polymer material is driven in opposite directions along two perpendic-ular channels by pistons at a controlled rate through the cross-slot into two horizontal side channels capped by slave pistons (Figure 1a). Thereby the material is maintained within the MPR and can be forced back by nitrogen pressure through the cross-slot insert into the top and bottom reservoirs for subsequent runs. The cross-slot geometry insert used in this study consists of four perpendicular, intersecting co-planar channels with a depth of 10mm
[image:7.595.147.471.79.224.2]7
At steady state a molecule at a point along the stagnation line experiences a constant extension rate ˙εC that is approximately proportional to the piston speed, but varies with polymer rheology due to changes in the flow pattern. To determine the extension-rate for each experiment we performed flow simulations using a multimode Pompom model fitted to the measured rheology of the material. We have shown previously [Hassell et al.(2009);Hoyle (2011)] that changes in the velocity field at points around the stagnation line measured using laser doppler velocimetry are captured by the Pompom model and further, are dependent upon the level of LCB present in a material.
The steady-state elongational viscosity η+P is calculated from the tensile stress difference
σstd along the stagnation line and the extension-rate ˙εC there:
ηP+ = σstd ˙
εC
. (II.4)
Here σstd = (σxx −σyy) is the principal stress difference between the extensional x and compressional y axes. This was determined from the fringe-counting [using the method detailed in Auhl et al. (2011)] as σstd = ∆Cn, where C is the stress-optical coefficient, C. Stress-optical coefficients taken fromHassell et al.(2008) were used, which are in quantitative agreement with the range given in the literature for polyethylene of 1.2−2.4·10−9P a−1
[Macosko (1994)]. According to the theory of rubber elasticity and experiments, the stress-optical coefficient is only weakly dependent on temperature [Koyama and Ishizuka (1989)] and so the same stress optical coefficient was used for the experiments at 155 and 160◦C. In
all cases the stresses are below the 1MPa limit where the stress optical rule is expected to be valid [Kotaka et al. (1997); Koyama and Ishizuka (1989);McLeish (2002)].
III. CONSTITUTIVE MODELLING AND FINITE ELEMENT SIMULATION TECHNIQUES
The rheology for highly entangled polymers is strongly dependent on molecular topology. McLeish and Larson [McLeish and Larson (1998); McLeish (2002)] developed a constitu-tive model for branched polymers based upon the molecular theory for a melt of Pompom molecules, consisting of a backbone chain connecting two identical star polymers. Although derived with this particular molecular architecture in mind, the Pompom model captures the essential physics of branched melt rheology, and can be applied to more general archi-tectures. A multimode Pompom model was introduced by Inkson et al. (1999) and later modified by Blackwell et al. (2000) to account for polydispersity and high complexities of multilevel branching.
In the multimode Pompom model the extra stress tensor is formed as sum of products of the square of the backbone stretch, λi(t), and orientation tensor,Si(t), from each mode.
σ=M−1
N
X
i
Giλ2i(t)Si(t), (III.1)
whereGi are the linear viscoelatic moduli andM−1 is a dimensionless constant that depends upon the equation used to obtain the orientation tensor. The original Pompom model uses an integral equation for which M−1 = 15
4 . However, since this form is computationally
expensive a differential approximation based on the upper-convected Maxwell model was introduced for which M−1 = 3. The differential model is more commonly used particularly
8
The differential approximation uses an auxiliary tensor Ai, for each modei, that satisfies the Upper Convected Maxwell constitutive equation,
DA
Dt =K·A+A·K
T
− 1 τb
A−I
. (III.2)
Here (and from now on) we have suppressed the mode index,ifromAandτb. The orientation is given by the unit tensor,
S = A
trA. (III.3)
The dynamic equation describing the stretched backbone is given in Blackwell et al. (2000) and McLeish (2002) as,
D
Dtλ(t) = λ(t)K :S−
1
τs
(λ(t)−1)eν∗(λ(t)−1), (III.4)
with ν∗ = 2
q−1, forλ up to a maximum value of q, at which point the branch points retract
into the backbone tube.
A number of variants of this model have been developed including: a thermodynamically motivated differential model suggested by Ottinger¨ (2001); the eXtended Pompom (XPP) differential model Verbeeten et al. (2001) and the Double Convected Pompom (DCPP) [Clemeur et al. (2003)]. These models drop the maximum stretch condition and improve the quantitative agreement with the integral model, in particular, to give a non-zero second normal stress difference in shear.
The various versions of the Pompom model have been shown to be able to quantitatively fit the transient shear and extensional behaviour of a variety of different branched poly-mers up to the maximum in the extensional viscosity [Blackwell et al. (2000);Inkson et al. (1999);Verbeeten et al. (2001)]. However, the Pompom constitutive model cannot produce a transient overshoot in extension, such as that seen by Bach et al. (2003); Nielsen et al. (2006);Rasmussen et al.(2005). This is because once the tube segments align with the flow axis, K : S ≃ ε˙ and the stretch equation reduces to an autonomous first order ordinary differential equation, and so λ cannot overshoot its steady state value.
The molecular origin of a transient overshoot in extensional flow is not currently under-stood. By incorporating tube pressure into the integral molecular stretch function consti-tutive model Rolon-Garrido and Wagner (2009); Wagner and Rolon-Garrido (2008) were able to fit the experimental data on a melt of Pompom shaped molecules in Nielsen et al. (2006). However, the existence of a tube pressure that occurs when the tubes are deformed is a controversial idea whose molecular origin is unclear. The model predicts an overshoot followed by a steady state for all strain rates. The Pompom melt experimental data used did not reach steady state and so it could not be determined if the correct steady state was predicted by the model. In order to explore the consequences of extensional overshoots in the cross-slot flow, we choose at this point to proceed phenomenologically, suspending judgement on the underlying molecular reasons for such behaviour.
To produce an overshoot the Pompom model requires an additional stretch relaxation process that is dependent upon S. This is included as an additional relaxation rate τ−1
∗ in
the stretch equation III.4 to give,
Dλ
Dt =λS :K− 1 τs + 1 τ∗
(λ−1)eν∗(λ−1)
9
If this additional relaxation mechanism arises from advection by the flow, then it should be proportional to the extension-rate along the tube segments, hence the relaxation time should be of the form,
1
τ∗ =f(S)|S :K|, (III.6)
where f is a function of the degree of alignment. Since this relaxation process becomes significant only once the tube segments become highly aligned, we choose a form for f so that it switches from 0 to a positive valueCR as the orientation tends to perfect alignment, by setting
f(S) = CR S :ST
α
. (III.7)
where the parameter α is used to define how aligned the material should be to trigger this additional relaxation. In a strong planar extensional flow, (i.e. one for which the
orientation Weissenberg number W ib = ˙ετb ≫ 1) the scalar S : ST ≃ 1− 2 exp(−2ε) where ε is the Hencky strain, ˙εt so that this function switches on the additional relaxation after a Hencky strain of approximately 12loge(2α). So that, for this relaxation to trigger after a Hencky strain of 2.6, requires a value of α of around 100. In uniaxial extension,
S :ST ≃1− 4
W ibexp(−2ε).
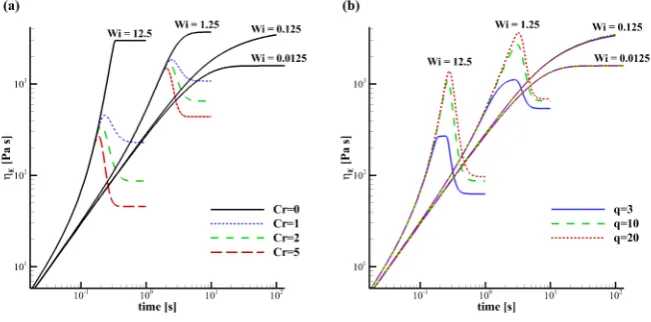
The effect of varying the value of α is illustrated in figure 2. The left-hand figure shows the extensional viscosity for a one mode Pompom model with G= 100Pa, τb = 5s, q = 10,
τs= 1.25s for strain rates of 0.01, 0.1, 1 and 10s−1 (giving orientation Weissenberg numbers of W ib = ˙ετb = 0.05,0.5,5 and 50 and stretch Weissenberg numbers of W is = ˙ετs = 0.0125,0.125,1.25 and 12.5, respectively). The different lines show various choices of the power α with a fixed value of CR = 2. The figure shows that the steady state value of the overshoot Pompom (OPP) model does not depend on α, but that the value of α controls the strain at which the additional relaxation is triggered.
Figure 2 (a) shows the value of (S : ST)α for the same one mode Pompom model in uniaxial extension, seen in figure2 (left). Only the highest strain rates (1 and 10 reciprocal seconds, or W is= 1.25 and 12.5) align enough material forτ∗ to become non-trivial, which
coincide with the stretch Weissenberg number being greater than unity. For these two strain rates the various choices ofαare shown and as before, the higher the value ofαthe larger the strain required to orientate the material sufficiently for this extra relaxation to contribute. For α= 10,100,1000 the Hencky strain at which steady state is observed is approximately 3,4,5, respectively.
Figure3(a) shows the effect of varyingCR for a fixed value ofα= 100. As the parameter
CR is increased so does the contribution of τ∗ and the steady state value of extensional
viscosity decreases. VaryingCR [c.f. figure3(a)] makes little difference in the Hencky strain at which steady state is achieved (approximately a Hencky strain of 4.5).
The inclusion of this additional stretch relaxation means that the backbone tubes are no longer fully extended at steady state. Indeed in figure2(a), the maximum stretch condition (q = 10) was only reached for CR = 0. For lower values of q it is still possible to achieve maximum stretch during the transient. This is illustrated in for the case q = 3 in figure 3
(b) where we consider the one mode Pompom model with G = 100Pa, τb = 10s, τs = 2.5s for choices of q = 3, 10, 20 where the overshoot parameters are α = 1000 and CR = 2. Thus with the exception of cases where q is small the restriction of Equation III.5 toλ < q
10
FIG. 2 a) The transient extensional viscosity for a single mode overshoot Pompom model, {G= 100Pa,τb = 5s, q= 10,τs= 1.25 s}, in uniaxial extension. The four set of curves shows the effect
of variations in the power law α from 10 to 1000 with CR = 2 for various stretch Weissenberg
numbers (W is = ˙ετs). As α is increased so does the amount of alignment needed for the extra
relaxation time, τ∗, to become dominant. This has the effect of delaying relaxation until a higher Hencky strain has been reached causing a bigger difference between the maximum and steady state extensional viscosity. b) A plot of the measured alignment, (S :ST)α, for the same stretch
Weissenberg numbers. As α is increased so does the strain taken for the measured alignment to approach unity and thus delays the transient overshoot.
FIG. 3 a) The transient extensional viscosity for a single mode overshoot Pompom model, {G= 100Pa,τb = 5s, q= 10,τs= 1.25 s}, in uniaxial extension. The four set of curves shows the effect
of variations in parameter CR from 1 to 5 with α = 100 for various stretch Weissenberg numbers
(W is = ˙ετs). The parameter CR does not affect the strain needed to achieve an overshoot but
it does affect the magnitude of τ∗ and thus determines the steady state extensional viscosity. b) The effect of the branch number q on transient extensional viscosity for a single mode overshoot Pompom model, {G= 100Pa,τb = 5s,τs= 1.25 s, CR= 2,α = 100}, in uniaxial extension. The
[image:11.595.142.473.78.239.2] [image:11.595.142.468.402.563.2]11
the XPP and DCPP models. However, the steady state value still depends upon the value of q since ν∗ = 2
q−1.
In transient shear flow the extra stretch relaxation is negligible (as the orientation tensor
S does not become sufficiently aligned) and the stress response is left unchanged.
A. Finite element solutions
Two dimensional calculations of the flow of the Pompom model in the cross-slot geometry were performed using a finite element method to compute strain-rate and principal stress difference (PSD). Details of the numerical scheme are given in the references [Tenchev et al. (2008), Lord et al. (2010)]. Due to symmetry, only one quarter of the cross-slot domain was calculated. Upstream we impose fully developed channel flow equivalent to the chosen experimental volume flux. Spatial convergence was checked by comparing solutions obtained on two different meshes of 970 and 2600 nodes. Simulations took up to 48 hours on a 1.7GHz
processor depending on mesh refinement and time step interval.
Since equation (III.2) allows unlimited stretch of the auxillary tensor A, a FENE modi-fication was made to the relaxation term to limit the trace ofA to 1000. A penalty scheme was used to limit the stretch variable to the range 0≤λ(t)≤q, though as noted above this now occurs rarely due to the additional relaxation term.
B. The overshoot Pompom model in cross-slot flow
In cross-slot flow the difference between the maximum extensional stress and the steady state value determines the size of the W-cusp and transient development of the extensional stress overshoot will determine the shape of the W-cusps. This is illustrated in figure 4
where in figure 4(a) the effect of varying the power law parameter on the shape of a PSD contour (of value 3kPa) for a fixed CR= 2 is shown. At the lowest power law, α= 10, (see figure 2) the stretch relaxes at a lower strain and so the double cusps are shorter and wider than for the higher power laws.
Figure 4(b) shows how varying CR affects the position of the 0.3kPa contour. The W-cusps are now all the same width (which as we have seen is associated with the value ofα), however the length of the cusp is shorter for higher values ofCRwhere the stretch relaxation is faster at high strains.
Figure5 compares the magnitude of the principle stress difference (PSD) and the degree of orientationS :ST along the stagnation point streamline as functions of the distance from the stagnation point. Figure 5(a) shows the effect of changes to α, which occur mainly upstream from the stagnation point. Here the stress initially grows towards the stagnation point and overshoots as a function of strain history, with the various power laws showing the same behaviour as in figure2. The small differences at and downstream of the SP arise from flow modification, sinceαdoes not affect the steady state stress. Similarly the changes in the transient development of S :ST arise from changes in the flow pattern near the stagnation point.
12
FIG. 4 Figure a) shows computed contours of constant principal stress difference for the one mode Pompom model used in figure2, examining how the power lawα affects W-cusps in cross-slot flow. The dashed line shows α = 10, the solid line α = 100 and the dotted line α = 1000. Figure b) shows the effect of varyingCRon the W-cusps in the cross-slot flow using the single mode Pompom
models used in figure3. The dotted line showsCR= 5, the solid line showsCR= 2 and the dashed
line shows CR= 1.
FIG. 5 PSD andS :ST along the stagnation point (SP) streamline as a function of distance from the SP showing variations in (a) α and (b)CR. Negative distance from the SP corresponds to the
inlet channel and positive distance the outlet channel.
maximum and steady state is associated with the largest value of CR since this provides the strongest stretch relaxation.
IV. RESULTS
[image:13.595.142.473.359.515.2]13
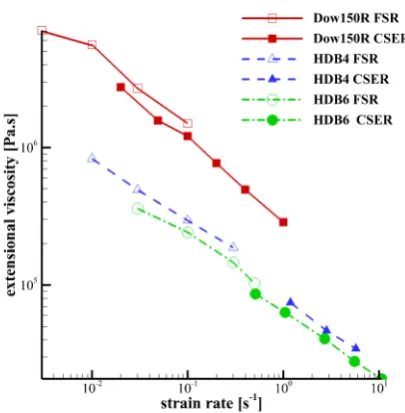
FIG. 6 A comparison of the steady state extensional viscosity measurements from the FSR and the CSER for three polyethylene samples detailed in table I. The open symbols show the FSR results and the closed symbols show the CSER data.
I]. The (FSR) values are obtained from the average stress measurement at large strains and the (CSER) from the steady state birefringence patterns. For two of the materials there is sufficient data to examine the overlap of the two experimental methods (Dow150R and HDB6) where there is good agreement between the two. This is despite the differences in the nature of the flows, with the FSR being uniaxial and the CSER planar extensional flow. Even for HDB4, where there is a gap in the data, the steady state stress values still show the a close agreement to the same trend.
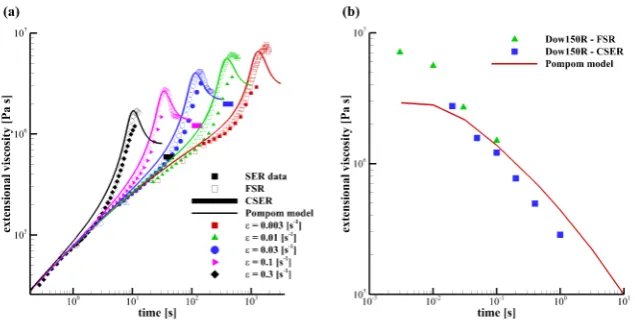
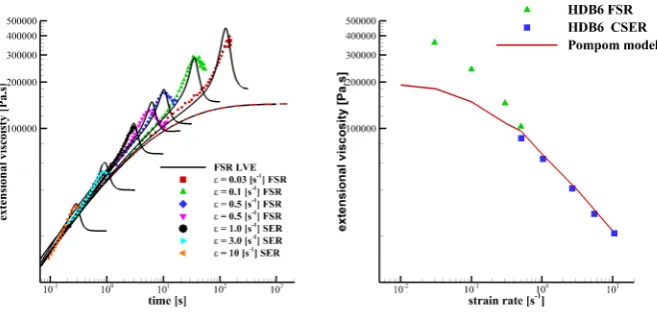
For strain rates where data is available we also compare the transient stress growth in figures 7 and 8. Figure 7 shows the two LCB-HDPEs named HDB4 and HDB6 with data measured from the SER and CSER and figure 8 shows the LDPE Dow150R. Details of the materials are given in table I. The comparison of transient data shows good agreement between the two filament stretching methods up to the point at which the SER samples rupture and break, at Hencky strains of around 4 (the FSR is capable of Hencky strains up to 7). As a general observation for these three materials, the transient build up of stress measured by the FSR is faster than that of the SER. Also, as anticipated the SER never goes far enough in Hencky strain to observe an extensional stress maximum or steady state value. In contrast the FSR data shows a clear overshoot in stress. The presence of a steady state in figures 7 and 8 is obscured by the logarithmic axes that compress the large time results.
In figure 8 we also show the fit of the OPP model to both the transient startup flow (a) and for the steady state extensional viscosity (b). The OPP model was parameterised with 12 modes. The linear Maxwell parameters (τbi and Gi) were fitted to linear oscillatory rheology using RepTate [Ramirez and Likhtman(2007)]. The non-linear parameters (τsiand
14
FIG. 7 A comparison between the transient extensional stress response as measured by the FSR (closed) and the SER (open) for HDB6 (left) and HDB4 (right). The figure shows an good agree-ment of the initial stress growth, until sample rupture limits the SER to Hencky strains of around 4.
FIG. 8 a) A plot comparing extensional data and OPP theory for Dow150R. Strain rates range from 0.003s−1 to 0.3s−1. The closed symbols show the SER data and the open symbols data from the FSR achieving higher Hencky strains than the SER. The lines show the theoretical prediction from the OPP model. b) The steady state extensional viscosity values from the FSR and the CSER are compared to the prediction of the Pompom model fitted to the data.
the number of variables. This provides some unwanted overshoots at low strain rates, but we tolerate this as we are focusing on modelling the CSER birefringence images and so we aim to optimise the fit to this range of extensional strain rates.
[image:15.595.142.460.324.486.2]15
FIG. 9 The transient (a) and steady state (b) data for HDB6 is plotted along side the OPP model fitted to the data (lines). For the transient fit the slower strain rates were measured by the FSR and the higher rates by SER. The steady state data came from the FSR and the CSER.
The reason the OPP model overshoots for these slow strain rates is because the overshoot parameters are kept constant for all modes, but as previously stated we are most interested in the strain-rates measured in the CSER.
In figure 9we show the fit of the OPP model to the HDPE material HDB6. HDB4 is not plotted but is similar. For this material the FSR is not able to function at the strain-rates used in the CSER, and so for these strain-rates we used the transient data from the SER in fitting the model. As with the LDPE, Dow150R, the transient build up of the extensional viscosity is well captured by the model. As with the Dow 150R material the high strain-rate regime is fitted well by the data, but simultaneously fitting the low strain-rate regime is not possible with a single overshoot parameter CR.
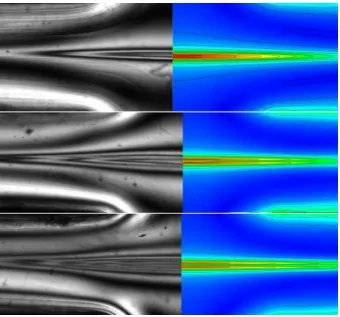
In figure10finite element simulations of Dow150R with the spectrum used in figure8are compared to the experimental birefringence stress patterns for flow rates giving stagnation point extension rates of ˙εC = 0.035s−1, ˙εC = 0.070s−1 and ˙εC = 0.174s−1, correspond to Weissenberg flow numbers of Wi = ˙εCτ¯b = 15,30 and 75, respectively (where ¯τb is the viscosity averaged relaxation time). The simulations show an excellent agreement with the birefringence patterns, predicting not only the number of fringes around the stagnation point but also the shape of the fringe pattern including the correct position of the W-cusps at each flow rate.
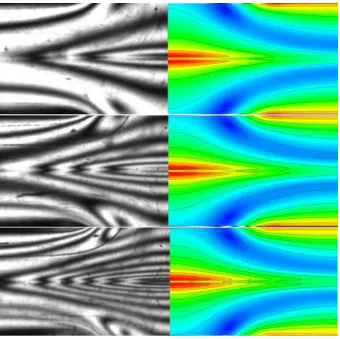
We achieve a similar level of agreement for HDB6. The experimental flow rates correspond to strain rates of ˙εC = 0.70s−1, ˙εC = 1.74s−1 and ˙εC = 3.48s−1 giving Weissenberg numbers of 19.6, 48.7 and 97.4, from top to bottom in figure 11. Again, the number of fringes and the shape of the fringe pattern are estimated well. It is also noticeable that the shape of the W-cusps are different between the Dow150R and HDB6. We note that this is not a consequence of orientation Weissenberg number as these are similar. The shape of the cusps for the LDPE Dow150R are highly extended compared to the that of HDPE HDB6, as a consequence of the increased level of branching in the LDPE. Also, the W-cusps for Dow150R are also more highly stretched (i.e. the distance from the tip of the double cusps to the centre line dip) compared to HDB6, which is also due to the level of LCB [Auhl et al. (2011)].
16
FIG. 10 A comparison of between FIB in cross-slot flow and 2D simulations of the OPP parame-terisation for LDPE Dow150R. The values of overshoot parameters areCr = 0.8 andα= 1000, and
the transient extensional rheology is shown in figure8. The black lines in the simulations represent the black contours of the experimental PSD for initial strain rates of ˙εC = 0.035s−1, ˙εC = 0.070s−1
and ˙εC = 0.174s−1 from top to bottom.
pattern and the fringe number to within half a fringe for all three Weissenberg numbers. However, the phenomenology of the OPP model does not account for every detail of the flow. For example, the size of the W-cusps is over predicted near the SP. As with the original Pompom model the OPP model fails to capture the overall pattern collapse [c.fHassell and Mackley(2009)] observed for all W-cusping materials. The overall pattern collapse is seen as a decrease in the total number of fringes observed over time. That is, the number of fringes at steady state is usually less than the highest number of fringes observed by a half or one whole fringe. Also the transient development of the pattern is much faster in simulations than in experiments. In experiments the W-cusps initially occur at a strain of around 5, whereas in transient simulations, not shown, W-cusps first occur at a strain of 2.
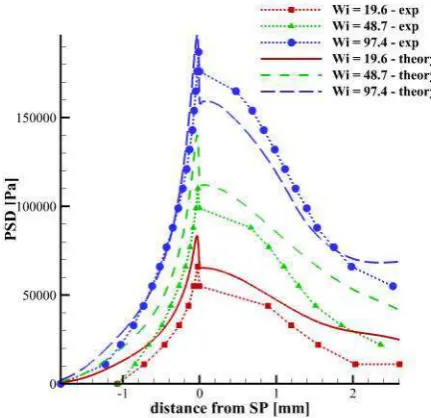
The clarity of the steady state experimental FIB images means that we can determine the PSD as a function of position along the stream line through the stagnation point, which is shown in figure12. These results confirm the visual agreement of the PSD contours. How-ever, the simulations over-predict the stress difference slightly for the two lower Weissenberg numbers and also overpredict the magnitude of PSD overshoot.
17
FIG. 11 A comparison of between FIB in cross-slot flow and 2D simulations of the OPP parame-terisation for HDPE HDB6. The values of overshoot parameters are Cr = 2.0 and α= 1000, and
the transient extensional rheology is shown in figure9. The black lines in the simulations represent the black contours of the experimental PSD for initial strain rates of ˙εC = 0.70s−1, ˙εC = 1.74s−1
and ˙εC = 3.48s−1 from top to bottom.
V. CONCLUSIONS
18
FIG. 12 A comparison between the OPP simulations and the experimentally measured position of the FIB contours of constant PSD for HDB6 at three flow rates.
in the transient stress, which produce W-cusps in the CSER.
We have modified the Pompom model to capture this non-monotonic stress growth in order to fit the full extensional rheology in both transient and steady state response. Al-though this modification is not based on molecular physics, it allows us to make a crucial link between the two flow investigated here. By fitting this model to extensional data we are able to reproduce the birefringence patterns observed in the cross-slot device. From this we conclude that the spatial W-fringes are the consequence of the temporal stress overshoot in extension of LCB melts. (It should be noted that our extensive investigations with the original Pompom model failed to reproduce the W-fringe pattern.) The current overshoot model, however, fails to capture the relaxation dynamics observed downstream of the stag-nation point. A clear future goal would be to derive a constitutive model that is based on molecular detail and captures the full range of characteristics observed in extensional experiments.
Acknowledgement
We thank the EPSRC Microscale Polymer Processing Research Project (GR/T11807/01 and GR/T11821/01) and the European Union Marie Curie Initial Training Network DY-NACOP (214627) for their financial support.
References
19
J. Aho, V. H. Rolon-Garrido, S. Syrjala, and M. H. Wagner. Measurement technique and data analysis of extensional viscosity for polymer melts by Sentmanat extensional rheometer (SER).
Rheologica Acta, 49(4):359–370, APR 2010a.
J. Aho, V. H. Rolon-Garrido, S. Syrjala, and M. H. Wagner. Extensional viscosity in uniaxial extension and contraction flow - Comparison of experimental methods and application of the molecular stress function model. Journal of Non-Newtonian Fluid Mechanics, 165(5-6):212–218, MAR 2010b.
D. Auhl, D. M. Hoyle, D. Hassell, T. D. Lord, O. G. Harlen, M. R. Mackley, and T. C. B. McLeish. Cross-slot extensional rheometry and the steady-state extensional response of long chain branched polymer melts. Journal of Rheology, 55(4):875–900, 2011.
A. Bach, H. K. Rasmussen, and O. Hassager. Extensional viscosity for polymer melts measured in the filament stretching rheometer. Journal of Rheology, 47(2):429–441, 2003.
J. Bent, L. R. Hutchings, R. W. Richards, T. Gough, R. Spares, P. D. Coates, I. Grillo, O. G. Harlen, D. J. Read, R. S. Graham, A. E. Likhtman, D. J. Groves T. M. Nicholson TM, and T. C. B. McLeish. Neutron-mapping polymer flow: Scattering, flow visualisation and molecular theory. Science, 301:1691–1695, 2003.
R. J. Blackwell, O. G. Harlen, and T. C. B. McLeish. Molecular drag-strain coupling in branched polymer melts. Journal of Rheology, 44(1):121–136, 2000.
A. C. B. Bogaerds, W. M. H. Verbeeten, G. W. M. Peters, and F. P. T. Baaijens. 3D viscoelastic analysis of a polymer solution in a complex flow. Computer methods in applied mechanics and engineering, 180:413–430, 1999.
G. Boukellal, A. Durin, R. Valette, and J. Agassant. Evaluation of a tube based constitutive equation using conventional and planar elongation flow optical rheometers. Rheological Acta, 50: 547–557, 2011.
N. Clemeur, R. P. G. Rutgers, and B. Debbaut. On the evaluation of some differential formulations for the Pompom constitutive model. Rheologica Acta, 42:217–231, 2003.
N. Clemeur, R. P. G. Rutgers, and B. Debbaut. Numerical evaluation of three dimensional effects in planar flow birefringence. Journal of Non-Newtonian Fluid Mechanics, 123:105–120, 2004. F. N. Cogswell. Converging flow of polymer melts in extrusion dies. Polymer Engineering and
Science, 12(1):64–73, 1972.
M. W. Collis and M. R. Mackley. The melt processing of monodisperse and polydisperse polystyrene melts within a slit entry and exit flow.Journal of Non-Newtonian Fluid Mechanics, 128(1):29–41, 2005.
K. D. Coventry and M. R. Mackley. Cross-slot extensional flow birefringence observations of polymer melts using a multi-pass rheometer. Journal of Rheology, 52(2):401–415, 2008.
D. G. Crowley, F. C. Frank, M. R. Mackley, and R. G. Stephenson. Localised flow birefringence of polyethylene oxide solutions in a four roll mill. Journal of Polymer Science, part B - Polymer physics, 14(6):1111–1119, 1976.
C. Das, N. J. Inkson, D. J. Read, and K. Kelmanson. Computational linear rheology of general branch-on-branch polymers. Journal of Rhology, 50(2):207–234, 2006.
J. M. Dealy. Do polymeric liquids exhibit strain hardening? Journal of Rheology, 34(7):1133–1147, 1990.
F. C. Frank and M. R. Mackley. Localized flow birefringence of polyethylene oxide solutions in a two roll mill. Journal of Polymer Science A2, 14:1121–1131, 1976.
D. G. Hassell and M. R. Mackley. Localised flow induced crystallisation of a polyethylene melt.
20
D. G. Hassell and M. R. Mackley. An experimental evaluation of the behaviour of mono and polydisperse polystyrenes in cross-slot flow. Rheologica Acta, 48:543–550, 2009.
D. G. Hassell, D. Hoyle, D. Auhl, O. Harlen, M. R. Mackley, and T. C. B. McLeish. Effect of branching in cross-slot flow: the formation of W cusps. Rheologica Acta, 48:551–561, 2009. D.G. Hassell, D. Auhl, T. C. B. McLeish, O. G. Harlen, and M .R. Mackley. The effect of
viscoelas-ticity on stress fields within polyethylene melt flow for a cross-slot and contraction-expansion slit geometry. Rheologica Acta, 47:821–834, 2008.
D. M. Hoyle. Constitutive modelling of branched polymer melts in non-linear response. PhD thesis, University of Leeds, 2011.
N. J. Inkson, T. C. B. McLeish, O. G. Harlen, and D. J. Groves. Predicting low density polyethylene melt rheology in elongational and shear flows with Pompom constitutive equations. Journal of Rheology, 43(4):873–896, 1999.
H. Janeschitz-Kriegl. Polymer Melt Rheology and Flow Birefringence. Springer, Berlin, 1983. M. I. Kolte, H. K. Rasmussen, and O. Hassager. Transient filament stretching rheometer. 2.
numerical simulation. Rheologica Acta, 36:285 –302, 1997.
T. Kotaka, A. Kojima, and M. Okamoto. Elongational flow opto-rheometry for polymer melts. 1. construction of an elongational flow opto-rheometer and some preliminary results. Rheologica Acta, 36:646–656, 1997.
K. Koyama and O. Ishizuka. Birefringence of polyethylene melt in transient elongational flow at constant strain rate. Journal of Polymer Science: Part B: Polymer Physics, 27:297–306, 1989. H. M. Laun and H. Schuch. Transient elongational viscosities and drawability of polymer melts.
Journal of Rheology, 33(1):119–175, 1989.
H. M. Laun and H. M¨unstedt. Comparison of the elongational behaviour of a polyethylene melt at constant stress and constant strain rate. Rheologica Acta, 15(10):517–524, 1976.
H. M. Laun and M. M¨unstedt. Elongational behaviour of a low density polyethylene melt. Rheo-logica Acta, 17:415–425, 1978.
T. D. Lord, L . Scelsi, D. G. Hassell, M. R. Mackley, J. Embery, D. Auhl, O . G. Harlen, R . Tenchev, P . K. Jimack, and M. A. Walkley. The matching of 3d rolie-poly viscoelastic numerical simulations with experimental polymer melt flow within a slit and a cross-slot geometry. Journal of Rheology, 54:355–373, 2010.
M. R. Mackley, R. T. J. Marshall, and J. B. A. F. Smeulders. The multipass rheometer. Journal of Rheology, 39(6):1293–1309, 1995.
C. W. Macosko. Rheology, principles, measurements and applications. Wiley-VCH, New York, 1994.
C. W. Macosko, M. A. Ocansey, and H. H. Winter. Studies with lubricated planar stagnation dies.
Journal of Rheology, 24(6):958–958, 1980.
G. H. McKinley and T. Sridhar. Filament-stretching rheometry of complex fluids. Annual Review of Fluid Mechanics, 34:375–415, 2002.
T. C. B. McLeish. Tube theory of entangled polymers. Advances in Physics, 51:1379–1527, 2002. T. C. B. McLeish and R. G. Larson. Molecular constitutive equations for a class of branched
polymers: The Pompom polymer. Journal of Rheology, 42(1):81–110, 1998.
J. Meissner. Dehnungsverhalten von Poly¨athylen-Schmelzen. Rheologica Acta, 10:230–242, 1971. J. Meissner. Experimental aspects in polymer melt elongational rheometry. Chemical Engineering
Communications, 33:159–180, 1985.
21
J. Meissner, S. E. Stephenson, A. Demarmels, and P. Portmann. Multiaxial elongational flows of polymer melts — classification and experimental realization. Journal of Non-Newtonian Fluid Mechanics, 11:221–237, 1982.
J. Meissnera, T. Raible, and S. E. Stephenson. Rotary clamp in uniaxial and biaxial extensional rheometry of polymer melts. Journal of Rheology, 25:1–28, 1981.
W. Minoshima and J. L. White. Instability phenomena in tubular film and melt spinning of rheologically characterised high density, low density and linear low density polyethylenes.Journal of Non-Newtonian Fluid Mechanics, 19:275–302, 1986a.
W. Minoshima and J. L. White. A comparative experimental study of the isothermal shear and elon-gational rheological properties of low density, high density and linear low density polyethylenes.
Journal of Non-Newtonian Fluid Mechanics, 29:251–274, 1986b.
H. M¨unstedt. New universal extensional rheometer for polymer melts. Measurements on polystyrene. Journal of Rheology, 23(4):421–436, 1979.
H. M¨unstedt and D. Auhl. Rheological measuring techniques and their relevance for the molecular characterization of polymers. Journal of Non-Newtonian Fluid Mechanics, 128:62–69, 2005. H. M¨unstedt and H. M. Laun. Elongational properties and molecular structure of polyethylene
melts. Rheologica Acta, 20:211–221, 1981.
J. K. Nielsen, H. K. Rasmussen, M. Denberg, K. Almdal, and O. Hassager. Nonlinear branch-point dynamics of multiarm polystyrene. Macromolecules, 39(25):8844–8853, DEC 12 2006.
T. Raible, A. Demarmels, and J. Meissner. Stress and recovery maxima in ldpe melt elongation.
Polymer Bulletin 1, 6(1):397–402, 1979.
J. Ramirez and A. E. Likhtman. Reptate: Rheology of entangled polymers, toolkit for analysis of theory and experiment. http://www.reptate.com, 2007.
H. K. Rasmussen, J. K. Nielson, A. Bach, and O. Hassager. Viscosity overshoot in the start-up of uniaxial elongation of low density polyethylene melts. Journal of Rheology, 49(2):369–381, 2005. H. K. Rasmussen, A. G. Bejenariu, O. Hassager, and D. Auhl. Experimental evaluation of the pure configurational stress assumption in the flow dynamics of entangled polymer melts. Journal of Rheology, 54:1325–1336, 2010.
V. H. Rolon-Garrido and M. H. Wagner. The damping function in rheology. Rheoloigca Acta, 48 (3):245–284, APR 2009.
J. F. M. Schoonen, F. H. M Swartjes, G. W. M. Peters, F. P. T. Baaijens, and H. E. H Meijer. A 3D numerical/experimental study on a stagnation flow of a polyisobutylene solution. Journal of Non-Newtonian Fluid Mechanics, 79 (2-3):529–561, 1998.
O. Scrivener, C. Bernera, R. Cressely, R. Hocquart, R. Sellin, and N. S Vlachos. Dynamical behaviour of drag-reducing polymer solutions. Journal of Non-Newtonian Fluid Mechanics, 5: 475–495, 1979.
M. L. Sentmanat. Miniature universal testing platform: from extensional melt rheology to solid-state deformation behavior. Rheologica Acta, 43(6):657–669, 2004.
J. Soulages, T. Schweizer, D.C. Venerus abd J. Hostettler, F. Mettler, M. Kr¨oger, and H.C. O¨ttinger. Lubricated optical rheometer for the study of two-dimensional complex flows of poly-mer melts. Journal of Non-Newtonian Fluid Mechanics, 150:43–55, 2008.
S. H. Spiegelberg, D. C. Ables, and G. H. McKinley. The role of end-effects on measurements of extensional viscosity in filament stretching rheometers. Journal of Non-Newtonian Fluid Mechanics, 64:229 –267, 1996.
22
P. Szabo. Transient filament stretching rheometer. 1. force balance analysis. Rheologica Acta, 36: 277–284, 1997.
R. Tenchev, O. G. Harlen, P. K. Jimack, and M. K. Walkley. Finite Element Modelling of Two-and Three-Dimensional Viscoelastic Polymer Flows. Saxe-Coburg Publications, UK, 2008. H. C. ¨Ottinger. Thermodynamic admissibility of the Pompom model for branched polymers.
Rheologica Acta, 40:317–321, 2001.
W. M. H. Verbeeten, G. W. M. Peters, and F. P. T. Baaijens;. Differential constitutive equations for polymer melts: the extended Pompom model. Journal of Rheology, 45(4):823–843, 2001. M. H. Wagner and V. H. Rolon-Garrido. Verification of branch point withdrawal in elongational
flow of Pompom polystyrene melt. Journal of Rheology, 52(5):1049–1068, SEP-OCT 2008. H. H. Winter, C. W. Macosko, and K. E. Bennett. Orthogonal stagnation flow, a framework for