Article
Improving Reliability of Synchrophasor Data
Gathering Method Using Network Coding Technique
Ngoc Thien Le
aand Watit Benjapolakul
b,*Department of Electrical Engineering, Faculty of Engineering, Chulalongkorn University, Bangkok 10330, Thailand
E-mail: a[email protected], bwatit.b @chula.ac.th (Corresponding author)
Abstract. We consider synchrophasor data gathering method over the network of Phasor
Measurement Units (PMUs) for Wide Area Measurement System (WAMS) applications. Although this network plays an important role to monitor, protect and control distribution electric grid, the research efforts in efficient data collection method are lacking in the literature. In this paper, we represent a novel data gathering approach using Network Coding technique and develop a mathematic model to predict the PMUs network reliability using our proposed model. It allows the PMU nodes in network to perform linear combination of many packets in order to improve the packet delivering ratio at the collector. We demonstrate our proposed method using a distribution grid test case and evaluate the performance by using Monter Carlo simulation. The numerical results have verified the effectiveness of our proposed method.
Keywords: Network Coding, smart grid, phasor measurement unit, synchrophasor data
gathering, packet delivery ratio.
ENGINEERING JOURNAL Volume 21 Issue 1
1.
Introduction
Network of Phasor Measurement Units (PMUs) is a mainstream system of Smart Grid in electric distribution grid. It is necessary to upgrade the Supervisory control and data acquisition (SCADA) system by providing high-speed synchrophasor measurement for many applications such as State Estimation or Frequency Stability [1-4]. It also stabilizes the grid operation when utility integrates wind or solar power sources in order to reduce the dependence of electric power to fossil fuels. Hence, the success implementation of PMUs network will guarantee the future of Smart Grid system.
Based on the feature of synchrophasor information, the reliability of PMUs network is the most important factor. Every PMU measures the electric wave at its location and sends the information of voltage, current, and phasor to Phasor Data Concentrator (PDC) with the common time source for synchronization. Further, this information has to arrive at the PDC in the particular certain of time, other while it becomes useless. Based on the information of phasor measurements, PDC provides high-resolution picture of electric grid in real-time. Therefore, the requirement for reliability of data gathering in PMUs network is nearly 100 percent.
Unfortunately, none of existing communications for PMUs can achieve 100 percent in data delivery. Even with fiber network, the packet loss in communication links is unavoidable. Data loss usually occurs in high traffic condition, collisions between simultaneous transmissions, or equipment malfunctions. Data loss also appears on the transmission link due to the noise, or interference channels. The trend of wireless approach for PMUs in distribution grid makes the study in reliability of synchrophasor data delivery is extremely important. However, most of existing researches of PMUs network focus on the placement of PMU on the electric grid, termed as Optimization of PMUs Placement Problem (OPP) [5-7]. Meanwhile, the studies about synchrophasor data quality and how to collect synchrophasor data reliability are lacking [4, 8].
Recently, Network Coding is an innovative technique to boost the reliability and the throughput of communication channels significantly. Firstly, Ahlswede et al. [9] proposed communication nodes mix packets using mathematical operations. This can increase the amount of information in every data packets. Another advantage of Network Coding is it does not require changing the existing communication infrastructures. Hence, the investment cost of using Network Coding is very affordable.
In this paper, we address the issue of synchrophasor data loss by using Network Coding technique. Our proposed method helps to reduce data loss in PMUs network by transmitting many independent linear combinations of synchrophasor messages. In addition, we also present the mathematic model to predict the gain of synchrophasor packet delivery ratio at PDC corresponded to the level of coding we applied and the communication loss probability.
The rest of this paper is organized as follows. In Section 2, we represent the data loss problem in PMUs data gathering, and also the IEEE C37.118 phasor measurement standard and our arguments. The preliminaries about Network Coding and integrating Network Coding function into PMUs are represented in Section 3. Our proposed data gathering using Network Coding scheme is shown in Section 4. In Section 5, the numerical simulations and evaluations of our proposed method are represented. Conclusion is drawn in Section 6.
2.
Related work
2.1. Reliability Requirement of PMUs Network
In order to evaluate the reliability in data gathering, we consider two types of unavoidable data loss sources in SGC. The first is long-time data loss or random data loss. It is usually caused by signal attenuation (especially in wireless channel) or environment noise. The second is short-time data loss or burst loss. It is caused by inter-cell interference, high load conditions, or collisions between simultaneous transmissions. In our previous study [11], we have proven the benefit of Network Coding technique to reduce the total data collecting time in Smart Grid context. In this research, we investigate the efficient of our proposed Network Coding approach in improving reliability of SGC based on the above mention two types of losses.
2.2. IEEE standard C37.118.1-2014
The Standard IEEE C37.118.1-2014 [12] defines the latency pertaining directly to the PMU. According to this standard, every PMU reports phasor information to PDC at sub-multiples of the nominal electric frequency. Table 1 illustrates the required rates for 50 Hz and 60 Hz electric systems. The specific reporting rate to be used is dependent on the purpose of Smart Grid application (P-Type or M-Type). We recall that rates lower than 10 messages per second are not subject to dynamic requirements. This means that no filtering is required inside PMU, therefore lower than 10 messages per second can be supported directly by selecting every nth sample from a higher rate phasor stream.
The particular reporting rate is dependent on WAMS applications and the class of these applications. In summary, we list main differences in timeliness factors of P-Type and M-Type classes as below
P-Type applications
o Needs less filtering in PMU;
o Less latency (than M-Type) in estimation (from 30 ms to 100 ms); o Applies for real-time controlling and protection requiring minimum delay. M-Type applications
o Needs anti-alias filtering in PMU;
o Longer latency (depends on reporting rate, such as 30 ms requires delay at 60 samples per second, or 100 ms requires delay at 30 samples per second);
o Applies for monitoring applications that require precise measurement.
Table 1. Required PMU reporting rates and data reliability based on IEEE C37.118 standard [12] and OpenSG [10]. Remember that low sample rate leads to long window time, and fast sample rate leads to short one.
System frequency 50 Hz 60 Hz requirement Reliability
Recommended reporting rates from PMU
(Fs – sample per second)
10; 20; 30;
50 10; 12; 15; 20; 30; 60 ≥ 99.5%
3.
Preliminaries
3.1. Network Coding
[image:3.595.82.515.501.565.2]3.1.1. Inter-section network coding
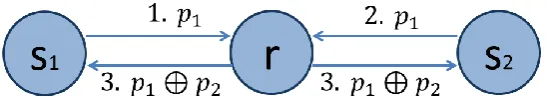
Broadcast nature of wireless network is seen as an issue, since it creates the interference between the transmission links and creates multiple copies of the same packet. However, if we allow the intermediate node performs coding packets, broadcast nature will bring advantages. For example, in Fig. 1, node 𝑠1 and 𝑠2 want to exchange packets 𝑝1 and 𝑝2. We assume that these nodes are out of each transmission range. Hence, the transmission process costs four time slots; two slots to send the packets to relay node, and two slots to forward packets from relay node to destination node. However, if the relay performs a simple XOR coding of two packets (𝑝1⨁ 𝑝2), as shown in Fig. 2, 𝑠1 and 𝑠2 can get their needed packet by XOR−ing (𝑝1⨁ 𝑝2) with their own packets, 𝑝1 and 𝑝2, respectively. Thus, the number of time slots has been reduced to three. Inter-section Network Coding helps to solve the bottleneck issue and reduce the number of transmission time, by allowing the packets from different sessions (source) to be encoded together [12]. By reducing the number of necessary communication, network coding increases the throughput and simultaneously reduces interference mechanism in wireless networks.
Fig. 1. Existing transmission method without using Network Coding.
Fig. 2. Transmission method using Network Coding to reduce transmission time. 3.1.2. Intra-section Network Coding
[image:4.595.167.433.275.326.2] [image:4.595.162.437.368.421.2]Fig. 3. Network Coding to improve reliability.
[image:5.595.189.439.91.198.2]3.2. Proposed PMUs integrated Network Coding
Figure 4 shows the block schematic diagram of a PMU with three important components: (i) GPS signal receiver detects the 1PPS (pulse per second) synchronizing signal from GPS satellites. This signal is used as the time source in a phase locked oscillator and time-tagged for every phasor reporting message; (ii) Data acquisition module includes the anti-aliasing filter to cut off high frequency and ADC module to sample the signals; (iii) Phasor processor acquires the digitalized signals in order to analyze phasor information. Then it integrates the times to phasor message based on the IEEE C37.118 packet format. We propose the function of Intra-Network Coding into phasor processor after it generates phasor messages. The needed parameters for Network Coding, such as Galois field or number of coded messages, can be adjusted by user.
Fig. 4. Proposed Network Coding approach for PMU synchrophasor data transmission.
4.
Proposed Data Gathering Scheme
4.1. Network Model
[image:5.595.181.416.388.543.2]Fig. 5. Our test case network of PMUs used in simulation.
4.2. Synchrophasor Data Gathering Method
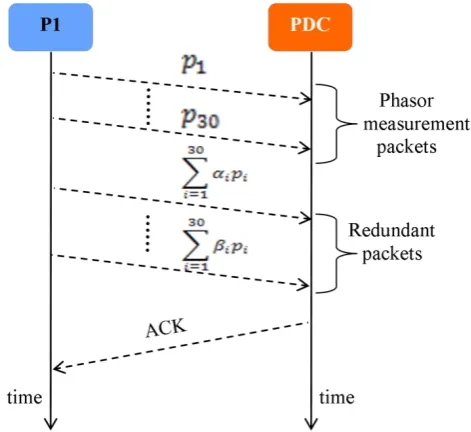
By following the PMUs network model given in previous subsection, we developed our method of synchrophasor data gathering as shown in Fig. 6. The data collection includes two phases as mentioned below:
Phase 1: Each PMU sends 30 packets to PDC in one second. This corresponds to the common
reporting rate of State Estimation application [17];
Phase 2: PMU then encodes all 30 phasor data packets in Phase 1 using the combination of linear
independent of equations as in Eq. (1). We call these coded packets are redundant packets. Actually, the number of redundant packets is dependent on the role of PMU at particular placement in distribution grid, such as at Transformer or Distribution Generation. However, we set the total number of redundant packets of all PMUs equal in our simulation.
𝑝𝑟𝑒𝑑𝑢𝑛𝑑𝑎𝑛𝑡= ∑30 𝛼𝑖𝑝𝑖
𝑖=1 (1)
where 𝛼𝑖 are the random coefficients represented in Galois field, and 𝑝𝑖 is the phasor data packets represented in Galois field. For instance, with Galois field GF(21) = {0; 1}, then 𝛼𝑖= 0 or 1 and 𝑝𝑖 is presented by 0 and 1. Similarity with the Galois field GF(28) = {0; 1; 2;…; 255}.
[image:6.595.111.462.77.269.2] [image:6.595.178.414.522.738.2]After decoding and successfully receiving phasor packets as in Eq. (2), PDC sends Acknowledgement message to PMU and turn to other PMUs to collect data.
{
𝛼1𝑝1+ 𝛼2𝑝2+ ⋯ + 𝛼30𝑝30= 𝑝𝑟𝑒𝑑𝑢𝑛𝑑𝑎𝑛𝑡1 𝛽1𝑝1+ 𝛽2𝑝2+ ⋯ + 𝛽30𝑝30= 𝑝𝑟𝑒𝑑𝑢𝑛𝑑𝑎𝑛𝑡2
…
𝜔1𝑝1+ 𝜔2𝑝2+ ⋯ + 𝜔30𝑝30= 𝑝𝑟𝑒𝑑𝑢𝑛𝑑𝑎𝑛𝑡𝑘
(2)
where 𝑘 is the total number of redundant packets generated at a PMU.
5.
Numerical Simulations
In this section, we access the validity of our proposed method by using the Monter Carlo simulation in order to ensure the statistical significance of the corresponding results. We implement our test case PMUs in Fig. 5 based on Matlab R2012b simulator [18]. The Network Coding library is based on Network Coding libraries developed by Chamitha de Alwis [19]. We use the total number of phasor packets per PMU in simulation is 104 (packets) for every value of the number of redundant packets. We choose the coding and decoding processes based on GF(21), GF(24) and GF(28), the three common Galois fields used in Network Coding. From the reliability requirement in Table 1, we define the maximum boundary for both random loss and burst loss as 5%. Further, we iterate the simulation 20 times, each simulation with different random number generators. The parameters used in simulation are given in Table 2.
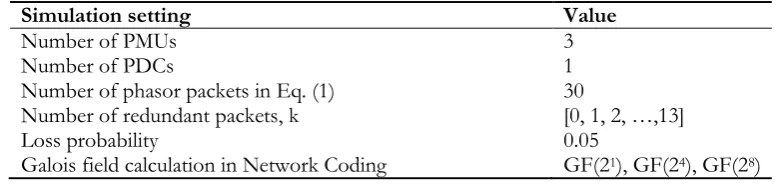
Table 2. Simulation settings for random and burst loss scenarios.
Simulation setting Value
Number of PMUs 3
Number of PDCs 1
Number of phasor packets in Eq. (1) 30
Number of redundant packets, k [0, 1, 2, …,13]
Loss probability 0.05
Galois field calculation in Network Coding GF(21), GF(24), GF(28)
5.1. Random Loss Scenario
In first simulation, we investigate the performance of our proposed method under random loss in the channels. During the simulation, we generate random packet loss with the probability 0.05 since this is the highest channel loss requirement that SGC can suffer in wireless channel [17].
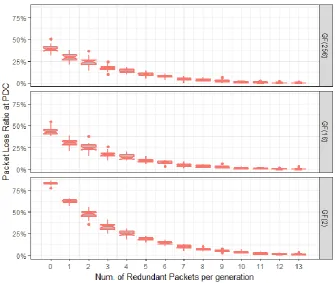
The box plots in Fig. 7 shows the simulation results in term of the median values and 95% confident interval of packet loss ratio at PDC with every number of redundant packets as in Table 2. The general trend for all Galois field sizes is when we increase the number of redundant packets, the packet loss ratio will decrease significantly. In details, the performance of GF(24) and GF(28) is quite similar, with 𝑘 = 6 (packets), the packet loss ratio reaches to zero. Meanwhile if we use GF(21), we have to increase number of redundant packets up to 10 packets in order to reach 100% packet delivery.
5.2. Burst Loss Scenario
[image:7.595.102.492.393.486.2]Fig. 7. Packet loss results of our proposed phasor data gathering method with Galois fields GF(21), GF(24) and GF(28) under random loss scenario in the PMUs communication network.
[image:8.595.127.469.77.365.2] [image:8.595.130.466.418.701.2]From the simulation results, we can conclude that our proposed method has achieved a remarkable performance in improving the SCG reliability under random loss phenomenon. As a consequence, the packet delivery time will reduce since our method does not need to use retransmission mechanisms due to packet loss. However, in the burst loss scenario its performance is low, since the number of needed redundant packets consumes about half of total transmitted packets from PMU.
5.3. Combined Loss Scenario
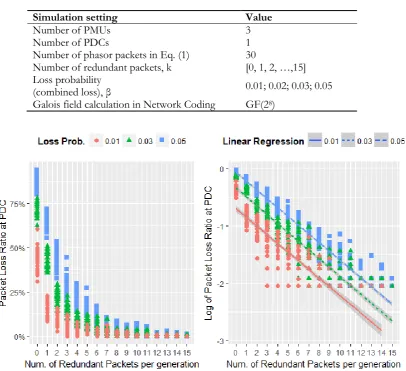
In last numerical simulation, we fully investigate the effectiveness of proposed method under the effect of two types of loss simultaneously. Then, we apply the semi – analytical approach to derive the multiple linear regression model of packet loss ratio. To limit the simulation time, we only propose to use the GF(28) Galois field. The parameters used in simulation are given in Table 3.
Table 3. Simulation settings for combined loss scenario.
Simulation setting Value
Number of PMUs 3
Number of PDCs 1
Number of phasor packets in Eq. (1) 30
Number of redundant packets, k [0, 1, 2, …,15] Loss probability
(combined loss), β 0.01; 0.02; 0.03; 0.05
Galois field calculation in Network Coding GF(28)
Fig. 9. (a). Packet loss results of our proposed method with GF(28) under combined loss scenario, vary the loss probability; (b). The linear regression lines with different loss probabilities.
[image:9.595.105.512.255.626.2]The general form of multiple linear regression model is shown as in Eq. (3). 𝐴, 𝐵, 𝐶 are the coefficients, 𝑘 ≥ 0 is the number of redundant packets and 𝛽 ≥ 0 is the loss probability in SGC.
log(𝑙𝑜𝑠𝑠_𝑟𝑎𝑡𝑖𝑜) = 𝐴 + 𝐵. 𝑘 + 𝐶. 𝛽 (3) Table 4. The coefficients from multiple linear regression model using Caret package.
Estimation Standard Error Sign. Of Test
A -1 0.024 < 0.001
B -0.15 0.002 <0.001
C 0.31 0.010 <0.001
Residual Standard Error 0.213 Adjusted R-Square 0.879 Significant of Test <0.001
Using the prediction and classification Machine Learning package CARET in R [21, 22], we obtain the parameters as in Table 4, and the result model is represented as Eq. (4).
[image:10.595.128.469.170.259.2]log(𝑙𝑜𝑠𝑠_𝑟𝑎𝑡𝑖𝑜) = −1 − (0.15). 𝑘 + 0.31. 𝛽 (4) From this model, we conclude that in general, with the same level of combined loss probability it increases one redundant packet in our method which help to reduce the log of loss ratio at PDC about 15%. In general, the model in Eq. (4) helps network designer to estimate of level of SGC reliability enhancement, the given the number of redundant packets and the SGC loss probability. The predicted values from Equation (4) have shown the consistency with the log of loss ratio from simulations, as shown in Fig. 10.
Fig. 10. The comparison between predicted log of loss values from model in Eq. (4) and values from simulations.
6.
Conclusion
[image:10.595.154.444.409.619.2]Coding method. Finally, our proposed scheme is the initial step to explore the number of needed PMUs in each OPP problem taken into account the communication aspect.
In future research, we will continue to develop mathematic model of our proposed synchrophasor data gathering method together with OPP issue and find the optimal number of redundant packets at every PMU that can satisfy data quality requirements of many WAMS applications.
Acknowledgement
This research is supported by Rachadapisek Sompote Fund for Postdoctoral Fellowship, Chulalongkorn University.
References
[1] R. H. Khan and J. Y. Khan, “A comprehensive review of the application characteristics and traffic requirements of a smart grid communications network,” Computer Networks, vol. 57, pp. 825–845, 2013.
[2] V. C. Gungor, D. Sahin, T. Kocak, S. Ergt, C. Buccella, C. Cecati, and G. P. Hancke, “Smart grid technologies: Communication technologies and standards,” IEEE Trans. On Industrial Informatics, vol.
7, no. 4, pp. 529–539, 2011.
[3] V. Gungor, D. Sahin, T. Kocak, S. Ergut, C. Buccella, C. Cecati, and G. Hancke, “A survey on smart grid potential applications and communication requirements,” Industrial Informatics IEEE Transactions on, vol. 9, no. 1, pp. 28–42, 2013
[4] C. Huang, F. Li, D. Zhou, J. Guo, Z. Pan, Y. Liu, and Y. Liu, “Data quality issues for synchrophasor applications part I: A review,” Journal of Modern Power Systems and Clean Energy, vol. 4, no. 3, pp. 342– 352, 2016. [Online]. Available: http://dx.doi.org/10.1007/s40565-016-0217-4.
[5] N. M. Manousakis, G. N. Korres, and P. S. Georgilakis, “Optimal placement of phasor measurement units: A literature review,” in Intelligent System Application to Power Systems (ISAP), 16th International Conference on, Sept. 2011, pp. 1–6.
[6] W. Yuill, A. Edwards, S. Chowdhury, and S. P. Chowdhury, “Optimal PMU placement: A comprehensive literature review,” in 2011 IEEE Power and Energy Society General Meeting, pp. 1–8. [7] X. Dongjie, H. Renmu, W. Peng, and X. Tao, “Comparison of several PMU placement algorithms for
state estimation,” in Developments in Power System Protection, 8th IEE International Conference on, 2004, vol. 1,
pp. 32–35.
[8] C. Huang, F. Li, D. Zhou, J. Guo, Z. Pan, Y. Liu, and Y. Liu, “Data quality issues for synchrophasor applications part II: Problem formulation and potential solutions,” Journal of Modern Power Systems and Clean Energy, vol. 4, no. 3, pp. 352–361, 2016. [Online]. Available: http://dx.doi.org/10.1007/s40565-016-0213-8
[9] R. Ahlswede, N. Cai, S.-Y. Li, and R. Yeung, “Network information flow,” Information Theory IEEE Transactions on, vol. 46, no. 4, pp. 1204–16, 2000.
[10] OpenSG User’s Group. [Online]. Available: http://osgug.ucaiug.org/UtiliComm/SharedDocuments/ [11] N. T. Le and W. Benjapolakul, “Opportunistic hybrid network coding data gathering scheme for
non-concurrent applications in smart grid neighborhood area network,” in 2016 13th International Conference on Electrical Engineering/Electronics, Computer, Telecommunications and Information Technology (ECTI-CON), Chiang Mai, 2016, pp. 1-5.
[12] IEEE Standard for Synchrophasor Measurements for Power Systems –Amendment 1: Modification of selected performance requirements, IEEE Standard C37.118.1a-2014.
[13] M. Medard and A. Sprintson, Network Coding Fundamentals and Applications. Elsevier Academic Press, 2011.
[14] IEEE Standard for Broadband over Power Line Networks: Medium Access Control and Physical Layer Specifications, IEEE Std 1901-2010, pp. 1–1586.
[15] Long Term Evolution (LTE). [Online]. http://www.etsi.org/technologiesclusters/technologies/ mobile/long-term-evolution [Accessed: Sept. 15, 2016]
[16] WiMAX Forum. [Online]. Available: http://wimaxforum.org/ [Accessed: Sept. 15, 2016]
[18] Matlab. [Online]. Available: https://www.mathworks.com/products/matlab.html
[19] C. de Alwis. Network Coding Simulator. [Online] Available: http://www.mathworks.com/matlabcentral/ fileexchange/53750-networkcoding-simulator [Accessed May 15, 2016]
[20] J.-P. Ebert and A. Willig, “A Gilbert-Elliot bit error model and the efficient use in packet level simulation,” Telecommunication Networks Group, Technical University Berlin, TKN Technical Report TKN-99-002, 1999.
[21] The R Project for Statistical Computing. [Online]. Available: https://www.r-project.org/ [Accessed: Jannary 10, 2017]
![Table 1. Required PMU reporting rates and data reliability based on IEEE C37.118 standard [12] and OpenSG [10]](https://thumb-us.123doks.com/thumbv2/123dok_us/8107362.235448/3.595.82.515.501.565/table-required-reporting-rates-reliability-based-standard-opensg.webp)