The Australian National University Centre For Gravitational Physics
Coating-Free Mirrors
for Ultra-Sensitive Interferometry
Jeff Cumpston
A thesis submitted for the degree of
Bachelor of Science (hons)
at
The Australian National University
Declaration
This thesis is an account of research undertaken between July 2005 and May 2006 at The Department of Physics, Faculty of Science, The Australian National University, Canberra, Australia.
Except where acknowledged in the customary manner, the material presented in this thesis, along with the design of the coating-free mirror, is, to the best of my knowledge, original and has not been submitted in whole or part for a degree in any other university.
Important contributions made by others are appropriately referenced in the text.
Acknowledgements
First of all I would like to my supervisors, Dr. Stefan Goßler and Professor David Mc-Clelland.
I thank David for his guidance and support; for always making himself available to review my work and to provide advice, especially at the times I needed it the most. I thank him most of all for providing me with the opportunity to work in the group. I have learnt so much since I started here; about experimental optics, but also about the greater world of physics outside of undergraduate coursework.
My direct supervisor, Stefan, has left me in awe of his selflessness. I have been amazed at the amount of personal time and effort he has invested in helping me to obtain the best results possible. I will be forever grateful for his encouragement and friendship during this time, and also for his strict demands on attention to detail in document writing, which has never been one of my strong points.
I am grateful to Kirk McKenzie for always taking the time to answer my questions, and for the loan of the amplitude modulator, without which the experimental data obtained in this project may have been severely limited. I thank Conor Mow-Lowry for interesting discussions about details of the project, and for Introducing me to Magical Trevor. Thanks to Mal Gray and James Dickson for designing and building the electronics used in this project.
Thanks to my other colleagues Bram Slagmolen, David Rabeling, Glenn de Vine, Lee Pedersen, Theo Karner, Jong Chow, Ben Sheard, Adam Mullavey for creating an excellent working environment. It’s been fun, and I look forward to working more with you all in the future.
For proof reading of this document I thank David McClelland, Stefan Goßler, Kirk McKenzie.
During the course of my honours, my parents, Mike and Pauline, have always been there to help me out with advice, and never failed to call once a week to make sure I was doing all right. For this I thank them.
Abstract
Thermodynamical fluctuations impose random noise on the position of optical compo-nents. It is predicted that this thermal noise will limit the sensitivity of interferometric gravitational-wave detectors in their most sensitive frequency band. Thermal noise orig-inating from optical coatings was first considered in the context of interferometric gravi-tational wave detectors. Its true significance was, however, only revealed after Y. Levin introduced a new method in 1998 to calculate the resulting phase noise of a laser beam reading out the position of a coated mirror. A result of this analysis is that the reflective optical coatings introduce a particularly large portion of thermal noise.
As a consequence, coating thermal noise is expected to prevent the detection of the standard quantum limit; a limitation to the sensitivity of an interferometric measurement caused by quantum fluctuations in the optical field. Elimination of the coating thermal noise will increase the likelihood of the successful observation of the standard quantum limit, thus enabling the investigation of quantum noise in the regime of optical squeezing. This project investigated a means to eliminate the effects of coating thermal noise, with the design and characterisation of a highly reflective coating-free mirror. This mirror utilised the phenomenon of total internal reflection and the Brewster angle to reflect light without the use of coatings. The dimensions of the mirror were governed by its expected implementation in an experiment to measure the standard quantum limit.
The design of the coating-free mirror undertaken as the initial part of this project is presented in detail. Once a CFM had been created according to this design, its spatial dimensions were measured. The weight of the mirror is 0.43±0.01 g, well within the design goal of 0.5 g.
In order to analyse the reflectivity of the coating-free mirror it was incorporated, together with a high quality conventional mirror, into a triangular ring cavity. This cavity was stabilised to the laser frequency by the Pound-Drever-Hall technique. This enabled the interrogation of the stable cavity properties by an AM-sideband transfer scheme. The reflectivity of the mirror was analysed for optimum rotational alignment and as a function of its rotational alignment angle. The maximum reflectivity deviated from the expected value calculated from the mirror design. Most of the excess loss was attributed to scat-tering due to surface roughness at the points of total internal reflection and a necessary deviation from the Brewster angle due to the geometry of the cavity combined with the flat front face of the coating free mirror.
Contents
Declaration iii
Acknowledgements v
Abstract vii
Contents ix
List of figures xiii
List of tables xv
Acronyms xvii
1. Introduction 1
1.1. Gravitational Wave Detection . . . 2
1.1.1. Noise in an Interferometric Gravitational-Wave Detector . . . 3
1.2. Reaching the SQL . . . 6
1.3. Coating Thermal Noise . . . 8
1.3.1. Fluctuation-Dissipation Theorem . . . 8
1.3.2. The Levin Method . . . 8
1.3.3. Loss in the coating . . . 9
1.4. Proposed Solutions . . . 11
2. Control and Characterisation of a Two-Mirror Cavity 15 2.1. The Gaussian Beam . . . 15
2.1.1. Beam Parameters . . . 16
2.1.2. Hermite-Gaussian Beams . . . 17
2.1.3. Intensity . . . 18
2.2.1. Cavity Loss . . . 20
2.2.2. Cavity Resonance . . . 21
2.2.3. Cavity Characterisation . . . 22
2.3. Cavity Stability and Mode Matching . . . 23
2.4. Polarisation . . . 25
2.5. Modulation and Cavity Control . . . 26
2.5.1. Modulation . . . 26
2.5.2. The Pound-Drever-Hall Locking Technique . . . 28
2.5.3. Cavity Interrogation with an Amplitude Modulated Beam . . . 29
2.6. Summary . . . 30
3. Mirror Design 31 3.1. Electromagnetic Waves in matter . . . 31
3.1.1. Snell’s Law and TIR . . . 31
3.1.2. The Fresnel Equations . . . 32
3.1.3. The Brewster Angle . . . 33
3.2. Coating-Free Mirror Concept . . . 34
3.3. Design for Experiment . . . 35
3.3.1. CFM Size . . . 36
3.3.2. Corner Angle . . . 36
3.3.3. CFM Reflectivity . . . 39
3.3.4. CFM Rotation . . . 40
3.4. CFM Cavity Equations . . . 42
4. Experimental Setup and Results 45 4.1. Experimental Layout . . . 45
4.2. Measured Mirror Geometry . . . 47
4.3. Modematching . . . 48
4.4. Cavity Alignment . . . 50
4.5. Cavity Scan . . . 51
4.5.1. FWHM and FSR . . . 52
4.5.2. Beam Transverse Alignment . . . 53
Contents
4.6.1. Servo and PZT Frequency Response . . . 54
4.6.2. Locking the Cavity . . . 55
4.7. CFM Reflectivity . . . 56
4.7.1. AM-Sideband Cavity Interrogation . . . 56
4.7.2. CFM Reflectivity . . . 57
4.7.3. CFM Rotation Calibration . . . 58
4.7.4. Reflectivity Vs. Rotation . . . 58
4.7.5. Non-Perfect Total Internal Reflection . . . 59
4.8. Intracavity Power . . . 60
4.9. Transverse Electric Polarisation . . . 61
4.10. Summary . . . 62
5. Summary and Future Work 63 5.1. Summary . . . 63
5.2. Future Work . . . 64
A. ABCD Matrices 67
B. Tabulated Experimental Data 69
C. The Relationship Between Finesse, FWHM, and FSR 71
List of figures
1.1. Sensitivity of Advanced LIGO . . . 5
1.2. Shot Noise and Radiation Pressure Noise . . . 6
1.3. Braginsky’s design for corner reflectors . . . 11
1.4. Giazotto’s design for corner reflectors . . . 12
1.5. Khalili’s desing to reduce coating thermal noise . . . 12
2.1. Gaussian beam parameters . . . 18
2.2. 3D profile of TEM00 . . . 19
2.3. A Fabry-Perot resonator . . . 19
2.4. Phasor diagram of optical resonator with different detunings . . . 22
2.5. Amplitude and phase response of Fabry-Perot cavity . . . 23
2.6. Three different polarsations . . . 26
2.7. The polarisation vector after passing through an amplitude modulator and quarter-wave plate . . . 28
2.8. Cosine and sine amplitude and phase modulation . . . 29
2.9. The reflected intensity and error signal for a 50 cm cavity . . . 30
3.1. Perspective drawing of the CFM . . . 31
3.2. A beam incident on a dielectric interface . . . 32
3.3. Transmitted and reflected power at a dielectric interface for TM polarised light . . . 33
3.4. Transmitted and reflected power at a dielectric interface for TE polarised light . . . 34
3.5. The coating free mirror concept . . . 35
3.6. Information pertaining to CFM dimesions . . . 37
3.7. Trajectory of light incident on the corner . . . 37
3.8. The cavity length as a function of the change in corner angleδ . . . 38
3.9. The dimensions of the CFM design for this experiment . . . 39
3.10. Beam trajectories as the CFM is rotated . . . 41
4.1. Experimental layout . . . 46
4.2. Measurement of the CFM angles . . . 47
4.3. The CFM dimensions, as measured in this experiment . . . 48
4.4. The calculated beam width and radius of curvature . . . 49
4.5. The beam profile for the horizontal component of the beam . . . 49
4.6. The rotatable stand used to hold the CFM . . . 50
4.7. Misalignment of the CFM cavity . . . 51
4.8. FWHM and FSR of the CFM cavity . . . 53
4.9. Response of the Michelson interferometer used to obtain the PZT frequency response . . . 55
4.10. Open loop frequency response of the PZT and the servo . . . 55
4.11. Error signal of CFM cavity . . . 56
4.12. The measured frequency response of the CFM cavity . . . 57
4.13. Reflectivity of the coating-free mirror as a function of rotation . . . 59
4.14. Photographs of CFM with cavity on resonance . . . 60
4.15. The effect of mirror rotation on the position where the beams converge . . 60
4.16. The power reflected from the front face of the CFM as a function of rotation 61 4.17. A close-up scan of the frequency response of the cavity for the TE polarisation 62 5.1. A design of an all coating free dual-recycled Michelson interferometer . . . 65
A.1. Optical components (left) and their corresponding ABCD matrices (right) 67 C.1. A triangle as used in order to re-express the arccos expression for φ in terms of arctan . . . 72
List of tables
Acronyms
AM Amplitude modulation
AdvLIGO Advanced LIGO
CFM Coating free mirror
CTE Coeffiecient of thermal expansion CTD Coeffiecient of thermal diffusion
EOM Electro-optic modulator
IGWD Interferometric gravitational-wave detector
FSR Free spectral range
FWHM Full width at half maximum
LCGT Large Cryogenic Gravitational-wave Telescope LIGO Laser Interferometer Gravitational-wave Observatory
PD Photo detector
PM Phase modulation
ppm Parts per million
SQL Standard quantum limit
Chapter 1.
Introduction
With the increasing sensitivity of high precision interferometric experiments such as gravitational-wave detection, and endeavours to reach the standard quantum limit of interferometry (SQL), the quality of optical coatings has become more relevant. The optical quality of the mirror coatings has dramatically increased in recent years, how-ever, the aspect of the mechanical properties of optical coatings has long been neglected. While the mechanical properties are of no significance for standard applications, they are of crucial importance for interferometric gravitational-wave detectors (IGWDs), as well as for experiments aiming to reach the SQL. However, it was not until a novel method of calculating the thermally driven displacement noise associated with optical coatings was proposed by Yu. Levin [Levin ’98] in 1998, that the significance of coating thermal noise was revealed.
The so called normal-mode decomposition approach was commonly used to derive the thermal noise associated with the test masses. Although it gave excellent results for the thermal noise of bare test mass substrates, this approach fails to take inhomogeneously distributed loss appropriately into account. Consider, for example, the 40 kg test masses of Advanced LIGO, which have a coating layer of a few microns in thickness. The mechanical quality factor of the test mass substrate comprised of high quality fused silica is much higher than that of the optical coating, and as such, in a coated test mass, the loss is extremely inhomogeneously distributed. Since the coating is in direct interaction with the laser beam that reads out the test mass position, the thermal noise of the coating is of far greater importance than the normal mode decomposition method would suggest. As a consequence, the introduction of the Levin method revealed that the contribution to the thermal displacement noise by the optical coatings was greater than previously expected, and is the dominant source of thermal noise associated with the test masses 1. In fact, coating thermal noise is expected to limit the sensitivity of Advanced LIGO in its most sensitive frequency band.
The significance of coating thermal noise was discovered in the wake of the quest to build IGWDs, however, it is an even more severe problem for experiments aiming to reach the SQL. In fact, according to the calculations undertaken so far, it is unclear whether the SQL can be reached at all with the currently available coatings. The challenges with such experiments result from the fact that short Fabry-Perot cavities must be employed, in order to enable the observation of small length fluctuations, and to reduce the sensitivity
1
of the setup to fluctuations of the laser frequency. From the theory of optical resonators, presented in Chapter 2, it is evident that the laser spot size in a short cavity needs to be small to fulfil the stability criterion. As we will see in the following sections, the thermal noise of mirrors and their coatings scales inversely with the diameter of the interrogating laser beam, which can be understood as averaging the displacement noise at the surface of the mirror over the area of the incident beam.
When designing an SQL experiment, the coating noise can be circumvented with the implementation of a mirror with no optical coating. Such a mirror is required to be used as an opto-mechanical coupler, such that it efficiently couples quantum fluctuations in the light field to displacement. Maximum displacement will occur in this regime when the inertia of the sensor is minimised. Thus, it is desirable to minimise the mass of the coating free mirror, limited by the necessity to limit diffraction loss of the laser beam. Hence, the mass of the mirror was restricted to be no greater than 0.5 g. The design and characterisation of such a mirror with no optical coating was the objective for the work described in this thesis.
The structure of this thesis is detailed as follows:
Chapter 1 motivates the project by placing it in the context of experiments in which coating thermal noise is expected to be a limiting factor. Following this, the mecha-nisms that give rise to coating thermal noise are discussed. The chapter ends with an examination of the previously proposed solutions to the problem of coating thermal noise. Chapter 2 introduces the relevant theory of optical resonators and an introduction to cavity control.
Chapter 3 describes the design of the coating-free mirror, its expected limitations, and its capacity to reflect light under rotational misalignment. In order to characterise the coating-free mirror it is incorporated into an optical cavity. The equations describing this cavity are presented.
Chapter 4 provides a detailed account of the processes undertaken in setting up the exper-iment in conjunction with the experexper-imental results. This includes a full characterisation of the mirror in terms of its dimensions, reflectivity, and limitations.
Chapter 5 starts with a summary of the project outcome and considers in what way the experiment could be improved. Some interesting ideas for further work involving coating free optics concludes the thesis.
1.1. Gravitational Wave Detection
1.1. Gravitational Wave Detection
gravitational action at a distance - a consequence of Newton’s gravitational theory - was also accounted for by the new formalism, which postulated that a disturbance in the fabric of spacetime travels at the speed of light. A consequence of Einstein’s theory of general relativity is that a change in quadrupole momentum of a given mass distribution results in the emmitance of gravitational waves. Although these gravitational waves carry a large amount of energy, the coupling to objects through which they pass is incredibly small. This means that a gravitational wave will contain information that has been largely unaffected during its journey.
While the early universe was opaque for electromagnetic radiation until about 380,000 years after the big bang, gravitational waves were not subject to this restriction. Thus, it is expected that gravitational waves contain information about the universe from as early as 10−43s after the big bang. Information about the universe at this early stage is unable to be directly detected by any other means.
The weak coupling of gravitational waves to matter also means, however, that gravi-tational waves are hard to detect. A gravigravi-tational wave is predicted by the existing theoretical models to impart a strain of not more than h ≤ 10−21/√Hz on a ground based gravitational wave detector.
The most promising approach to detect gravitational waves on earth is based on Michelson interferometers. These IGWDs have an inherently broad band response to gravitational waves, spanning a frequency band from about 50 Hz to a few kilohertz. Due to the quadrupole nature of gravitational waves, a Michelson interferometer is an ideal device for their detection. A gravitational wave propagating orthogonal to the plane of the interferometer alters the path length in the arms in a differential manner, and thus couples some of the light power within the interferometer to the output port.
1.1.1. Noise in an Interferometric Gravitational-Wave Detector
The chief goal during the commissioning of a IGWD is the reduction of noise that may couple to the interferometer output port. This will increase the signal to noise ratio of a gravitational wave signal, increasing the confidence with which claims of a successful detection can be made.
Seismic Noise
The test masses in an IGWD need to be isolated from seismic disturbances by many orders of magnitude (i.e. about ten orders of magnitude at 100 Hz). In order to obtain this isolation they are suspended from pendulums, which act as a low pass filter for seismic vibrations. A simple pendulum has a response to a driving force that scales as 1/f2 above its resonance frequency. The suspension systems of the IGWDs are designed to have a low resonance frequency so that the suspended test masses are well isolated in the band of interest. Further isolation can be obtained by cascading pendulums, which provides attenuation that scales as 1/f2n, where nis the number of suspension stages; GEO 600,
Thermal Noise
In the current generation of the gravitational wave detectors, thermal fluctuations of the interferometer test masses or their suspensions will predominate over quantum noise in the most sensitive frequency band. Random thermal fluctuations in the test masses and their suspensions provide uncorrelated changes in the path lengths of the two beams within the interferometer. The fluctuation-dissipation theorem (see Section 1.3.1) relates this thermal noise directly to the material’s mechanical quality factors Q, where the Q is inversely proportional to the loss in the material. Loss can arise from anelasticities in the material (bulk loss), from the thermoelastic effect due to a nonzero coefficient of thermal expansion, or from the nonlinear thermoelastic effect due to the thermal depen-dence of the Young’s modulus. Much research has been conducted regarding these loss mechanisms. For detailed descriptions see e.g. [Gillespie ’94, Gillespie ’93, Willems ’99, Willems˙’02, Kajima ’99, Cagnoli ’02].
As a result of the scaling of thermal noise with the loss in the material, it is desirable to have a test mass that is both of high optical and high mechanical quality. Current and future IGWDs plan to use either fused silica (AdvLIGO) or sapphire (LCGT) for their test mass substrate material. Also, cooling of the interferometer test masses is planned for Japan’s LCGT, the proposed Large Cryogenic Gravitational-wave Telescope, in order to reduce thermal noise. In the absence of cooling, the greatest contribution to thermally induced displacement noise of the test mass surfaces is due to Brownian thermal noise in the optical coatings. This is explained by internal friction of the combined coating materials, introducing excess loss. As the detrimental effects of coating thermal noise were the main motivation for this project, a detailed exploration of this topic is undertaken in Section 1.3.
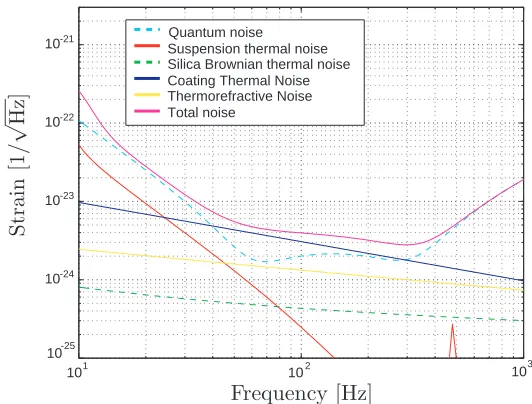
Due to suspension systems and test masses of higher quality, the thermal noise of these components can be lowered by about one order of magnitude for the next generation of IGWDs. However, thermal noise of the optical coatings is still expected to be the limiting noise source in the most sensitive frequency band of AdvLIGO. Figure 1.1 shows the predicted sensitivity curve of AdvLIGO. This sensitivity plot was generated using the matlab program BENCH2.
Quantum Noise
The frequency of the laser is stabilised to a reference cavity in the interferometer. This can be done by using, for example, the arm cavities of the LIGO interferometer, as they provide an excellent frequency reference above the resonance frequency of the pendulum suspensions. The power of the laser is stabilised by means of a noise eater, where a small amount of the laser beam is tapped off and sent to a photodetector. Any change in power is detected and the according control signal is sent back to the laser. However, there is a limit to which the laser power and frequency can be stabilised. The Heisenberg uncertainty principle (HUP) places a lower bound on the product of the uncertainties of the two non-commuting variables of amplitude and phase, and this uncertainty manifests itself as quantum noise.
2
1.1. Gravitational Wave Detection
101 102 103
10 10 -24 10 -23 10 -22 10 -21
Total noise Quantum noise Suspension thermal noise Silica Brownian thermal noise Coating Thermal Noise Thermorefractive Noise
-25
Frequency [Hz]
S
tr
ai
n
[1
/
√ H
[image:23.595.152.418.140.342.2]z]
Figure 1.1.: The calculated amplitude spectral density of the noise expected for Advanced LIGO. This detector is limited by radiation pressure noise at low frequencies, shot noise at high frequencies, and thermal noise from the optical coatings in the most sensitive frequency band.
In an IGWD, a phase uncertainty limits the extent to which the interference of the two beams can be measured. This is known as shot noise. Shot noise is white noise; it is constant for all frequencies, and it scales inversely with the square root of the laser power. Hence, the signal to noise ratio (SNR), for shot noise increases with the optical power,
SNRSN ∝
√
P (1.1)
where P is the power of the optical field in the interferometer. Shot noise is reduced in an IGWD with the addition of a power recycling mirror. As the interferometer is locked to the dark fringe operation condition, all light is reflected back to the input port (symmetric port). By placing a mirror, the power-recycling mirror, at this port the light is re-injected into the interferometer. This technique leads to a resonant enhancement of the light power inside the interferometer, thus reducing the shot noise.
10-2
10 -1 100
101
102
10 -1
100 101 Power [kW] Am p litude [arb .]
100 101 102
10-4 10 -3 10 -2 10 -1 100
Frequency [Hz]
Amplitude [arb.]
SQL SQL
Figure 1.2.: Shot noise (blue) and radiation pressure noise (red) as a function of power for a given frequency (left), and as a function of frequency for a given power (right).
pressure noise (RPN) is proportional to this response. RPN decreases with the inverse square root of the light power, and accordingly
SNRRP N ∝
1 √
P (1.2)
Radiation pressure noise and shot noise at a given frequency scale inversely with re-spect to each other, as a function of laser power, so there is a power at which these two are equal in magnitude. Conversely, as a function of frequency, there is an accord-ing point at which the two noises are equivalent for a given power. This is known as the standard quantum limit (SQL), and in the absence of squeezing, it corresponds to the optimum sensitivity that can be achieved for an interferometric measurement. A successful experiment to measure the SQL would provide the first experimental observa-tion of the entire quantum noise spectrum of an opto-mechanical system. Furthermore, it would allow investigations of the spectral response of this system in the presence of squeezed light, which promises to increase the sensitivity of future gravitational-wave detectors [McKenzie ’02, Vahlbruch ’05, McKenzie 06, Vahlbruch ’06].
Figure 1.2 shown SN and RPN as a function of power, and as a function of frequency.
1.2. Reaching the SQL
1.2. Reaching the SQL
fluctuations in the amplitude of the light field to displacement fluctuations and can be built using a pendulum suspension or a torsion balance. The setup needs to be isolated from seismic vibrations, the classical properties of the optical field stabilised, and the optics and their suspensions are required to have a high enough mechanical quality, in order that thermal fluctuations do not predominate.
The dimensions of this interferometer are required to be small in order to make the setup sensitive for small length changes introduced by radiation pressure noise. As the system will be locked using the Pound-Drever-Hall method, length fluctuations are equivalent to laser frequency fluctuations. Hence, the cavity length fluctuations can be read out at the error point of the stabilisation loop. The cavity strain, as it corresponds to the change in laser frequency, is illustrated by the following equation
∆ν ν =
∆L
L (1.3)
whereν is the frequency of the laser, andLis the cavity length. Additionally, for a small cavity, the stability criterion requires that the beam size be small.
The optics of the interferometer or test cavity must be suspended such that they are sensitive enough to react sufficiently to displacements due to radiation pressure. Radiation pressure displacements can be increased by raising the laser power. This, however, comes at the expense of observable shot noise. Thus, it is preferable to minimise the mass, or moment of inertia, of the suspended optics, in order to reduce the optical power required for detection of radiation pressure noise. Care must be taken that reduction in the dimensions of the optic are not too great such as to cause diffraction loss in the incident beam. A small beam size is desirable for this reason also.
At this point, thermal noise in the optics becomes an important consideration. This can be minimised with the choice of a constituent material of a high mechanical quality. Conventional optics employ coatings in order to reflect light, which causes a considerable reduction in the mechanical quality of the system with which the beam interacts. As is shown in Section 1.3, this is furthered by the fact that the thermal displacement noise, resulting from direct interaction with the optical coatings by the laser beam, is considerably higher for a small beam size. Hence, the design and implementation of a reflector with no coatings promises to allow the use of a small beam, with a decreased risk that thermal fluctuations override the quantum effects in this regime. This provides the means to lower the moment of inertia of the system, with a decrease in the power required for the observation of radiation pressure noise. An according rise in relative shot noise increases the likelihood of measurement of the standard quantum limit.
theoretically only limited by the available squeezing strength, provided that there is no other limiting noise in the system.
There are currently four experiments being planned to reach the SQL; One at the Max-Planck Institute for Gravitational Physics in Hanover, Germany, one at the MIT, one in Tokyo, and one at the Centre for Gravitational Physics at the ANU [Goßler]. The experiment at the ANU will be based on a torsion balance as the opto-mechanical sensor. This torsion balance will be made from a fused silica bar, suspended from a thin fused silica fibre. The torsion bar will support both end mirrors of an arm cavity Michelson interferometer. In order to have a low inertia, the weight of the torsion bar must not exceed 1.5 g. Hence, the limitation on the weight of the mirrors to be not more than 0.5 g each. This experiment provides the main motivation for the work of this thesis.
1.3. Coating Thermal Noise
The motivation to eliminate optical coatings has been provided in the preceding sections. Here, a detailed discussion of thermal fluctuations in a reflective optic due to dielectric optical coatings is presented. These fluctuations result from physical processes that are described by the Fluctuation-Dissipation Theorem (FDT).
1.3.1. Fluctuation-Dissipation Theorem
The fluctuation-dissipation theorem was first presented by Callen and Welton in 1951 [Callen ’51, Callen ’52]. It asserts that a linear dissipative system in thermal equilibrium experiences random thermal fluctuations, and that there is an intrinsic relationship be-tween the amount of dissipation in the system and the magnitude of these fluctuations. For example, a resonator with a relatively high loss will exhibit a large degree of ther-mally induced fluctuations. Conversely, for resonators with a low loss, or high mechanical quality factor Q, the thermal noise is minimised.
1.3.2. The Levin Method
Until the introduction of the Levin method, calculations of the thermally driven dis-placement noise of a test mass were done via normal mode decomposition. This method involves summing over a large number of internal modes, and can be computationally expensive; especially for a small laser beam, where this sum converges very slowly. A much more severe drawback of the normal mode decomposition method lies in the fact that it is only valid when the sources of loss are homogeneously distributed over the test mass volume. For a test mass with inhomogeneously distributed loss, the normal mode approach breaks down. As pointed out in the introduction of this chapter, the loss in a AdvLIGO test mass are extremely inhomogeneously distributed: The test mass substrate weighs 40 kg and is made from high quality fused silica, which has a mechanical quality factor of about Qsubstrate ≃ 108. The coating, however, is only of a thickness of a few microns and has a mechanical quality factor of the orderQcoating ≃104.
ex-1.3. Coating Thermal Noise
pression reflects the resulting fluctuations in the phase of the sensing laser beam. The approach is based on applying an oscillatory pressure P(~r, t) = F0cos (ωt)f(~r) to the surface of the mirror. The spatial distribution f(~r) of the pressure is the same as that of the Gaussian profile of the interrogating laser beam. For obvious reasons the Levin method is also referred to as the Levin pressure approach. Its most significant implica-tion for this project is the fact that it shows that the thermal noise due to loss located near the mirror surface, as sensed by the laser beam, scales with the beam radius w0 as 1/w20. Since the normal mode decomposition does not take the location of the loss into account, this result differs from previous predictions; by a factor of 1/w0. As required, the two methods converge under consideration of the thermal noise due to loss inside the substrate, which scales with the laser beam radius as 1/w0.
The strong scaling of coating thermal noise with the laser beam radius is obviously of severe consequence when working with small beam radii. As described in Section 1.2, this is the case for experiments aiming to reach the standard quantum limit.
1.3.3. Loss in the coating
With the increasing sensitivity of the proposed interferometric gravitational-wave de-tectors, the demands on the thermal noise performance related to the test masses are increasing accordingly. The Levin method allows accurate calculations of the thermal noise of a coated test mass if input parameters such as the dimensions and mechanical quality factors of the substrate and the coating, as well as the parameters of the inter-rogating laser beam, are known to the according precision. These quantities have to be obtained or inferred from measurements undertaken beforehand.
At this point in time, the mechanisms by which this loss occurs are unknown, and ongo-ing experiments continue to probe the properties of the coatongo-ing, in order to gain a better understand of this [Harry ’02, Braginsky ’03, Crooks ’04]. These involve varying the num-ber of coating layers, the individual layer thickness, and the materials from which the coatings are comprised. The coating is formed from alternating layers of two materi-als, one of which is the substrate material, that are ion sputtered onto the surface of the substrate. Silica (SiO2) is of a sufficient optical and mechanical property to form the low refractive index constituent of the coating. However, the high refractive-index constituent is a subject of ongoing investigations. The candidate materials to form the high refractive-index constituent are tantala (Ta2O5) or alternatively alumina (Al2O3), which has a lower internal loss [Crooks ’04]. Regarding the mechanical quality of the coat-ing materials, two contributions to the displacement noise must be taken into account: the displacement noise due to dissipation by anelasticities, otherwise known as internal friction, and thermoelastic noise.
Internal friction
Harry ’02]
ˆ
Xmirror≃
4kBT
√ 2π ω
1−σ2 E w ·
φsubstrate + 2 √ π
1 − 2σ 1 − σ
l
wφcoating
(1.4)
HerekB is the Boltzmann constant,T is the temperature,E is the Young’s modulus, w is
the beam radius,σ is the Poisson’s ratio, andφis the loss. This is a simplified approach, derived for a semi-infinite test mass, under the assumptions that the Young’s moduli and Poisson’s ratios of the coating are similar in the directions parallel and perpendicular to the coating. Although, in general, this is not the case, this is a reasonable assumption for a coating comprised of alternating layers of SiO2 and Ta2O5, as the values for these materials are similar. Consequently, they can be assumed to be of the same value as those of the mirror substrate in the case of a fused silica mirror 3 Lastly, it is assumed that the internal friction occurs in the coating materials themselves and is not due to friction between the coating layers, in which case the number of coating layers, rather than the thickness of the coating, had to be accounted for. [Harry ’02]
All parameters in the above equation can be taken from the literature values except for the loss of the substrate and the coating. Values for these quantities have to be obtained by ring-down time measurements. The loss of a LIGO size (25 cm diameter, 10 cm thick-ness) fused silica substrate was measured by P. Willems at Caltech to be smaller than φ < 10−8. The loss of multilayer optical coatings of the above described materials was measured by [Crooks ’04] to be in excess of φ > 1.5·10−4, which if of the same order as those measured by [Harry ’02]. A direct measurement of coating thermal noise has been performed by E. Black in the thermal noise interferometer at Caltech [Black ’04]. The results were found in good agreement with Equation 1.4. K. Numata performed another direct measurement of coating thermal noise [Numata ’03] that agreed well with the coating thermal noise of a half-infinite test mass, derived from an method equivalent to the Levin method [Nakagawa ’02] used in the derivation of Equation 1.4.
Thermoelastic loss
Although the loss related to internal friction dominates the thermal noise of a coated mirror, the contribution due to thermo-elastic loss should to be taken into account for a full analysis. A simplified approach to obtain the power spectral density due to thermo-elastic loss in a multilayer coating of thickness l, made of two materials labelled aand b of thickness da anddb, respectively, yields
ˆ
Xcoatingthermo elastic = 8 √
2kBT2
π√ω l2
2 w2(1 + σs) 2Cavg2
C2 s
α2s √
DsCs
∆2 (1.5)
3
1.4. Proposed Solutions
where C is the heat capacity, α is the coefficient of thermal expansion (CTE), and D is the coefficient of thermal diffusion (CTD). Subscriptsrefers to a substrate property and
∆2=
(
Cs 2αsCavg
α 1 − σ
1 + σ 1 + σs
+ (1 − 2σs) E Es avg − 1 )2 (1.6)
To carry out the averaging an operator of the form
(X)avg= da
da + db
Xa +
db
da + db
Xb (1.7)
is used [Rowan ’05, Fejer ’03]. In order to reduce the thermoelastic noise, it would be desirable to have a common coefficient of thermal expansion of the mirror material and the coating materials.
1.4. Proposed Solutions
[image:29.595.161.415.405.486.2]Some different designs for mirrors without reflective coatings have previously been pro-posed.
Figure 1.3.: Braginsky’s design includes a lens at the front of the mirror in order to focus the beam. It also incorporates an anti-reflective coating to allow efficient in and out-coupling of the light to the prism.
Figure 1.4.: Giazotto’s design matches the front of the reflector to the radius of curvature of the beam. The rear reflectors are slightly curved to maintain cavity stability. Problems arise with the requirement that the light exiting the prism have a defined phase relationship with the promptly reflected light.
At the Italy-Australia Workshop on Gravitational Waves in October, 2005, A. Giazotto and G. Cella presented a similar design using total internal reflection [Giazotto ’05]. The front surface of this mirror is concave, such that it matches the radius of curvature of the incident beam. Without an anti-reflective coating, part of the incident beam is reflected from the front face of the prism. The fraction transmitted into the prism is reflected by the corner back towards to curved surface. Once it passes through this surface, its width and radius of curvature are equivalent to that of the promptly reflected beam, and their relative phase gives rise to interference. Thus, this design in fact describes an interferometer, with unwanted phase matching considerations that must be accounted for. It is desired that the two beams reflected from the mirror interfere constructively. This places strict requirement on the prism properties; spatial dimensions, thermal expansion, and refractive index homogeneity must all be extremely well characterised for the mirror for optimum reflection. Additionally, the light leaving the prism will accordingly partially reflect from the concave front surface. This small fraction of the light is scattered out of the stable cavity mode.
L=4 km L≤10 m
Figure 1.5.: Khalili’s design uses a short Fabry-Perot cavity, depicted here at the end of a LIGO arm. The thickly coated mirror is contained within the cavity, and thermal noise associated with this coating is suppressed by as much as 103
. This design comes at the expense of an extra length degree of freedom that must be controlled.
[image:30.595.180.420.505.572.2]in-1.4. Proposed Solutions
Chapter 2.
Control and Characterisation of a
Two-Mirror Cavity
This project consisted of the design and characterisation of a highly reflective coating-free mirror (CFM). The characterisation of the CFM was performed by including it as a cavity mirror in a two-mirror cavity. The cavity properties were then examined in order to infer information about the CFM. An overview of the theory required for the experiment is presented in this chapter. Initially, a discussion of the general properties of a laser beam is presented, as a basis for the setup of a Fabry-Perot resonator. A detailed introduction to the Fabry-Perot resonator is provided. This included a presentation of the cavity equations, cavity parameters, theory regarding the fundamental cavity eigenmode, and mode-matching the input beam to it.
Next, the theory of an active control system, used to maintain cavity resonance, is pre-sented. We used the Pound-Drever-Hall locking technique [Black ’00] for this purpose. A description of amplitude and phase modulation is presented, and finally, a technique to interrogate the cavity frequency response, using an amplitude modulation transfer function, is described.
The properties of the stabilised cavity can then be interrogated by amplitude modulated sidebands, and description of how this is achieved completes the chapter. This technique provides an indirect yet accurate means to determine the reflectivity of the CFM.
2.1. The Gaussian Beam
The laser beam is a paraxial wave, defined as a plane wave modulated by an envelope which is a slowly varying function of position, or approximately constant over the distance λ. This is theslowly varying envelope approximation (SVEA). The spatial properties of such a wave are described by its complex amplitude,
U(r) =A(r) exp(−ikz) (2.1)
represents a plane wave, exp(−ikz), modulated by the slowly varying complex envelope A(r), k = 2π/λ is the wavenumber, and λ is the wavelength of the light. The complex
amplitude of a paraxial wave is determined by substitution of A(r) into the paraxial
Helmholtz equation [Saleh, Teich ’91],
∂2 ∂x2 +
∂2 ∂y2
A(r)−i2k∂A(r)
One solution to Equation 2.2 is the complex envelope of the Gaussian beam. Substitution into Equation 2.1 provides an expression for the complex amplitude of the Gaussian beam,
U(r) =A0 w0
w(z)exp
−x
2+y2 w2(z)
−i
kz−kx 2+y2
2R(z) +ξ(z)
(2.3)
This expression completely describes its spatial properties in Cartesian co-ordinates. The beam described by this equation has azimuthal symmetry around the z axis, with the amplitude maximum at x = y = 0. Equation 2.3 is arranged such that the wavefront radius of curvature R(z), the beam radius w(z), the waist size w0 and the Guoy phase ξ(z) are explicitly shown. These beam parameters can be expressed as follows,
w2(z) = w20
" 1 + z z0 2# (2.4)
w20 =
λz0 π
(2.5) R(z) = z
1 +z0 z
2
(2.6)
ξ(z) = arctan
z z0
(2.7)
where z0 is the Rayleigh length,
z0 = πw02
λ (2.8)
2.1.1. Beam Parameters
Following the derivation of the Gaussian solution to the paraxial Helmholtz equation, a discussion regarding the beam parameters introduced above will help to elucidate these experimentally useful variables.
Beam Radius (w(z))
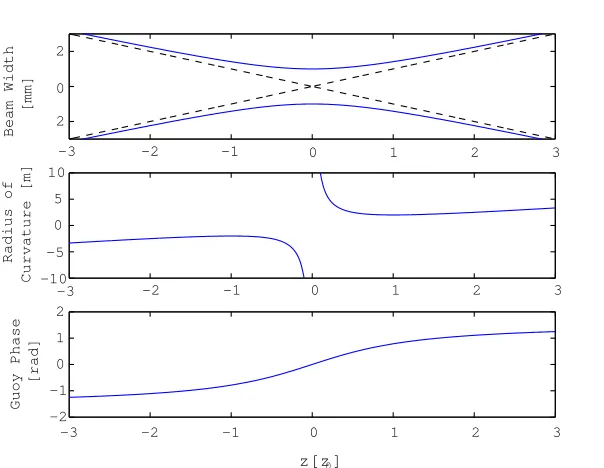
The beam radius w(z) is a measure of the width of the beam. It is defined as the transverse distance between the beam propagation axis and the point at which the real part of the beam amplitude is 1/e times the real axial amplitude. The beam radius necessarily changes with the propagation distance z, and a local minimum of w(z) is known as the waist of the laser beam. Figure 2.1 displays the behaviour of the beam radius about the beam waist.
Waist Size (w0)
2.1. The Gaussian Beam
increasing wavelength of light, and decreases with increasing convergence angle. Often, it is desirable to tailor the size of the waist to, for example, pass the beam through the aperture of an opto-electronic device such as an electro-optic modulator1. This is usually done by focusing the beam with a lens of an appropriate focal length in order to alter the beam convergence/divergence angle.
Radius of Curvature (R(z))
The curvature of the wavefront is generally expressed as the radius of a circle with the same curvature, and is denoted the radius of curvature R(z). At the position of the beam waist, the radius of curvature is infinite, or that of a planar wave, and at distances far from the waist of the beam it varies linearly with z, mimicking the behaviour of a spherical wave. Knowledge of the radius of curvature is important in establishing self reproducing beams within optical resonators. Figure 2.1 displays the radius of curvature of the beam as a function of propagation distance, about the beam waist.
Guoy Phase (ξ(z))
Theξ(z) term in the exponential argument of Equation 2.3 represents a phase retardation at the beam axis as a function of propagation distance z. This is known as the Guoy phase. It is the difference in phase of the Gaussian beam relative to a planar beam, along the beam axis. This phase shift occurs due to diffraction in the Gaussian beam. The Guoy phase of the beam at and about the beam waist can be seen in Figure 2.1.
Rayleigh Length (z0)
The Rayleigh length, z0, appears in all of the beam parameter expressions. It is used as a length unit which is universal for all beams. It may be defined in terms of any of the length dependent beam parameters discussed above. Specifically,z0 is the point at which theR(z) reaches a minimum,w(z0) =√2w0, andξ(z0) =π/4.
2.1.2. Hermite-Gaussian Beams
The Gaussian beam is not the only solution to the paraxial Helmholtz equation. It is the zeroth order solution of a family of paraboloidal beams known as Hermite-Gaussian, or transverse electromagnetic (TEMlm) modes, where the Gaussian beam is referred to as
the TEM00 mode. Hermite-Gaussian beams have a different Guoy phase, and a different transverse amplitude profile to the Gaussian beam. The wavefront of a paraboloidal beam matches the curvature of a spherical mirror with a large radius. This is important when arranging a stable resonator, as a wavefront which matches the curvature of the mirror upon which it is incident reflects back upon itself.
1
-3 -2 -1 0 1 2 3 2
0 2
-3 -2 -1 0 1 2 3
-10 -5 0 5 10
-3 -2 -1 0 1 2 3
-2 -1 0 1 2
z[z0]
Guoy Phase
[rad]
Radius of
Curvature [m]
Beam Width
[image:36.595.164.466.91.325.2][mm]
Figure 2.1.: The envelope of a focused Gaussian beam at W(z) (top). The dashed line is the ray optics approximation of the beam envelope. The waist is at the origin and its wavefront in planar at this point, with an infinite radius of curvatureR(0) (middle).
ξ(z) (bottom) is the phase retardation of the Gaussian beam with respect to a planar wave. It is zero at the origin and approaches±π
2 in the±zdirection.
2.1.3. Intensity
The beam intensity, in units of W/m2, is found by taking the modulus squared of the complex ampliiude,
I(r) =|U(r)|2 =I0 w 2 0 w2(z)exp
−2x 2+y2 w2(z)
(2.9)
2.2. The Fabry-Perot Resonator -2 0 2 -2 0 2 0 0.2 0.4 0.6 0.8 1.0
-3 -2 -1 0 1 2 3
0 0.2 0.4 0.6 0.8 1.0
Intensity (arb. units)
Radial Distance [w(z)]
Intensity (arb. units)
[image:37.595.147.437.106.234.2]Distance from waist [z(z0)] Radial Distance [w(z)]
Figure 2.2.: 3D graph (left) of the intensity profile of a TEM00 beam, versus the distance from the waist along the propagation axis. As the beam propagates from the waist, its power spreads out. A normalised cross-section of the beam intensity at the waist is added on the left.
2.2. The Fabry-Perot Resonator
An optical resonator is an optical configuration within which monochromatic light, such as that from a laser, is confined. Optical resonators are also described as multiple beam interferometers. This is because the light contained within an optical resonator will interfere with itself as propagation through the optical configuration takes place. The simplest example of an optical resonator is the Fabry-Perot (FP) resonator, consisting of two mirrors between which light bounces back and forth.
Einc
Eref
Etran
Ecirc
Figure 2.3.: A Fabry-Perot Resonator. The incident field Einc is partially transmitted into the
cavity and contributes to the circulating field Ecirc. Some of this escapes back
through the input mirror to interfere with the promptly reflected component ofEinc,
and the resulting field is known as the reflected fieldEref. A portion of the circulating
field also escapes through the second mirror and is known as the transmitted field
Etran.
[image:37.595.167.433.482.530.2]Ecirc, and the field transmitted through the cavityEtran are quantified with respect to
the incident beam Eref by the following equations,
Ecirc
Einc
= it1
1−r1r2eiφe−αI TL
(2.10) Eref
Einc
= r1−r2(r 2
1+t21)eiφe−αI TL 1−r1r2eiφ
(2.11) Etran
Einc
= −t1t2e
iφ/2
1−r1r2eiφe−αI TL
(2.12) where
φ= 2kL (2.13)
is the phase shift imparted on the beam after a round-trip propagation through a cavity length L, k = 2π/λ is the wavenumber, r1 and t1 are the amplitude reflectivity and transmissivity of the input mirror, respectively, r2 andt2 are those for the other mirror, andRtranandRref are the complex reflection and transmission coefficients for the cavity.
The factor of exp(−αITL) describes the internal transmission loss, evenly distributed
throughout the whole cavity length. These equations follow the convention whereby transmission through a mirror imparts a π2 phase shift on the beam. They are derived by solving a set of self-consistent equations for the electric fields [Siegman ’86].
2.2.1. Cavity Loss
There are two aspects of cavity loss that are generally considered in the analysis of an optical resonator; internal transmission loss, and mirror loss.
Internal Transmission Loss
The internal transmission loss of a given medium is a measure of the power attenuation of the beam after propagating a given distance within the medium. In the absence of nonlinear interactions, attenuation is caused by two different mechanisms: scattering and absorption. Internal transmission loss is expressed as the imaginary part of the wavenumberk,
k= 2π λ +i
α
2 (2.14)
where λis the wavelength of the light, andα is the attenuation coefficient. Consider an electromagnetic wave of complex amplitude U(r), E0 represents the total electric field,
integrated over the spatial dimensions transverse to the direction of propagation, and has units of √W. Propagation by a distance L from its initial state expressed as a phase advance, φ=kL,
E =E0eikL=E0ei
2πL λ e−
α
2.2. The Fabry-Perot Resonator
where E is the total electric field at a longitudinal position L. The oscillating term de-scribes the periodic nature of the electromagnetic wave. The real term, which decreases as a function of distance, describes the amplitude attenuation of the beam. Using Equa-tion 2.15 and P = E∗E, α can be derived if the power attenuation over a particular
distance is known,
P(L) =P(L= 0)e−αL ⇒ α= ln
"
P(L= 0) P(L)
L#
(2.16)
Here,P(L) is the power of the beam after propagating a distanceL, andP(L= 0) is the initial power. In the cavity equations, the loss coefficient has a factor of 1/2, denoting amplitude attenuation. In this case it has been factored out by the round trip length 2L.
Mirror Loss
Reflection from the cavity mirrors generally cause most of the light to be reflected, some to be transmitted, and some to be lost from the system. As such, the coefficients associated with the mirror obey the following relation,
r2+t2+αm = 1 (2.17)
where αm is the mirror loss. It is hidden in the cavity equations by the information
provided in the reflection and transmission coefficients. 2.2.2. Cavity Resonance
The amplitudes of the respective fields have a dependence on the relationship between the length of the cavity and the wavelength of the light. For example, the circulating power is at its maximum when the exponential term is unity. This corresponds to a round-trip phase shift (2φ) of zero or an integer multiple of π, as the complex exponential has a period 2π. Substitution ofφ=nπ into Equation 2.13 gives the following,
L= nπ
2 λ (2.18)
solution. Figure 2.4 exhibits the vectors sum of the phasors for some different detunings. Because of the wavelength dependent resonance conditions, the FP cavity can be used as a spectrum analyser; only admitting light of a wavelength that satisfies the longitudinal resonance condition stated above. This fact is utilised in the control scheme introduced later in this chapter.
(a)
(c)
(b)
Figure 2.4.: Phasors representing the circulating electric fields of an optical resonator with differ-ent detunings. In (a) the cavity is detuned 140◦from resonance, and the circulating
power (red) is small. In (b) the cavity is closer to resonance, at a detuning of 15◦,
and exhibits some constructive interference. At this detuning the phasor has an am-plitude of approximately 1/√2, and a relative phase 45◦, compared to the resonant
cavity (c), where the phasors add constructively, and the circulating power is at its maximum.
2.2.3. Cavity Characterisation
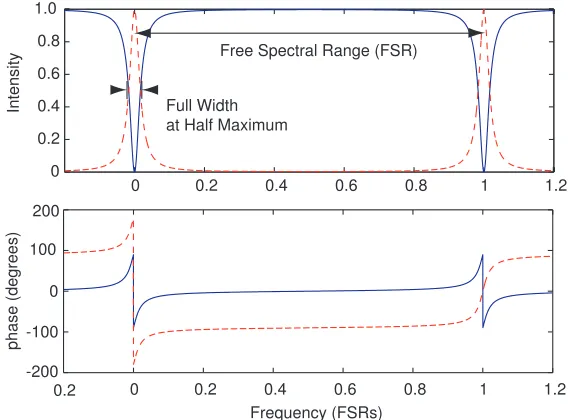
In the undertaking of an experimental characterisation of a FP cavity, there are two useful parameters that are often used; the Full-Width-at-Half-Maximum (FWHM) and the Free Spectral Range (FSR). These are shown in Figure 2.5. The FWHM is defined as the width of the resonance at half transmission. The FSR is defined as the spacing between cavity resonances. It can be derived from the cavity length,
FSR = c
2L (2.19)
2.3. Cavity Stability and Mode Matching
negligible. The equation for the FWHM is,
FWHM = 2FSR
1−(1−r1r2) 2
2r1r2
(2.20)
One FSR corresponds to a cavity length change of ∆L=λ/2
0 0.2 0.4 0.6 0.8 1 1.2
0 0.2 0.4 0.6 0.8 1.0
Intensity
0.2 0 0.2 0.4 0.6 0.8 1 1.2
-200 -100 0 100 200
Frequency (FSRs)
phase (degrees)
Free Spectral Range (FSR)
[image:41.595.149.433.209.419.2]Full Width at Half Maximum
Figure 2.5.: The amplitude (top) and phase (bottom) response of a Fabry-Perot cavity on re-flection (blue) and transmission (red dashed), as a function of frequency. Note the phase is not unwrapped for the transmitted field.
The term relating the FWHM and the FSR is known as the finesse,F,
F = FSR
FWHM (2.21)
and may be determined using an approximate version of Equation 2.202 ,
F = π
√r
1r2 1−r1r2
(2.22)
2.3. Cavity Stability and Mode Matching
A stable beam is set up within the cavity by matching the beam width w(z) and its radius of curvatureR(z) with that required at the input mirror to the cavity, at a known position z. This process is known as mode-matching, because it involves matching the parameters of the input beam to that of the cavity eigenmode. The cavity eigenmode can
2
be determined by using the ABCD3 formalism for describing the directional change of a paraxial ray, upon interaction with an optical element. Consider a paraxial beam with beam parameter q incident on an optical element. After interaction with this element, the beam has the new beam parameter q′. This transformation may be described by,
q′ = Aq+B
Cq+D (2.23)
where A,B,C, and D are the elements of the ABCD matrix describing the optic. A and B are dimensionless, while C and D have units of length and inverse length, respectively. Multiple cascaded elements may also be described by one ABCD matrix by taking the reverse product of the individual ABCD matrices.
M=
A B C D
=Mn. . .M2M1 (2.24)
In order to determine the cavity eigenmode, it is required that the beam reproduce itself after one round-trip in cavity. The ABCD matrix for round-trip propagation within a two-mirror cavity, starting at a point z, and propagating in the direction of the second mirror,
M=MzMR1MLMR2ML−z (2.25)
where MR2 is the matrix corresponding to reflection off the second mirror, MR1 is
the matrix corresponding to reflection off the input mirror, and ML−z is the matrix
representing the initial propagation to the second mirror, ML is the matrix representing
the distance between the mirrors, and Mzrepresents the distance from the input mirror
to the starting point in the cavity.
There are optical configurations that are unable to confine laser beams. A cavity with two convex mirrors is one such example; another is a cavity with two concave mirrors with excessive radii of curvature. The components of this matrix can be used in order to determine the stability criterion of the cavity,
|A+D|
2 ≤1 (2.26)
This inequality is used before mode-matching calculations are performed in order to determine whether a resonator of a particular length, with mirrors of given curvatures is capable of confining a Gaussian beam. Once the cavity is known to be stable, the components of the matrix are substituted into Equation 2.23. In order to solve this,q is substituted in for q′ and a self-sustaining equation results. This may be rearranged into
a quadratic equation for 1/q, with solution,
3
2.4. Polarisation
1 q =
D−A 2B ±i
1 |B|
s
1−
A−D 2
2
= 1
R(z) −i λ
πw2(z) (2.27)
This equation has two solutions. The allowed solution is such that the imaginary compo-nent is negative [Saleh, Teich ’91]. Then, by equating the real and imaginary compocompo-nents of each equation, R(z) and w(z) at a point zwithin the cavity are derived,
R(z) = 2B
D−A (2.28)
w(z) = λ π 1
2 |B|1/2
(1−[(A+D)/2]2)1/4 (2.29)
Once these beam parameters are determined, the input laser beam is then able to be matched to them. The requirement to determine the two beam parameters may be fulfilled with the use of at least two lenses prior to the cavity input mirror. This analysis can also be undertaken with the use of the ABCD matrix formalism utilising the matrices for thin lenses4. By measuring the beam width at a few points in an arbitrary yet known position, it is possible to determine whether the beam satisfies the required mode-matching conditions of a given cavity.
2.4. Polarisation
In order to understand polarisation, it is useful to treat the laser beam as a wave. Po-larisation of a beam refers to the transverse path traced out by end of the electric field vector of the paraxial wave as it propagates, as in Figure 2.6. As there are two degrees of freedom in the plane transverse to the beam, so is it convenient to express any arbitrary elliptical polarisation state as the sum of two basis states. These states are referred to as the transverse magnetic (TM) polarisation, and the transverse electric (TE) polarisation. These are defined with respect to the surface of an optical component of interest; the TE polarisation is defined as the component of the electric field vector that oscillates perpendicular to the optical surface, and the TM mode is defined as the parallel com-ponent. The total polarisation state is described by the amplitudes and relative phases of these basis polarisations. A phase offset of π2 between the two polarisations of equal amplitude expressed in this basis corresponds to the circularly polarised light shown in Figure 2.6. Linearly polarised light is observed when the two polarisation states have a common phase, or a phase offset of π. A laser beam incident on an optical interface at oblique incidence undergoes polarisation dependent reflection and transmission. For this reason it often desirable to tailor the polarisation of the beam to suit the experiment being undertaken. It is always possible to either alter the polarisation axis using waveplates, or to alter orientation of the optical device under scrutiny, such that a desired polarisation state is realised.
4
Figure 2.6.: Light exhibiting three different polarisations. Left-circularly polarised light (left), an arbitrary elliptical polarisation (centre) and linearly polarised light at 45◦ (right).
2.5. Modulation and Cavity Control
The necessity of introducing a control system into this experiment is a consequence of the high finesse cavity that is to be examined. Implementing a control system to achieve what are quite sensitive stability criteria can facilitate the examination of the cavity frequency response; the investigation of which being otherwise difficult and uncertain due to noise coupled into the cavity.
The experiment requires long term observation of the cavity when it is on resonance. The optical cavity in this experiment was expected to have a finesse of the order of 103, corresponding to a FWHM, in terms of cavity length, of λ/F2, where
λ
2. Hence, the FWHM corresponds to a detuning of the order of 10−10m. In order to confine the cavity length perturbations to within this regime, an active control system is required.
The length of the cavity can be controlled using a piezoelectric transducer (PZT). The PZT acts as an actuator, to which one of the mirrors is attached, expanding or contracting according to an applied voltage in order to change the cavity length. It has a range of approximately 1µm. It is driven by a proportional integral device (PID) [Yariv ’97], which uses information provided by an error signal in order to monitor the deviation of the cavity length from resonance.
The error signal must be zero at the desired operating point of the cavity, and anti-symmetric around it, in order to provide directionally relevant feedback for control. The PDH locking technique can be used to derive an error signal relevant to the control of optical cavities.
Once the cavity has been stabilised, the cavity may then be interrogated by injecting some component of the light as a swept sinusoid, in order to trace out the power trans-mission/reflection of the cavity.
2.5.1. Modulation
2.5. Modulation and Cavity Control
for the implementation of the PDH control scheme, while amplitude modulation is useful in characterising a stabilised high-finesse cavity.
Phase Modulation
Phase modulation at a particular frequency is achieved by periodically altering a beam’s optical path, effectively changing the phase with respect to time. A simple phase modu-lator can be created by altering the position of a mirror with which the beam interacts. However, for high frequency modulation, this is not practical and an electro-optic modu-lator (EOM) is used. This is a Pockel’s cell [Saleh, Teich ’91] to which a periodic electric field is applied. The refractive index of the Pockel’s cell varies linearly with the voltage of the electric field, which is a sinusoid at the desired frequency, changing the optical path periodically, as required. The effect of this is to couple a portion of the power of the carrier field into phase modulated sidebands. The time dependent complex envelope of the modulated beam is given by,
Emod=E0eiωt+iδsin(ωmt) (2.30)
whereE0is the amplitude of the electric field of the beam prior to modulation,Emodis the
electric field of the modulated beam,ωis the frequency of the carrier,ωm the modulation
frequency, andδthe modulation depth. The modulation depth corresponds to the portion of the power transferred to the sidebands. Equation 2.30 may be re-expressed, to first order, as
Emod=E0eiωt(J0(δ) +J1(δ) eiωmt−e−iωmt (2.31) which explicitly shows the first order sidebands which are found on either side of the carrier. In this case, sine phase modulation has been examined. A similar derivation of cosine phase modulation gives the same result with a phase offset of π2 in the sideband terms. Sine modulation and cosine modulation produce the same effect, and differ only by the arbitrary time at which t= 0 is defined.
Figure 2.8 exhibits a phasor representation of relationship between the carrier and the sidebands. This figure represents a snapshot in time. The plane transverse to the fre-quency axis is the complex plane. The length of a vector represents the amplitude of the electric field, and the angle in the complex plane represents its phase. Rotating the refer-ence frame at the frequency of the carrier, the lower sideband regresses in phase as time advances, while the upper sideband advances in phase. Hence, at any time, the amplitude quadrature (real) projections of these two phasors exhibit destructive interference, while the phase quadrature (imaginary) projections exhibit constructive interference.
Amplitude modulation
TE
TM
Pmax Pmin
Figure 2.7.: The polarisation vector after passing through an amplitude modulator and quarter-wave plate. The component of the vector transmitted through a polariser oriented along the x-axis changes periodically over time by electrically induced birefringence in the amplitude modulator.
birefringence. The effect of this is to alter the relative path lengths of the polarisation states as a function of time. Linearly polarised light is incident on the axes of birefringence at and angle of 45 degrees, such that half of the light in projected onto one of the birefringence axes, and half on the other. Half the light is retarded dynamically with respect to the other half, and the polarisation vector, referring to Figure 2.6, alters its position periodically. The light is then passed through a quarter wave plate, which is positioned prior to a polariser. The projection of the polarisation vector onto the axis of the polariser creates modulation of the transmitted beam amplitude, as this projection varies with time. The quarter-wave plate is positioned in order to orient the polarisation at 45 degrees to the polariser, such that the maximum change in projection is observed over a given modulation period. The time dependent complex envelope of an amplitude modulated beam is given by,
Emod=E0eiωt+δsinwmt (2.32)
This time, modulation of the real component of the exponential is observed. The first order approximation is,
Emod=E0eiωt(J0(δ) +J1(δ) ie−iωmt−ieiωmt (2.33) Here, the sidebands have a different phase relationship with respect to each other, such that their projections onto the phase quadrature always destructively interfere, while constructive interference is observed in the amplitude quadrature.
2.5.2. The Pound-Drever-Hall Locking Technique
2.5. Modulation and Cavity Control
Sine AM Cosine AM Sine PM Cosine PM
Re
Im
Freq.
(a) (b) (c) (d)
Figure 2.8.: Cosine and sine amplitude and phase modulation. The phase relationship between the sidebands and the carrier at one snapshot in time is shown. The phase of the sidebands are represented by their projection onto the imaginary axis, and their amplitude is the real-axis projection.
resonance frequency of the cavity, it obtains the cavity phase response. The sidebands are well outside the cavity resonance, and are promptly reflected, obtaining no phase shift. The relative phase shift between the sidebands and the carrier introduces an amplitude modulation component, or a beat pattern, which is able to be detected by the photodiode. The power reflected from the cavity at ωm is given by [Black ’00],
Pref = 2
p
PcPs{ℜ[F(ω)F∗(ω+ωm)−F∗(ω)F(ω−ωm)] cosωmt . . .
+ℑ[F(ω)F∗(ω+ωm)−F∗(ω)F(ω−ωm)] sinωmt}
(2.34)
whereF(ω) is the complex reflectivity of the cavity at a frequency ω, andPc and Ps are
the powers in the carrier and sidebands, respectively. A similar derivation can be made for the transmitted beam.
The signal is then detected, and mixed with a fraction of the signal driving the phase modulator, or the local oscillator. Hence, the detected signal is converted into two com-ponents, one at DC, and one oscillating at 2ωm. The relative phase of the local oscillator
and the detected signal determines the degree to which either the real or imaginary component is extracted. For a modulation frequency outside the cavity linewidth, the sidebands are totally reflected: F(ω±ωm ≈ −1), such that only the imaginary
compo-nent of Equation 2.34 survives. Therefore, it is necessary to adjust the demodulation phase such that this term is maximised, to ensure that the largest possible error signal is recovered. The mixed signal is then passed through a low-pass filter in order to eliminate the 2ωm component. That which remains is the error signal ǫ
ǫ=−2pPcPsℑ[F(ω)F∗(ω+ωm)−F∗(ω)F(ω−ωm)] (2.35)
The error signal is plotted in Figure 2.9. In the presence of a disturbance, the error signal assumes a nonzero value. It is sent to the servo, which uses the information to drive the PZT such that the error signal return to zero, corresponding to cavity resonance.
2.5.3. Cavity Interrogation with an Amplitude Modulated Beam