Using LCA data for agri-environmental policy analysis at sector
level
Schader C. 1, Nemecek, T.2, Gaillard, G.2, Sanders, J.1,3 and Stolze, M.1 1 Institute of Organic Agriculture (FiBL), Frick, Switzerland 2 Agroscope Reckenholz-Tänikon (ART), Zürich, Switzerland 3 Johann-Heinrich von Thünen Insitute (vTI), Braunschweig, Germany
E-Mail: [email protected]
Keywords: SALCA, FARMIS, positive mathematical programming, organic farming, environmental indicators, economic efficiency, life cycle assessment
Abstract
In times of limited agricultural budgets, the cost-effectiveness of the policies becomes a major decision criterion for policy reforms. For comprehensively assessing the effects of an agri-environmental policy agri-environmental data has to be scaled up to sector level, taking into account uptake rates and transaction costs of the policies. This paper discusses the general suitability of LCA data to be upscaled and combined with economic sector models. We present an approach that is based on the representative farm-group model FARMIS and the Swiss Agricultural Life Cycle Assessments (SALCA).
Exemplary results of the model for energy use are shown and most prominent issues in the context of this upscaling process are discussed. The paper argues that uptake-effect functions will not necessarily be linear. Furthermore, the combination of normative and positive datasets causes inconsistencies which need to be minimised. Finally, we argue differences between the life-cycle view and the economist’s perspective lead to difficulties in the interpretation of the results. Nevertheless, this approach may deliver plausible results and can supplement ecological site-specific studies in the evaluation of agri-environmental policies.
Introduction
The Swiss agricultural policy has been implementing a progressive environmental agenda since the introduction of direct payments in 1993. Full cross-compliance was introduced already in 1998 and additional ecological services were stimulated by targeted agri-environmental payments, including payments for organic farm management. Against the background of a limited budget, the considerations on cost-effectiveness play a fundamental role for a further development of the direct payment system (Badertscher, 2004). Therefore, from a policy-maker’s perspective, it is essential to have reliable data about costs and effects of single policy measures or policy mixes.
Up to now, studies analysing environmental effects at sector-level are relatively scarce, though there are recent efforts from the scientific and the policy side to bridge this gap using economic models (Britz and Heckelei, 2008). However, to link these models to environmental indicators is delicate because environmental effects are difficult to aggregate and requires reliable environmental data that have been generated in a consistent framework. The life-cycle assessment approach is one of the most widespread approaches, and in Switzerland, agricultural production has been analysed extensively (Nemecek et al., 2005).
Therefore, this paper pursues the following objectives:
- To present an approach linking life-cycle assessment data to an economic sector model
- To highlight essential issues in the upscaling of LCA data to sector level
In this paper, firstly, the specific methodological approach used in this study is presented. Secondly, the upscaling process is demonstrated by calculating energy use at agricultural sector-level based on LCA data. Thirdly, the main challenges of the upscaling procedure are raised and the applicability of such a model discussed.
Modelling approach and conceptual considerations
In this section, we firstly delineate the general principles of the economic sector model FARMIS and then describe the way LCA data is linked to the model.
The economic sector model FARMIS
Our analytical approach consists of an economic sector model linked with life-cycle assessment data. The economic model FARMIS is a sector-consistent static-comparative farm group model, which can be used for the assessment of policy impacts at sector level. The model is primarily based on farm accountancy data from the Swiss FADN distinguishing between 29 plant production activities and 15 animal production activities (Sanders et al., 2008).
Employing Positive Mathematical Programming (PMP) (Howitt, 1995), FARMIS optimises the objective function (1) under consideration of restrictions that express the limitations in economic resources such as land, labour and capital as well as political restrictions such as the Swiss cross-compliance regulation.
( 1 )
n X X X LAND r V r U r PX dp X c Y p Z
v i i i w
niw ni k nik ni k nik nik l nl nl nv nv nu
i k i k u
nu nik nik nik nik njk j k njk n ∀ − − − − − − + − =
∑
∑
∑
∑
∑
∑
∑∑
∑∑
∑∑
∑
∑∑
2 2 21 0.5 5 . 0 max ω ω δ
Ynjk, Xni, PXni, Unu, Vnv, LANDnl≥ 0
where:
Indices:
n = index for farm groups
i = index for production
activities
j = index for output products
k = index for intensity levels
w = index for intensity levels
≠ w
l = index for land type
u = index for labour
v = index for fertilisers
Variables:
Z = objective (profit
per farm group)
Y = sales of
agricultural products
X = level of activities
PX = level of activities
eligible for direct payments
U = level of labour
input/requirements
V = level of fertiliser
input/requirement LAND = level of rented UAA
Parameters:
p = prices for agricultural
products
c = activity-specific costs
dp = activity-specific
direct payments
r = variable costs
δ = parameter for linear
hidden cost
ω = parameters for
The cost-effectiveness of policy measures on sector level can be assessed quantitatively with this economic modelling approach taking into account uptake rates, environmental effects, and the public expenditure as three major determinants of a successful agri-environmental measure. In this paper we focus on the question of measure environmental effects at sector level using LCA data.
Determination of environmental effects at agricultural sector level
The most frequently studied issue about agri-environmental policies is their effectiveness in achieving policy objectives, i.e. minimisation of negative environmental impacts of agriculture (e.g. Stolze et al., 2000; Bengtsson et al., 2005). There are different types of environmental impact assessment used, one of the most relevant approaches is the ISO-standardised life-cycle assessment approach (Wood, 2003).
In Switzerland, extensive life-cycle assessments of agricultural activities (Swiss Agricultural Life-Cycle Assessments (SALCA)) have been carried out (Nemecek et al., 2005) supplemented by data from the ecoinvent database (Frischknecht et al., 2007). SALCA data has been calculated for the most relevant impacts of agricultural activities that are typical for Swiss agriculture. Data for farming activities is differentiated by farming system (integrated and organic farming), region (valley, hill and mountain region) providing a sufficient detailed basis for the model analysis in Switzerland. Furthermore, the environmental impacts of the most important agri-environmental measures are covered. Of the possible impact categories, direct and indirect energy use, nitrogen and phosphorus eutrophication and species biodiversity have been integrated as impact indicators for each activity and management intensity in FARMIS.
There are both direct, i.e. on-farm use of primary energy, and indirect energy use components, i.e. inputs for agricultural production, which themselves require the input of primary energy for their production in agriculture. For the modelling of energy use, we based our analysis on ecoinvent and SALCA data (Nemecek et al. 2005). Additional data was gathered for activities that were not explicitly covered by SALCA or ecoinvent. Both direct (i.e. fuel, gas, electricity) and indirect energy use (i.e. seeds, plant protection, fertiliser, feedstuffs, machines, buildings) were modelled.
Within CH-FARMIS, there is a normative link to the SALCA eutrophication data. As the basis of the SALCA eutrophication data, nitrogen and phosphorus models calculate eutrophication potential in dependence of key factors like season and types of application (Prasuhn, 2006; Richner et al. 2006). Simultaneously, FARMIS calculates nutrient balances, independent of seasonal differences of application, according to the fertiliser purchase of farm groups, based on FADN data. The model allows a comparison between the results of the eutrophication potential and the nutrient balance. The parallel usage of a pressure and a state indicator for eutrophication allows mutual comparison and verification of the results of both procedures.
Besides eutrophication effects, biodiversity effects belong to the most studied environmental impacts of agriculture (e.g. Bengtsson et al., 2005). As there are the general relations of management practices and intensity of agricultural practices (Faucheux and Noël, 1995), there is a principal possibility to take into account biodiversity impact within aggregated economic models without referring to detailed site-specific characteristics (Mattison and Norris 2005).
Exemplary calculations of energy use at agricultural sector-level
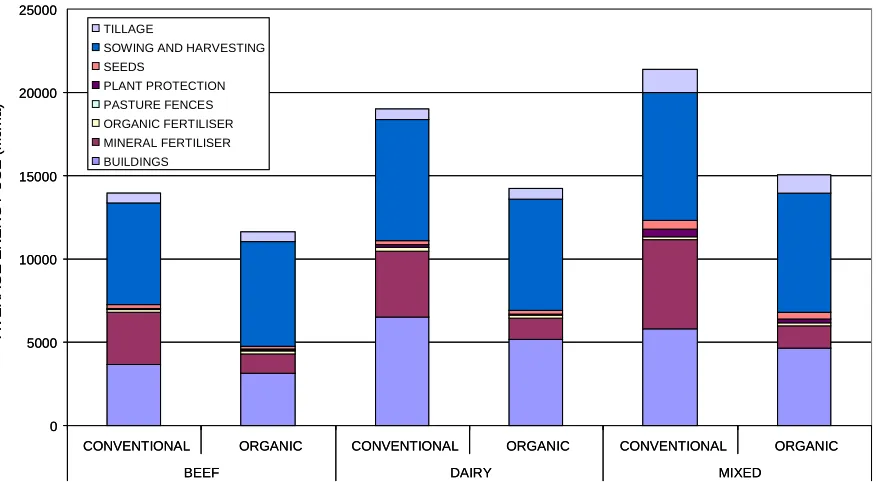
On the basis of the methodical descriptions of the approach, the average energy use per ha has been calculated for the base year 2000/01. The calibration procedure of FARMIS ensures that the area covered by different crops exactly matches the real situation in the base year. In the calculations, dairy farms (FAT-Type 21) (Meier, 2005), beef farms (FAT-Type 22 and 23), and mixed farms (FAT-Type 51, 52, 53, and 54) were considered (Fig. 1).
The presented calculations include the indirect energy use in seeds, plant protection, fertilisation, and buildings (for machines and stables) and direct energy use such as on-farm machinery use and other on-farm processes. In-stable processes like feeding, milking and removal of manure are not considered in the presented results. Therefore, compared to similar studies (Mack et al., 2007), the total figures seem to underestimate the average energy use per ha by about 10-30%, depending on the farm group. Furthermore, the differences between organic and conventional farm group are potentially underestimated, because purchased fodder has not been taken into account.
Fig 1 shows that the main share of energy use lies within sowing and harvesting (including transport and drying) as well as in farm buildings (including stables). For conventional farms, also fertilisation is responsible for a major share of energy use. Seeds are negligible for dairy and beef farms but have a visible share on mixed farms. Tillage also contributes more to energy use on mixed farms than on dairy or beef farms.
0 5000 10000 15000 20000 25000
CONVENTIONAL ORGANIC CONVENTIONAL ORGANIC CONVENTIONAL ORGANIC
BEEF DAIRY MIXED
TILLAGE
SOWING AND HARVESTING SEEDS
PLANT PROTECTION PASTURE FENCES ORGANIC FERTILISER MINERAL FERTILISER BUILDINGS
AV
ER
AG
E
EN
ERG
Y
USE
(MJ/
h
a
)
0 5000 10000 15000 20000 25000
CONVENTIONAL ORGANIC CONVENTIONAL ORGANIC CONVENTIONAL ORGANIC
BEEF DAIRY MIXED
TILLAGE
SOWING AND HARVESTING SEEDS
PLANT PROTECTION PASTURE FENCES ORGANIC FERTILISER MINERAL FERTILISER BUILDINGS
AV
ER
AG
E
EN
ERG
Y
USE
(MJ/
h
a
[image:4.595.71.509.355.596.2])
Fig. 1: Average energy use per ha in the base year differentiated by farm type and farming system
Besides the estimation of average sector values, shares of different farming systems and regions on the energy use at sector level can be calculated. So, farming systems, farm types and regions can be compared by means of representative data. Moreover, reactions of the different farm types to agri-environmental policy can be modelled.
The environmental indicators can be related to almost all financial indicators, which are calculated by the model, e.g. the agricultural income or sector-level added value.
Discussion
Upscaling the environmental effects to sector level
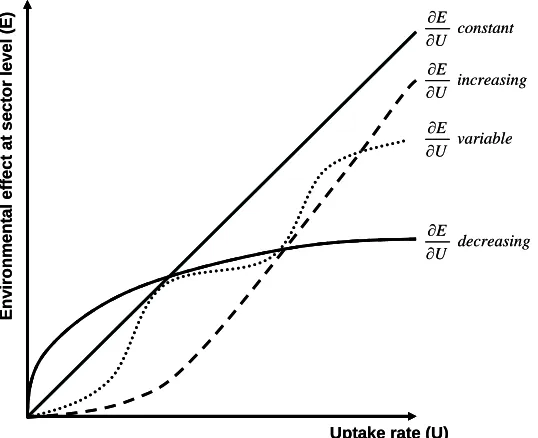
In most of the studies, the environmental effects of farming types are studied at field or farm level. Only few studies (e.g. Julius et al., 2003; Schmidt and Osterburg, 2005; Pufahl, 2007) conceptually combine the effects of the agri-environmental policies at farm level with the achieved uptake, which necessarily has to be done in order to analyse the sector level effects of policies. The basic issue for upscaling from field or farm level to sector level is whether a linear relation between uptake rates and effects can be assumed. The potential reasons for non-linearity, i.e. decreasing, increasing or variable marginal effects at sector level can be of different nature:
• Deadweight effects and self-selection bias: Deadweight effects occur for the first hectares under a policy because there is empirical evidence that those farms take up a policy where there is no or almost no change in management necessary (Henning and Michalek, 2008).
• Regional differences and differences between farm types: an agri-environmental measure will have a larger impact, if it is implemented on a specialised cash crop farm than on an already extensively managed mixed farm (Pufahl, 2007).
• 1st Gossen Law (law of decreasing marginal utility): The more of a good is consumed, the lower the gains in utility are. Although this law is developed for commodities, the relationship can be observed also for non-commodities. For example, the utility of a further decrease in nitrate content in drinking water may be high, if the content exceeds a set threshold, but it may be low, if the level of nitrate is already low (Schader et al., 2007).
• Minimum ecological requirements: contrary to the 1st Gossen Law, there might also be cases in which marginal utility increases with higher uptake. Sometimes, a minimum of landscape complexity must be reached, before any additional positive effect on species biodiversity can be achieved due to the uptake of agri-environmental measures. Although this effect is locally specific, it can be argued that it leads to a different effect curve at sector level (Roschewitz et al., 2005).
Possible relations between uptake (U) and cumulative environmental effects (E) are shown in Fig. 2. The marginal environmental effect at sector level (
U E
∂
∂ ) may be constant, increasing, variable or
decreasing. The shape of the curve is different for different environmental objectives and indicators. Due to data constraints, the exact course of the uptake-effect curve cannot be observed empirically. However, using econometric models the curves can be estimated, provided that individual farm data on the environmental impacts is available (Frondel and Schmidt, 2005).
Env ironm ent a l e ff ect at se ct or le v e l (E)
Uptake rate (U)
constant U E ∂ ∂ increasing U E ∂ ∂ variable U E ∂ ∂ decreasing U E ∂ ∂ Env ironm ent a l e ff ect at se ct or le v e l (E)
Uptake rate (U)
[image:5.595.76.345.525.744.2]constant U E ∂ ∂ increasing U E ∂ ∂ variable U E ∂ ∂ decreasing U E ∂ ∂
Conceptual discrepancy between the LCA approach and the economic perspective
In sector-level calculations, we face a conceptual difficulty due to the combination of different system borders: In economic calculations, e.g. for input-output tables, monetary flows are described between sectors. Each sector is accounted for what comes in from other sectors and what goes out to other sectors. The LCA approach, however, has different system borders: Because it is product-based, all inputs and processes that were necessary to produce a certain product are charged, regardless of whether these processes occur in the agricultural sector or not. This means, for instance, that the production of one ton of wheat the production of mineral fertilisers and pesticides used have to be taken into account from a life cycle perspective, whereas in economic calculations production of fertilisers would be clearly allocated to the respective industry sector. This problem becomes even more sophisticated, if we include supranational monetary flows, which are becoming more important also in the agricultural sector (e.g. imported soybean-based fodder from Brazil). We argue that it is plausible to combine these two views for the purpose of agri-environmental policy evaluation, although a purely macro-economic perspective cannot be taken.
Linking normative and positive datasets
Despite the, in general, similar structure of the data sets of FARMIS and SALCA, data consistency problems occur when bringing together the two tools. Both FARMIS and SALCA consist of various datasets that are partly of strictly positive nature, and partly supplemented with standard data. FARMIS employs a positive approach, claiming to represent the reality “as it is”, therefore fertilisation, for instance, is calculated in FARMIS via FADN data, that is the actual expenses of a sample of representative farms for fertilisers. On the basis of fertiliser prizes and fertiliser needs for different crops, FARMIS calculates farm-group specific fertiliser uses.
Linked to SALCA data, which in the case of fertilisation normatively assumes, applications according fertiliser recommendations, we get two different assumptions of fertiliser use for the economic calculations on the one hand and for the ecological impacts on the other. The only way to generate consistency would be to completely decide to opt either for the normative or the positive way. Opting for the completely normative way means giving up the positive character of the model, which is a major advantage of FARMIS. At the same time, opting for the completely positive way is not feasible because for some data components, normative data simply are the more realistic data source due to the absence of positive data in the FADN dataset. For instance, the number of machines used for different crops may be more realistically estimated using purely normative assumptions than on the respective FADN accounts (e.g. depreciation). Therefore, since both ways have their disadvantages, it makes sense to compromise and neglect dataset consistency at the same time. We argue that for each component of each environmental indicator the data source with the least uncertainties has to be opted for. However, this procedure requires to transparently point out the assumptions behind the models and to validate the calculations within a transdisciplinary team of involved scientists.
Conclusions
The preliminary results presented above demonstrate the general feasibility of using LCA data within sector models. Combining LCA data with economic calculations at sector level leads to plausible results for the indicator energy use. As highlighted above, however, integrating other indicators in the model leads to conceptual difficulties. Effects on biodiversity, for instance, may not be upscaled to sector level linearly without introducing further assumptions. We found another major problem is the different setting of system boundaries in economic and environmental analyses. Furthermore, the linkage of different datasets partly of normative, partly of positive nature requires making further assumptions.
Against the background of the highlighted problems we conclude that using LCA data for agri-environmental policy analysis at sector level requires:
• the combination of multiple datasets and the minimisation of inconsistencies between them by harmonising assumptions
• particular transparency regarding the assumptions made and the system boundaries drawn, as economists and environmental scientists’ have differing ways of drawing boundaries
Despite these requirements, the described approach allows a comprehensive evaluation of the modelled agri-environmental policies. Not only the effects of single agri-environmental policies, but also interactions between policies and policy mixes can be modelled and analysed. Thus, we are confident the presented approach will deliver plausible results and can supplement ecological site-specific studies in the evaluation of agri-environmental policies.
References
Badertscher, R. (2004). Evaluation of Agri-environmental Measures in Switzerland. In: Organisation for Economic Co-operation and Development (OECD) (Ed.), OECD Workshop on Evaluating Agri-environmental Policies, 6-8 December 2004, Paris.
Bengtsson, J., Ahnström, J. and Weibull, A.C. (2005). The effects of organic agriculture on biodiversity and abundance: a meta-analysis. Journal of Applied Ecology 42: 261-269.
Britz, W. and Heckelei, T. (2008). Recent developments in EU Policies - Challenges for partial equilibrium models, 107th EAAE Seminar Modeling of Agricultural and Rural Development Policies, January 29th - February 1st, 2008, Sevilla, Spain, http://ageconsearch.umn.edu/bitstream/6315/2/pp08br01.pdf. Faucheux, S. and Noël, J.-F. (1995). Ökonomie natürlicher Ressourcen und der Umwelt. Paris: Metropolis
Verlag.
Frischknecht, R., Althaus, H.-J., Doka, G., Dones, R., Heck, T., Hellweg, S., Hischier, R., Jungbluth, N., Nemecek, T., Reblitzer, G. and Spielmann, M. (2007). Overview and methodology. Final report ecoinvent v2.0 No.1. Duebendorf, Switzerland: Swiss Centre for Life Cycle Inventories.
Frondel, M. and Schmidt, C.M. (2005). Evaluating environmental programs: The perspective of modern evaluation research. Ecological Economics 55(4): 515-526.
Henning, C. and Michalek, J. (2008). Ökonometrische Methoden der Politikevaluation: Meilenstein für eine sinnvolle Agrarpolitik der 2. Säule oder akademische Fingerübung? Agrarwirtschaft 57(3): 232-243. Howitt, R., E. (1995). Positive mathematical programming. Journal of Agricultural Economics 77(2): 329-342. Jeanneret, P., Baumgartner, D., Freiermuth, R. and Gaillard, G. (2006). Méthode d'évaluation de l'impact des
activités sur la biodiversité. Zürich-Reckenholz: Agroscope Reckenholz Tänikon (ART),
http://www.art.admin.ch/themen/00617/00622/index.html?lang=de.
Julius, C., Moller, C., Osterburg, B. and Sieber, S. (2003). Indicators for a sustainable land use in the "Regionalised Agricultural and Environmental Information System for Germany" (RAUMIS).
Agrarwirtschaft 52(4): 184-194.
Mack, G., Ferjani, A., Kränzlein, T. and Mann, S. (2007). Wie ist der Energie-Input der Schweizer Landwirtschaft aus ökonomischer und ökologischer Sicht zu beurteilen?, 47th GEWISOLA annual conference: Changing Agricultural and Food Sector, 26-28 September 2007, Freising/Weihenstephan. Meier, B. (2005). Analyse der Representativität im schweizerischen landwirtschaftlichen Buchhaltungsnetz.
FAT-Schriftenreihe 67. Tänikon: Agroscope FAT Tänikon.
Nemecek, T., Huguenin-Elie, O., Dubios, D. and Gaillard, G. (2005). Ökobilanzierung von Anbausystemen im Schweizerischen Acker- und Futterbau. FAL Schriftenreihe No. 58. Reckenholz: Eidgenössische Forschungsanstalt für Agrarökologie und Landbau (FAL).
Pufahl, A. (2007). Evaluating the effects of farm programs: Results from propensity score matching. Working Papers wuwp113. Vienna: Vienna University of Economics and B.A., Department of Economics,
http://www.wu-wien.ac.at/inst/vw1/papers/wu-wp113.pdf.
Sanders, J., Stolze, M. and Offermann, F. (2008). Das Schweizer Agrarsektormodell CH-FARMIS.
Agrarforschung 15(3): 139-143.
Schader, C., Stolze, M. and Moschitz, H. (2007). Case Study on Regional Differences in Social Demand for Commodity and Non-Commodity Concerns. EU-MEA-Scope Public Deliverable 6.3, online at
http://www.zalf.de/home_meascope/website/publications/index.htm Institute of Organic Agriculture (FiBL), Frick, Switzerland.
Schmidt, T. and Osterburg, B. (2005). Aufbau des Berichtsmodults 'Landwirtschaft und Umwelt' in der Umweltökonomischen Gesamtrechnung. In: Bundesforschungsanstalt für Landwirtschaft (FAL) (Ed.),
Agrarberichte des Bereichs Agrarökonomie. Braunschweig und Wiesbaden: Bundesforschungsanstalt für Landwirtschaft (FAL), Statistisches Bundesamt.
Stolze, M., Piorr, A., Häring, A.M. and Dabbert, S. (2000). Environmental impacts of organic farming in Europe. Organic Farming in Europe: Economics and Policy, Vol. 6, Stuttgart-Hohenheim.