UNIVERSITI TEKNIKAL MALAYSIA MELAKA
EFFECTIVE IMPLEMENTATION OF PROCESS CAPABILITY
INDEX C
PKIN MINIMIZING REJECT RATE FOR BATCH
PRODUCTION
This report submitted in accordance with requirement of the Universiti Teknikal Malaysia Melaka (UTeM) for the Bachelor Degree of Manufacturing Engineering
(Manufacturing Management) with Honours.
by
AZWARNI BINTI MOHAMAD
DECLARATION
I hereby, declared this report entitled “Effective Implementation of Process Capability Index Cpk in Minimizing Reject Rate for Batch Production” is the results of my own
research except as cited in references.
Signature : ………
Author’s Name :…AZWARNI BINTI MOHAMAD…
APPROVAL
This report is submitted to the Faculty of Manufacturing Engineering of UTeM as a partial fulfillment of the requirements for the degree of Bachelor of Manufacturing Engineering (Manufacturing Management) with Honours. The member of the supervisory committee is as follow:
ABSTRACT
Process Capability Index (Cpk) has been used at some manufacturing companies to
enable them to exactly monitor and getting feedback from process capability of their production department. This report includes the effective implementation of Process Capability Index (Cpk) in minimizing reject rate for batch production. Hicom
Engineering Sdn Bhd, which located in Shah Alam, Selangor was selected for this project. This project also covered the present application of process Statistical Process Control (SPC) that applied at Hicom Engineering Sdn Bhd. SPC is used for data-gathering and to investigate problem the trends over time for the automotive part in the production line of this company. This project is also aimed to design and recommend new software for calculating Cpk called Operator Friendly Software (OFS). This software
ABSTRAK
Syarikat pembuatan telah menggunakan ‘Process Capability Index’ (Cpk) dalam
membuat penilaian dan mendapatkan tindak balas dalam proses pengeluaran produk mereka. Laporan ini melibatkan tentang keberkesanan penggunaan Cpk dalam
mengurangkan kadar produk yang rosak atau produk yang tidak memenuhi keperluan pelanggan dalam suatu proses pengeluaran. Hicom Engineering Sdn Bhd yang terletak di Shah Alam Selangor dipilih sebagai lokasi untuk menjalankan projek ini. Projek ini merangkumi pemerhatian tentang penggunaan ‘Statistical Process Control’ (SPC) yang digunakan oleh Hicom Engineering Sdn Bhd pada masa sekarang. SPC ini digunakan dalam pengumpulan data dan penyelidikan masalah yang timbul dalam proses pengeluaran syarikat ini. Projek ini juga bertujuan untuk mereka dan mencadangkan satu perisian untuk pengiraan Cpk iaitu ‘Operator Friendly Software’ (OFS). Perisian ini
DEDICATION
ACKNOWLEDGEMENT
I would first like to thank for my official supervisor Mr Abdul Rahman Bin Mahmood for his constant guidance, motivation and support. He will always be a role model for me and a source of inspiration. Special thanks to all staff at of Hicom Engineering Sdn Bhd especially to Mr Joizuddin Bin Omar who have given many information and guide to me. I appreciate the help of all of those individuals at who had discussions with me about the applicability of my project to their company.
TABLE OF CONTENT
Abstract i
Abstrak ii
Dedication iii
Acknowledgement iv Table of Content v
List of Tables viii
List of Figures ix
List of Abbreviations x
1. INTRODUCTION
1.1 Background 1 1.1.1 History of Process Capability Index (Cpk) 1 1.1.2 The Important of Project 3 1.1.3 Company Background 3 1.2 Problem Statement 4
1.3 Objective 5
1.4 Scope 5
2. LITERATURE REVIEW
2.2.4.1Control Charts 12 2.2.4.2Check Sheets 16 2.2.4.3 Problems and Difficulties in the Implementation of SPC 17 2.3 Process Capability 18 2.3.1 The Types of Process Capability 19 2.3.2 The Process Capability Analysis 19 2.3.2.1 The Process Capability Analysis Process 22 2.3.3 Requirement of Process Capability 25 2.3.4 Improving the Process Capability 25 2.3.5 The Engineering Specification Pitfall 26 2.4 Process Capability Indices 27 2.4.1 The Potential Process Capability Index (Cp) 27
2.4.2 The Process Capability Index (Cpk) 29
2.4.3 Limitation of Capability Index 31
3. METHODOLOGY
3.1 Planning of the Project 32 3.1.1 Selection of Product for Research 34 3.1.2 Observation of Presentation Quality Control System (QC) 34 3.1.3 Identification of Problems 34 3.1.4 Collection of Theories Concept and Ideas 34 3.1.5 Designing and Introduction of a New System 35 3.1.6 Data Collection 35 3.1.7 Implementation and Verification of Effectiveness of the New System 35 3.1.8 Data Analysis 36 3.1.9 Conclusion and Recommendations 36
4. DATA ANALYSIS, RESULT AND DISCUSSION
4.1 Introduction 37 4.2 Data Recording on Brake Disc Specification 38
4.3 Data Collection 40 4.4 Data Analysis 42 4.4.1 Process Capability Study Steps 42 4.4.2 Potential Causes of High Rejection Rate 44 4.4.3 Types of Defect 44 4.4.4 Process Capability Analysis from Control Charts 44 4.4.4.1 Central Tendency 45 4.4.4.2 Variability 45 4.4.4.3 Control Chart Interpretation 45 4.4.5 Process Capability Analysis from Process Capability Index (Cpk) 47
4.4.5.1Design and Introduction of Operator Friendly System (OFS) 47 4.56 Results 48 4.5.1 Survey of Implementation of Operator Friendly Software (OFS) 55 4.6 Discussion 57 4.6.1 Interpretation of Cpk 58
4.6.2 Quality Improvement using Operator Friendly System (OFS) 59
5. CONCLUSION AND RECOMMENDATION
5.1 Conclusion 62 5.2 Recommendation 63 5.3 Future Scope 64
LIST OF TABLES
2.1 Definitions of Quality 8 2.2 Process Capability Improvement 26
LIST OF FIGURES
2.1 Basic Function of SPC 12 2.2 Control Limits are Based on the Sampling Distribution 13 2.3 Calculation in X Bar and R Charts 14 2.4 Example of Control Chart 15
2.5 Example of Check Sheet 16
2.6 Case I: Process Variability just Matches Specification 20 2.7 Case II: Process Variability Well within Specifications 21 2.8 Case III: Process Variability Exceeds Specifications 22 2.9 Centered Process Width 28
2.10 Off-Center Process Width 29 3.1 Flowchart of the Project 33
4.1 Models of Brake Disc Product 38
4.2 Dimensions Specification of Brake Disc 39
4.3 Example of X Bar and R Chart 46
4.4 Cpk Chart for Dimension of Brake Disc (Section 1) 48
4.5 Cpk Chart for Dimension of Brake Disc (Section 2) 49
4.6 Cpk Chart for Dimension of Brake Disc (Section 3) 50
4.7 Cpk Chart for Dimension of Brake Disc (Section 4) 51
4.8 Cpk Chart for Dimension of Brake Disc (Section 5) 52
4.9 Cpk Chart for Dimension of Brake Disc (Section 6) 53
4.10 Cpk Chart for Dimension of Brake Disc (Section 7) 54
4.11 Graph Average Time for Manually and OFS 56
4.12 Sample of Present Inspection Sheet 60
LIST OF ABBREVIATIONS
Cp - Potential Process Capability Index
Cpk - Process Capability Index
OFS - Operator Friendly Software
QA - Quality Assurance
QC - Quality Control
SPC - Statistical Process Control
SQC - Statistical Quality Control
TQC - Total Quality Control
CHAPTER 1
INTRODUCTION
This section included the introduction of Process Capability Index (Cpk) and
identification of problem statement, objective and scope.
1.1 Background
1.1.1 History of Process Capability Index (Cpk)
Process Capability Index has been used in manufacturing industry as decision making tools and to provide quantitative measures on process potential and performance. Process Capability Index is first introduced by Juran, the values of the index is estimated from a sample and should be qualified. Qualification of an estimate is provided in a form of a confidence interval for the estimate. In process improvement efforts, the Process Capability Index or Process Capability Ratio is a statistical measure of process capability. Specifically on the ability of a process to produce output within specification limits. The concept of process capability only holds meaning for processes that are in a state of statistical control.
The Process Capability Index:
1. Considers only the spread of the characteristic in relation to specification limits 2. Assumes two-sided specification limits
The product can be bad if the mean is not set appropriately. It is computed by finding the difference between each of the specification limits and the mean, identifying the smaller difference, and dividing that difference by three standard deviations of the process. The process performance index takes account of the mean (µ) and is defined as:
Cpk = min [(USL - µ)/3σ or (µ - LSL)/3σ]
The process performance index can also accommodate one sided specification limits
1. For upper specification limit:
Upper specification – Process mean
3σ
Cpk = (USL - µ)/3σ
2. For lower specification limit:
Process means – Lower specification
3σ
Process Capability Index is constructed to express more desirable capability with increasingly higher values. The higher of Cpk value, the more capable the process is in
meeting the customer requirement. A good target value for Cpk is 1.33, a more desirable
Cpk is 2.00 and an excellent Cpk value is 5.00 or greater.
1.1.2 The Importance of Project
The important of this project are:
1. To know whether the process is stable or not.
2. To identify the main factor that causes the problem in batch production.
3. To illustrate the use of process capability analysis in a production of the product. 4. To take an action to solve the problem in production and automatically can
improve the quality of product.
1.1.3 Company Background
As one of Malaysia’s leading manufacturers of cast-iron automotive components, Hicom Engineering Sdn Bhd have a strong commitment to constantly improve the quality of their products. The ISO/TS 16949 certification has only enhanced their commitment. Hicom Engineering Sdn Bhd utilizes the latest technological advances in support of their commitment to continuous improvement and provides the highest quality castings.
1.2 Problem Statement
Process Capability Index (Cpk) is being used in manufacturing industry. It is employed to
provide an indication of the variability associated with a process and how a process has conformed to its specification. However, normally evaluation of Process Capability Index (Cpk) is not continuously implemented in the production. It is only used during test
cut when approving a new product or after major repair was done to any section of production line.
In Hicom Engineering Sdn Bhd, as other companies’ normal production standard, reject parts do occurs in their batch production. The reject parts are normally identified at the end of production line and this is too late to make any rectification to the process setting. This part reject occurs because of some factors such as the material used, in-line measurement, machine problem, and personnel involved in producing the parts. Ultimately, this Process Capability Index (Cpk) concept will be used to tremendously
1.3 Objective
1. To study the present application of process Statistical Process Control (SPC) and apply the implementation of Process Capability Index (Cpk) at Hicom
Engineering Sdn Bhd.
2. To design and recommend Operator Friendly Software (OFS) for evaluation of product quality, which is the process capability, that can be used easily by production and quality control operators.
3. To minimize reject rate and improve the quality of product for batch production in Hicom Engineering Sdn Bhd using Cpk as tool.
1.4 Scope
The scope of this project is to study the present application of Statistical Process Control (SPC) and apply the implementation of Process Capability Index (Cpk) at Hicom
Engineering Sdn Bhd. It uses in data-gathering and to investigate the problem trends over time for the automotive part in the production line of this company. This project will merely focus on batch production of Brake Disc production line. A batch production is a manufacturing method where products are produced in batches, as opposed to a continuous production process, or a one-off production. The primary characteristic of batch production is that all components are completed at a workstation before they move to the next one. In this project, a new Operator Friendly Software (OFS) using the Microsoft Excel Software will be designed and recommended for evaluating product quality that can be used easily by production and quality control operators.
CHAPTER 2
LITERATURE
REVIEW
This chapter covers the literature review in the field of Process Capability Index that is gathered from some of resources such as journals, articles and books. From this finding, all the theory concepts and ideas relate to this project are gathered and summarizes in this chapter.
2.1 Introduction of Quality Concept
Quality is referred to the ability of a product to consistently meet or exceed customer requirements or expectations. Quality plays an important role in manufacturing organizations in gaining competitive advantage. Today’s consumer markets experience an ever increasing demand for better quality products. It is widely accepted that the quality of a product is generally thought of as the ability to fulfill or conform to customer needs.
Quality has been defined differently by different people. From these definitions, it can be seen that the emphasis of quality has been broadened to focus on customers’ needs. Now, it is quite common for organizations to publicize their slogans such as “Customer First” and some have even established customer care units just to provide the voice of customer. Actually, the customers want the solutions for their needs and not only quality product.
According to Dr. Joseph M. Juran, the costs of quality can be classified into four categories which are:
1. Internal Failure Costs: these costs are are defined by Dr. Juran as the costs incurred with defective products, inclusive of scrap, rework, and downtime. 2. External Failure Costs: these costs are incurred after the product has left the
company and is received by the customer, inclusive of warranty costs, complaints, returned products, and rectification of the products
3. Appraisal Costs: this classification encompasses the costs associated with finding the faulty product before it leaves the company, such as inspection and test, incoming inspection tests for vendors or supplier materials, and sustaining accurate and precise test and evaluation equipment.
4. Prevention Costs: Dr. Juran identified these costs as those resulting from keeping the defects to a minimum, including statistical process control, planning and organizing for quality, and training.
There are several key words stand out in this definition:
1. Customer determination: Only a customer can decide if and how well a product or service meets his or her needs, requirements, and expectations.
2. Actual experience: The customer will judge the quality of a product or service not only at the time of purchase but throughout usage of the product or service. 3. Requirements: Necessary aspects of a product or service called for or demanded
by the customer may be stated or unstated, conscious or merely sensed.
4. Technical operational: Aspects of a product or service may be clearly identified in words by the consumer.
[image:23.612.107.548.398.649.2]5. Entirely subjective: Aspects of a product or service may only be conjured in a consumer’s personal feelings.
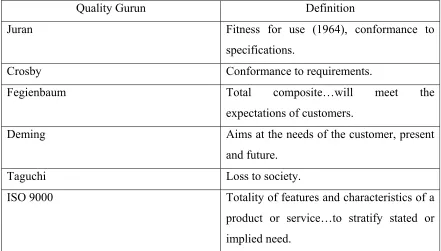
Table 2.1: Definitions of Quality
Quality Gurun Definition
Juran Fitness for use (1964), conformance to
specifications.
Crosby Conformance to requirements.
Fegienbaum Total composite…will meet the
expectations of customers.
Deming Aims at the needs of the customer, present
and future.
Taguchi Loss to society.
ISO 9000 Totality of features and characteristics of a
product or service…to stratify stated or implied need.
2.2 The Evolution of Quality
Quality principles have evolved over time. Up until the advent of production, artisans completed individual products and inspected the quality of their own work or that of an apprentice before providing the product to the customer. If the customer experienced dissatisfaction with the product, he or she dealt directly with the artisan. In a production setting, the steps necessary to create a finished product are divided among a number of work stations, which each performs a single repetitive operation. In order to be interchangeable, the parts must be nearly identical. This allows the assembler to randomly select a part from a group of parts and assemble it with a second randomly selected part. For this to occur without problems, the machines must be capable of producing parts with minimal variation, within specifications set by the designer. If the parts are not made to specification, during assembly a randomly selected part may or may not fit together easily with its mating part. This situation defeats the idea of interchangeable parts.
2.2.1 Inspection
As the variety of items being produced, a need for monitoring the quality of the parts produced by those processes arises. The customer no longer directly with the individuals responsible for creating the product, and industries needed to ensure that the customer received a quality product. Inspection is refers to those activities designed to detect or find nonconformance existing in already completed products and services. Inspection involves the measuring, examining, testing, or gauging of one or more characteristics of a product or service. Inspection results are compared with established standards to determine whether or not the product or service conforms.