R E S E A R C H A R T I C L E
Open Access
Self-reported test ordering practices among
Canadian internal medicine physicians and
trainees: a multicenter cross-sectional
survey
Thomas Bodley
1*, Janice L. Kwan
1,2, John Matelski
2,3, Patrick J. Darragh
1,4and Peter Cram
1,2Abstract
Background:Over-testing is a recognized problem, but clinicians usually lack information about their personal test ordering volumes. In the absence of data, clinicians rely on self-perception to inform their test ordering practices. In this study we explore clinician self-perception of diagnostic test ordering intensity.
Methods:We conducted a cross-sectional survey of inpatient General Internal Medicine (GIM) attending physicians and trainees at three Canadian teaching hospitals. We collected information about: self-reported test ordering intensity, perception of colleagues test ordering intensity, and importance of clinical utility, patient comfort, and cost when ordering tests. We compared responses of clinicians who self-identified as high vs low utilizers of diagnostic tests, and attending physicians vs trainees.
Results:Only 15% of inpatient GIM clinicians self-identified as high utilizers of diagnostic tests, while 73% felt that GIM clinicians in aggregate (“others”) order too many tests. Survey respondents identified clinical utility as important when choosing to order tests (selected by 94%), followed by patient comfort (48%) and cost (23%). Self-identified low/average utilizers of diagnostic tests were more likely to report considering cost compared to high utilizers (27% vs 5%,P= 0.04). Attending physicians were more likely to consider patient comfort (70% vs 41%,p= 0.01) and cost (42% vs 17%,p= 0.003) than trainees.
Conclusions:In the absence of data, providers seem to recognize that over investigation is a problem, but few self-identify as being high test utilizers. Moreover, a significant percentage of respondents did not consider cost or patient discomfort when ordering tests. Our findings highlight challenges in reducing over-testing in the current era.
Keywords:Diagnostic investigation, Quality improvement, Behavioural science, Hospital medicine
Background
Diagnostic investigations are instrumental in screening patients for disease, making a diagnosis, and monitoring response to therapy. In Ontario, Canada (population 13.5 million), hospital based laboratories process over 100 million laboratory tests annually (1), and from 2004 to 2012 the annual volume of computed tomography (CT) scans nearly doubled to over 1.5 million (2).
Excessive testing is costly, (3) potentially harmful to pa-tients and creates excess work for providers who must review and follow-up on ordered tests (4, 5). Excessive phlebotomy of hospitalised patients causes patient dis-comfort and iatrogenic anemia (6), while excess radi-ation exposure is known to increase cancer risk (7). Unnecessary testing can also lead to diagnostic error through incidental findings and “false positives” (8, 9), which can unleash a diagnostic cascade of further testing and unwarranted treatment (10). The combination of ex-pense and patient harm has led groups such as Choosing
© The Author(s). 2019Open AccessThis article is distributed under the terms of the Creative Commons Attribution 4.0 International License (http://creativecommons.org/licenses/by/4.0/), which permits unrestricted use, distribution, and reproduction in any medium, provided you give appropriate credit to the original author(s) and the source, provide a link to the Creative Commons license, and indicate if changes were made. The Creative Commons Public Domain Dedication waiver (http://creativecommons.org/publicdomain/zero/1.0/) applies to the data made available in this article, unless otherwise stated. * Correspondence:[email protected]
1Department of Medicine, University of Toronto, Toronto, ON, Canada
Wisely to advocate for physician restraint in diagnostic testing of hospitalised patients (11).
Interestingly, while hospital based physicians are in-creasingly provided with individualized reports on re-admission rates, hospital length-of-stay, and mortality, it is still uncommon for physicians to routinely receive data on their personal diagnostic test ordering practices
(12, 13). Without data physicians must to rely on
self-perception, though self-perceptions are known to be inaccurate in many settings (14, 15). We surveyed in-patient General Internal Medicine (GIM) attending phy-sicians and trainees at three Canadian teaching hospitals to investigate self-perceived diagnostic test ordering intensity. We explore how a clinicians self-perception of their test ordering practices is influenced by their level of training, and how self-perception as a high or low utilizer of diagnostic tests is associated with different factors that physicians consider important when order-ing tests.
Methods
Setting and participants
We conducted a survey of trainees (medical students and residents) and staff physicians (aka attendings) from inpatient GIM teaching services at three University of Toronto hospitals between November 2016 and October 2017. Study sites included Toronto General Hospital, Toronto Western Hospital, and Mount Sinai Hospital which are all tertiary/quaternary care hospitals in Toronto, Ontario. Attendings complete nearly all of their clinical work at their primary hospital, while trainees rotate between hospitals.
Survey tool
We developed a survey tool (Additional file1: Table S1) to investigate physician self-perceived diagnostic test or-dering intensity, self-estimated test oror-dering volumes, and factors considered when ordering tests. Survey ques-tions were developed via consensus by the study authors and refined using an iterative process. The survey was pilot tested with three colleagues and refined for usabil-ity, clarusabil-ity, and content prior to distribution.
We collected respondent demographics including age, sex, and level-of-training/clinical experience. Using a five-point Likert scale with 1 representing negative re-sponses (much lower, too few tests); 5 representing posi-tive responses (much higher, too many tests), we asked respondents to: 1) rate their personal test ordering in-tensity relative to their GIM peers; 2) rate the test order-ing intensity of their peers in aggregate; and 3) rate how often they considered patient comfort, cost, and clinical utility when deciding what tests to order. We also asked respondents to estimate the number of lab tests and im-aging investigations (xrays, ECGs, MRIs, etc.) they order
on a typical patient during the first 24 h of hospital ad-mission and on follow-up over a 7 day hospitalization. Structured definitions of what we considered an investi-gation were provided (Additional file1: Table S1).
Sampling method and sample size
We invited all GIM attending physicians at the three study sites to participate through email. We surveyed a convenience sample of trainees; specifically, we distrib-uted our survey to trainees on their GIM rotations at our participating hospitals who attended a series of eight noon teaching conferences between November 2016 and August 2017 that members of our study team attended. The survey was distributed to trainees attending the noon conferences and survey administration was followed by a 45-min teaching session led by members of our team for trainees on principles of diagnostic test stewardship, test result follow-up, and challenges. All surveys were completed anonymously using an implied consent process and without an incentive. We calculated that a sample size of 125 completed surveys would pro-vide us with 80% power to detect a 0.5 difference in Likert responses for attendings compared to trainees. All data was stored, analyzed, and presented in aggregate. Institutional review board approval was obtained at each hospital site and the University of Toronto.
Statistical analysis
Trainee response rate was calculated as the number of completed surveys divided by the total number of surveys distributed during noon conferences. Attend-ing response rate was the number completed surveys divided by the number of attendings solicited through email. We used descriptive statistics to characterize respondent demographics. We compared responses of attendings versus trainees and self-identified low/aver-age test utilizers (Likert 1–3) versus high test utilizers
(4, 5) with respect to estimated test ordering volumes
and the importance of patient comfort, test cost, and clinical utility using chi-square and Fisher’s exact tests for categorical variables, and t-tests for continuous variables. Chi-square statistics were used where sam-ples sizes permitted, (16) with Fisher’s exact tests used for smaller cell sizes.
removing intermediate responses (Likert 3). P-values are reported for all comparisons, and p < 0.05 were judged statistically significant. Statistical analyses were performed using Microsoft Excel 2013 (Microsoft Corp, Redmond, WA) and R Version 3.4.0 (R Core Team, Vienna, Austria).
Results
The overall response rate was 83% (132/159); 92% (99/ 108) for trainees and 65% (33/51) for attendings (p < 0.001). Question specific response rates across all groups of respondents varied from 90 to 100% (Additional file2: Table S2). The median age of attendings was 42 years (range 28 to 66 years, 38% female) and trainees was 27 years (range 23 to 37 years, 43% female).
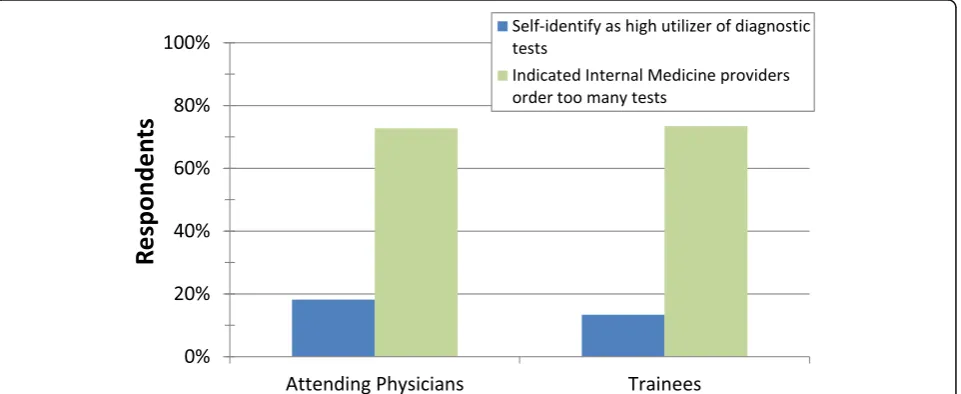
Only 15% (19/130) of respondents self-identified as high utilizers of diagnostic tests relative to their peers, but 73% (96/131) felt that GIM physicians as a group or-dered too many tests. The magnitude of this discrepancy was consistent between attendings and trainees (Fig.1).
Respondents who self-identified as high utilizers of tests did not differ from low/average utilizers in their self-reported testing volumes, nor did estimated test ordering volumes differ between attendings and trainees (Table1).
Among all respondents, 94% (122/130) considered clinical utility (i.e., whether a test would impact patient management) most of the time or always (4 or 5 on Likert scale) when deciding what tests to order. 48% (64/ 132) considered patient comfort most of the time or al-ways and 23% (31/132) considered cost most of the time or always. Attendings were more likely than trainees to identify patient comfort (70% vs 41%, p= 0.01) and cost (42% vs 17%, p = 0.003) as important. Self-identified low/average test utilizers were more likely to identify cost as important compared to high utilizers (27% vs 5%,
P = 0.04). Subgroup analyses yielded similar results and are available in Additional file3: Table S3.
Discussion
In a multi-center study of Canadian inpatient GIM phy-sicians and trainees we investigated self-reported diag-nostic test ordering practices. A majority of respondents (73%) identified their colleagues as ordering too many tests, but only 15% self-identified as high test utilizers themselves. We also found infrequent consideration of cost (23%) and patient comfort (48%) when deciding what tests to order. Despite significant efforts to increase awareness of diagnostic minimalism and resource stew-ardship (11), our findings suggest that important barriers to improvement remain.
Our finding that GIM providers identify their colleagues as high utilizers of diagnostic tests far more often than themselves is mathematically implausible, and may reflect the lack of real-time test ordering feedback to clinicians. GIM physicians in our hospitals receive group-level data on hospital length-of-stay, mortality, and readmission rate, but granular data on diagnostic testing intensity is not routinely available. A number of research teams have demonstrated that audit-and-feedback or computerized
“dashboards” providing individualized diagnostic testing data can be helpful (13,17). Diagnostic test management toolboxes propose interventions to help organizations im-prove test utilization (18), including individual physician test utilization report cards. While these practices hold promise, they are not widely implemented and a recog-nized limitation is the need to provide incentives to review and improve performance (18). Lack of real-time diagnos-tic testing intensity is likely to contribute to well
[image:3.595.60.541.506.703.2]recognized over-use of tests ranging from echocardiog-raphy to hemologbin A1c testing (19,20).
Our findings are also consistent with concepts from behavioural psychology, where the “above average ef-fect” or “comparative optimism effect” describes how individuals look favorably upon personal performance relative to peers (21). Comparative optimism has been shown in surgical residents who over-estimated their global performance (22), and may contribute to diag-nostic error though physician anchoring/commitment to a misdiagnosis (23). Our study suggests that self-perceptions are likely to be inaccurate, and again draws attention to the importance of real-time data on diag-nostic testing intensity. However, even robust interven-tions like audit and feedback, if done in isolation, are unlikely to solve all of the challenges with test utilization. Multifaceted and coordinated interventions are likely helpful (18); for example by combining audit and feedback with test ordering decision support tools and de-adoption of obsolete or low-utility tests (8).
It is also important to discuss physician motivations for ordering tests. Survey respondents consistently cited clinical utility (94% overall) as an important consider-ation which is appropriate since a clinical question should prompt test ordering. Unlike clinical utility, only 24% of respondents cited cost as an important and 48% cited patient comfort; these findings are particularly sur-prising considering social desirability bias that may have inflated these numbers relative to true beliefs and prac-tice (21). Our finding that many respondents do not consider cost may explain why interventions like display-ing test prices to orderdisplay-ing providers have had modest impact (24). The lack of consideration of patient comfort is also worrisome in an era where patient-centered care and patient reported outcomes are increasingly recog-nized as important (25).
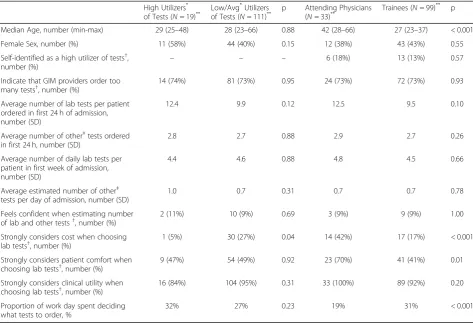
[image:4.595.64.538.98.421.2]Finally, comparison across respondent groups (high vs low test utilizers and trainees vs attending physicians) warrants comment. Self-reported high utilizers of diag-nostic investigations were even less likely than low/ Table 1Test ordering by self-identified high vs low/average utilizers of diagnostic tests and attending physicians vs trainees
High Utilizers*
of Tests (N= 19)** Low/Avg *
Utilizers
of Tests (N= 111)** p Attending Physicians(N= 33)** Trainees (N= 99) **
p
Median Age, number (min-max) 29 (25–48) 28 (23–66) 0.88 42 (28–66) 27 (23–37) < 0.001
Female Sex, number (%) 11 (58%) 44 (40%) 0.15 12 (38%) 43 (43%) 0.55
Self-identified as a high utilizer of tests†, number (%)
– – – 6 (18%) 13 (13%) 0.57
Indicate that GIM providers order too many tests†, number (%)
14 (74%) 81 (73%) 0.95 24 (73%) 72 (73%) 0.93
Average number of lab tests per patient ordered in first 24 h of admission, number (SD)
12.4 9.9 0.12 12.5 9.5 0.10
Average number of other‡tests ordered in first 24 h, number (SD)
2.8 2.7 0.88 2.9 2.7 0.26
Average number of daily lab tests per patient in first week of admission, number (SD)
4.4 4.6 0.88 4.8 4.5 0.66
Average estimated number of other‡ tests per day of admission, number (SD)
1.0 0.7 0.31 0.7 0.7 0.78
Feels confident when estimating number of lab and other tests†, number (%)
2 (11%) 10 (9%) 0.69 3 (9%) 9 (9%) 1.00
Strongly considers cost when choosing lab tests†, number (%)
1 (5%) 30 (27%) 0.04 14 (42%) 17 (17%) < 0.001
Strongly considers patient comfort when choosing lab tests†, number (%)
9 (47%) 54 (49%) 0.92 23 (70%) 41 (41%) 0.01
Strongly considers clinical utility when choosing lab tests†, number (%)
16 (84%) 104 (95%) 0.31 33 (100%) 89 (92%) 0.20
Proportion of work day spent deciding what tests to order, %
32% 27% 0.23 19% 31% < 0.001
*
High Utilizers of tests correspond to a 4 or 5 on 5-point Likert Scale when asked to rate their diagnostic test ordering intensity relative to their peers. Low/ Average Utilizers correspond to a 1–3 on the same scale
**
Percentages are based on question specific response rates rather than overall survey response rates
†Response corresponds to 4 or 5 on a 5-point Likert Scale
‡Structured definition for“other investigations”was provided including radiographic imaging, ECGs, etc.
average utilizers to report considering cost (5% vs 27%, p= 0.04). This makes us wonder if education about cost is needed, or alternatively, if focusing on cost can ever be effective among providers who do not view fiscal con-siderations as important. Our finding that trainees were less likely than attendings to consider cost (42% vs 17%) and patient comfort (70% vs 41%) suggests that experi-ence may also play a role in prioritizing these factors. Considering level of training may be important in de-signing future interventions to curtail over investigation.
Our study has several limitations. First, our study was conducted amongst Internal Medicine trainees and staff physicians at three Toronto teaching hospitals. While our results are likely to be generalizable to Internal Medicine trainees and staff at other Canadian teaching hospitals, extrapolating our findings to other clinical ser-vices (e.g., surgery, family medicine), other countries, or community hospitals may be premature. Rather we would suggest our findings need replication in other set-tings. Second, we relied on physician self-report of test ordering volumes and it is unclear how well self-reported testing behaviors correlate with actual practice. However, most physicians do not regularly receive data on their diagnostic testing utilization so self-perceptions are crucial. Finally, our study focused on inpatient in-ternal medicine wards and it will be important to verify our results in other practice settings.
Conclusions
The absence of real-time data on diagnostic testing utilization forces clinicians to rely upon self-perceptions. In our study, clinicians seem to recognize that over in-vestigation is a problem, but few individuals self-identify as high test utilizers. We also found that a significant percentage of clinicians do not consider cost or patient discomfort when ordering tests. Our findings highlight challenges in reducing over-testing in the current era.
Supplementary information
Supplementary informationaccompanies this paper athttps://doi.org/10. 1186/s12913-019-4639-3.
Additional file 1:Table S1.Survey Tool: Complete survey tool used during data collection
Additional file 2:Table S2.Question Specific Response Rates: Response rates for each individual question stratified by level of training
(Attendings, Residents, Medical students)
Additional file 3:Table S3.Subgroup Analysis: IncludesTable S1.
(Residents compared to Medical Students),Table S2.(Senior Attendings compared to Junior Attendings),Table S3.(Male compared to Female participants),Table S4.(Self-identified High Utilizers of diagnostic tests with Likert 4–5 compared to Low Utilizers with Likert 1–2)
Abbreviations
CT:(Computed Tomography); ECG: (Electrocardiogram); GIM: (General Internal Medicine); MRI: (Magnetic Resonance Imaging)
Acknowledgements
Not applicable.
Availability of data and material
The datasets used and analysed during the current study are available from the corresponding author on reasonable request.
Authors’contributions
TB, PD, JK, and PC conceived the study. TB, PC and JM were involved in study design and data collection. TB and JM synthesized the data and completed the statistical analysis. All authors had full access to the data and take responsibility for the integrity of the data and the accuracy of the data analysis. All five authors contributed to manuscript preparation and refinement. All of the authors read and approved the final manuscript. All of the authors are willing to provide ICMJE authorship disclosures to attest to their contributions.
Funding
PC was supported in-part by a K24 award from NIAMS (AR062133) at the US NIH. The funding body had no input on study design, execution, data analysis, or manuscript synthesis.
Ethics approval and consent to participate
An implied consent process was used during in-person and email survey administrations. Each survey had an Institutional Review Board (IRB) approved cover letter explaining the study and consent process. All participants who completed the survey were identified as having consented to the study. Written consent was not required by any of the three IRB approving bodies for this work, which included: the University Health Network (UHN_REB#_16– 5633), Mt. Sinai Hospital (MSH_REB#_16–0163), and through the University of Toronto Department of Medicine (Ethics Approval_ Post-graduate Medical Education).
Consent for publication
Not applicable.
Competing interests
The authors declare that they have no competing interests.
Author details
1Department of Medicine, University of Toronto, Toronto, ON, Canada. 2
Division of General Internal Medicine, Sinai Health System and University Health Network, Toronto, ON, Canada.3Biostatistics Research Unit, University
Health Network, Toronto, ON, Canada.4Department of Medicine, Michael Garron Hospital, Toronto, ON, Canada.
Received: 3 April 2019 Accepted: 15 October 2019
References
1. Ministry of Health and Long-term Care. [Internet]. Laboratory Services Expert Panel 2015. Available from:www.health.gov.on.ca/en/common/ministry/ publications/reports/lab_services/labservices. Accessed March 10, 2018. 2. Canadian Institute for Health Information. [Internet]. Medical Imaging in
Canada 2012. Available at:https://www.cihi.ca/en/medical-imaging#_ Metadata. Accessed March 10, 2018.
3. Van Walraven C, Raymond M. Population-based study of repeat laboratory testing. Clin Chem. 2003;49(12):1997–2005.
4. Darragh PJ, Bodley T, Orchanian-Cheff A, Shojania KG, Kwan JL, Cram P. A systematic review of interventions to follow-up test results pending at discharge. J Gen Intern Med. 2018;33(5):750–8.
5. Gordon JR, Wahls T, Carlos RC, Pipinos II, Rosenthal GE, Cram P. Failure to recognize newly identified aortic dilations in a health care system with advanced electronic medical record. Ann Intern Med. 2009;151(1):21–7. 6. Thavendiranathan P, Bagai A, Ebidia A, Detsky AS, Choudhry NK. Do blood
tests cause anemia in hospitalized patients? The effect of diagnostic phlebotomy on hemoglobin and hematocrit levels. J Gen Intern Med. 2005; 20(6):520–4.
examinations and the associated lifetime attributable risk of cancer. Arch Intern Med. 2009;169(22):2078–86.
8. Cadamuro J, Ibarz M, Cornes M, Nybo M, Haschke-Becher E, von Meyer A, et al. Managing inappropriate utilization of laboratory resources. Diagnosis. 2019;6(1):5–13.
9. Epner PL, Gans JE, Graber ML. When diagnostic testing leads to harm: a new outcomes-based approach for laboratory medicine. BMJ Qual Saf. 2013; 22:ii6–ii10.
10. Carpenter CR, Raja AS, Brown MD. Over testing and the downstream consequences of overtreatment: implications of preventing over diagnosis for emergency medicine. Acad Emerg Med. 2015;22:1484–92.
11. Choosing Wisely Canada. [Internet]. Internal Medicine: five things physicians and patients should question. Choosing Wisely Canada website.https:// choosingwiselycanada.org/internal-medicine. Published April 2, 2014. Accessed August 10, 2018.
12. Corson AH, Fan VS, White T, Sullivan SD, Asakura K, Myint M, et al. A multifaceted hospitalist quality improvement intervention: decreased frequency of common labs. J Hosp Med. 2015;10(6):390–5.
13. Kurtzman G, Dine J, Epstein A, Gitelman Y, Leri D, Patel MS, et al. Internal medicine resident engagement with a laboratory utilization dashboard: mixed methods study. J Hosp Med. 2017;12(9):743–6.
14. Barnsley L, Lyon PM, Ralston SJ, Hibbert EJ, Cunningham I, Gordon FC, et al. Clinical skills in junior medical officers: a comparison of self-reported confidence and observed competence. Med Ed. 2004;38:358–67. 15. Lipsett PA, Harris I, Downing S. Resident self-other assessor agreement:
influence of assessor, competency, and performance level. Arch Surg. 2011; 146(8):901–6.
16. McHugh ML. The chi-square test of independence. Biochemia Medica. 2013; 23(2):143–9.
17. Bhatia RS, Ivers NM, Yin XC, Myers D, Nesbitt GC, Edwards J, et al. Improving the appropriate use of transthoracic echocardiography: the echo WISELY trial. J Am Coll Cardiol. 2017;70(9):1135–44.
18. Baird G. The laboratory test utilization management toolbox. Biochemia Medica. 2014;24(2):223–34.
19. Laxmisan A, Vaughan-Sarrazin M, Cram P. Repeated hemoglobin A1C ordering in the VA health system. Am J Med. 2011;124(4):342–9. 20. Okrah K, Vaghan-Sarrazin M, Cram P. Trends in echocardiography utilization
in the veterans administration healthcare system. Am Heart J. 2010;159(3): 477–83.
21. Chambers JR, Windschitl PD. Biases in social comparative judgments: the role of nonmotivated factors in above-average and comparative-optimism effects. Psych Bull. 2004;130(5):813–38.
22. Berner ES, Graber ML. Overconfidence as a cause of diagnostic error in medicine. Am J Med. 2008;121(5A):S2–23.
23. Althubait A. Information bias in health research: definition, pitfalls, and adjustment methods. J Multidiscip Healthc. 2016;9:211–7.
24. Silvestri MT, Bongiovanni TR, Glover JG, Gross CP. Impact of price display on provider ordering: a systematic review. J Hosp Med. 2016;11:65–76. 25. Ovretveit J, Zubkoff L, Nelson EC, Frampton S, Knudsen JL, Zimichman E.
Using patient-reported outcome measurement to improve patient care. Int J Qual Health Care. 2017;29(6):847–9.
Publisher’s Note