This text was adapted by The Saylor Foundation under a Creative
Commons Attribution-NonCommercial-ShareAlike 3.0 License without
Introduction
The defining challenge facing business leaders is to develop and drive performance into the future. For commercial firms, this generally means building profits and growing the value of the business. Although their focus may be on nonfinancial outcomes, public services, voluntary groups, and other not-for-profit organizations share the same central challenge—continually improving their
performance. When the causes of performance through time are not understood, management has difficulty making the right decisions about important issues. Worse, entire organizations are led into ill-chosen strategies for their future.
To overcome these problems, leaders need the means to answer three basic questions:
1. Why is business performance following its current path? 2. Where are current policies, decisions, and strategy leading us? 3. How can future prospects be improved?
These questions are the starting point for this book.
The key to achieving business success is the ability to develop and sustain critical resources and capabilities, leveraging what we have today to grow more of what we will need tomorrow. This book explains the journey your organization takes through time as it builds this portfolio of vital resources. It provides innovative ideas that enable readers to answer the three questions and develop a
sustainable winning strategy.
The approach described here is based on strategy dynamics (Warren, 2008), a rigorous, fact-based method for developing and managing strategy. The underlying science is known as system dynamics, which originated at the Massachusetts Institute of Technology in the 1960s (Forrester, 1961;
This book has been written in a compact and easy-to-read style to help managers quickly understand the underlying causes of strategic challenges so that they can take action to improve performance. It uses clear examples to show how things can go well if managers have a firm grasp of the changing resources in their business, or badly if this perspective is missing. It describes practical techniques for developing a dynamic, time-based picture of a range of challenges. It includes
a clear overview at the start of each chapter setting out the issues and techniques to be
explained;
action checklists highlighting practical considerations to help ensure that the approach is applied
successfully;
worked examples, diagrams, and tips on doing it right, showing how the techniques and
ideas can be implemented to uncover new insights and benefit your entire organization.
Traveling the critical path to organizational success is a challenging and fascinating journey. This book provides a practical, in-depth guide to help you along the way. If you would like to understand and discuss these techniques in more detail, I would be delighted to hear from you
Chapter 1
Performance Through Time
Overview
The biggest challenge facing business leaders is to understand and drive performance into the future while improving long-term profits. Executives in nonprofit organizations have performance aims too, though they may not be financial. To tackle this challenge, leaders need good answers to three basic questions: why the business’s performance is following its current path, where current policies and strategy will lead, and how the future can be altered for the better.
This chapter will do the following:
clarify these questions and explain the contribution that a sound approach to strategy can make
explain why performance through time is so critical
outline some limitations of existing strategy tools that explain why few senior managers use
them
give you practical techniques for developing a time-based picture of the challenges you face
1.1
The Challenge for Business Leaders
Your organization’s history is fundamental to its future. What you can achieve tomorrow depends on what you have today, and what you have today is the total of everything you have built up, and held on to, in the past. This is true even for new ventures when the entrepreneur brings experience, credibility, and contacts to bear on creating the new business.
It also holds true for nonprofit activities: voluntary groups, government services, and
nongovernmental organizations (NGOs). They too can only achieve what is possible with their current resources, and if more resources are needed then existing ones must be used to get them. A charity will not appeal to many new donors, for example, unless it has built a reputation.
order to achieve even those plans that might be feasible. The catalog of failed initiatives, in every sector and through all time, would make a thick book indeed. These failures are costly not only in money but also in terms of wasted and damaged human potential. The better news is that
organizations are often capable of far more than they imagine, if only they choose objectives well and piece together the necessary elements.
Improving an organization’s performance is not just a matter for top management. Given the right tools, everyone with influence over the way in which any part of their enterprise functions can make a difference. Challenges may be focused on an individual department or span the whole organization; they may range from very small to truly huge; and they may call for urgent measures or a long-term approach. This book focuses on the content of strategy—what the strategy actually is—in contrast to the equally important issues of the process by which strategy happens in organizations (Mintzberg, Lampel, Quinn, & Ghoshal, 1997).
1.2
The Importance of Time
The following cases illustrate organization-wide challenges with long-term implications but short-term imperatives for action. The scale of each issue is important, and the cases highlight the time path over which strategic challenges evolve and resources develop or decline. Ensuring that these changes play out at the right speed is vital.
The starting point for the approach that we will develop in later chapters is shown in Figure 1.1 "Alibaba.com Growth and Alternative Futures".
These time charts display three important characteristics: 1. A numerical scale (registered users, revenues)
2. A time scale (7 years of history to 2007)
Figure 1.1 Alibaba.com Growth and Alternative Futures
Case Example: Alibaba.com
We are used to thinking of the goliaths of the Internet age, such as Google, Amazon, and eBay, as unassailable leaders in their fields, but Chinese upstart Alibaba.com showed that eBay, for one, could be beaten to a massive opportunity, given a careful focus.
From the most humble resources—just $60,000 in capital and 18 poorly paid colleagues—the founder, Jack Ma, laid out a vision for what Alibaba could become. Although highly speculative, the vision was sufficiently promising to attract venture funding and some big-name advisers to his board.
The business focused on helping smaller Chinese firms that wanted to grow business globally but found existing options to be too expensive. The key proposition was to connect such companies to similarly small and midsized buyers around the world. In spite of the apparent potential and easier access to larger firms, Alibaba maintained this focus on small and medium-size enterprises (SMEs). It also stuck to offering the simple service of connecting buyers and sellers rather than getting involved in other complementary activities.
In 2001, Alibaba started charging for its services, though still at a low rate of $3,000 per year. However, by this time the service’s visibility and reputation were so strong that membership kept on climbing, passing the 1 million mark in 2002.
From this focused start, the company was able to extend its activities in several directions, first establishing a within-China service in the local language and then making a major thrust to develop business-to-consumer (B2C) and consumer-to-consumer (C2C) services. By 2007 the group was serving 24 million users and had effectively sealed victory over eBay, which exited the market.
These three features ensure that the charts provide a clear view of the challenge, and allow further details to be added later. This particular example happens to focus directly on a critical resource—registered users—and clarifies the absolute numbers: much more useful than derived ratios such as market share or abstract notions such as competitive advantage. Often, management’s concern will be directed at the financial consequences—in other words, revenues and profits.
Understanding the history of decisions that have already been made is essential, as they are driving the business’s trajectory into the future. Past additions to the services offered and to the customer groups targeted brought the business to its state in 2007. Success or failure in the company’s future choices on these and other issues will determine its trajectory forward from that point in time.
Figure 1.2 Alternative Futures for Blockbuster Inc.
Case Example: Blockbuster Inc.
Not all strategic challenges are so happily able to focus on sustaining spectacular growth in business activity and financial rewards. Other cases pose substantial threats, where the best that strategic management may be able to achieve is to resist decline or even closure.
Blockbuster Inc., from its startup and early growth in the late 1980s, effectively defined and dominated the market for renting movies to watch at home. Up to 1995, sales and profits climbed ever upward, driven by aggressive expansion of the company’s store network, both owned and franchised, voracious acquisition of smaller chains, and entry into many new country markets. From 1995, it proved hard to sustain profitability, and by 2000 pressures on revenues and profits escalated sharply with the launch of Netflix.com, a service that allowed consumers to order movies on the Internet for postal delivery and return. With the new convenience this offered consumers, and without the costly burden of store real estate and staff, Netflix was able to offer very attractive prices and soon started to steal consumers from Blockbuster.
spite of the company’s best efforts to make a positive advantage of the combined channels. As revenues suffered, marginal stores began to lose money, and closures became inevitable.
1.3
Problems With Existing Strategy Tools
Given that the problem of managing performance through time is universal, it is astonishing that time charts like those in our exhibits are almost completely absent from business books and management literature. Try looking for yourself next time you find yourself in a business bookstore. So what tools do managers actually use to help them decide what to do?
A regular survey by one of the large strategy consulting firms identifies a long list of management tools (Bain & Company, 2007). However, few of these have won much confidence among managers, with the result that they come and go in popularity like fashions in clothing. The tools fall into several categories:
simple principles open to wide interpretation, such as vision statements and strategic planning
substantial changes to business configurations, such as reengineering and outsourcing
approaches to controlling performance, such as value-based management and the balanced scorecard
problem-solving methods, such as the five forces, real options, and customer segmentation
A wide-ranging study by another consulting company, McKinsey (Coyne & Subramanian, 2000), found that there were few strategy tools with sound methodological foundations beyond the industry forces and value-chain approaches set out by Michael Porter in the early 1980s (Porter, 1980). The many qualitative methods available seemed to work well only in the hands of their developers and were limited in their ability to provide robust, fact-based analysis.
To understand the potential value of a sound approach to managing performance through time, it is useful to start by identifying the problems with current approaches to strategy.
SWOT Analysis
Assessing an organization’s strengths, weaknesses, opportunities, and threats (SWOT) is a method widely used by managers to evaluate their strategy. Unfortunately, it offers little help in answering the
offers us no help whatsoever in deciding what to do, when, and how much to bring about what rate of likely growth in profits.
Opportunities and threats are features of the external environment; as such, they are better dealt with by considering industry forces and political, economic, social, and technological (PEST) analysis (see Chapter 4 "Handling Interdependence Between Resources"). Strengths and weaknesses, on the other hand, center on the firm itself, so they are related to the resource-based view (RBV) of strategic management.
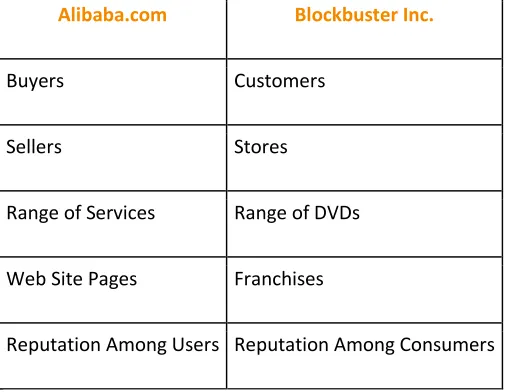
RBV writers generally devote attention to more intangible resources and the capabilities of organizations on the assumption that tangible factors are easy for competitors to copy and therefore cannot provide the basis for competitive advantage (Barney, 2006; Collis & Montgomery, 1994). Later chapters will show, however, that performance cannot be explained or improved without a strong understanding of how simple resources behave, both alone and in combination, and how they are controlled. Our two examples already illustrate common types of tangible and intangible factors that may need to be taken into account (Table 1.1 "Examples of Resources in Alibaba.com and Blockbuster Inc.").
Industry Analysis and Strategy
[image:11.612.69.322.493.689.2]The analysis of competitive conditions within an industry has dominated efforts to understand and develop firm performance. In summary, this approach says the following:
Table 1.1 Examples of Resources in Alibaba.com and Blockbuster Inc.
Alibaba.com Blockbuster Inc.
Buyers Customers
Sellers Stores
Range of Services Range of DVDs
Web Site Pages Franchises
We try to make profits by offering products for which customers will pay us more than the products
cost us to provide.
The more powerful our customers are, the more they can force us to cut prices, reducing our
profitability.
The more powerful our suppliers are, the more they can charge us for the inputs we need, again
reducing our profitability.
If we do manage to make profits, our success will attract the efforts of competitors, new entrants, and
providers of substitutes, who will all try to take business away from us, yet again depressing our profitability.
These five forces—buyers, suppliers, rivals, new entrants, and substitutes—thus explain something of industries’ ability to sustain profitability through time.
The impact of Netflix on Blockbuster is a classic example of the five forces at work, made possible by the increasing availability and usage of the Internet. The arrival of Netflix allowed consumers to switch to its lower price service from Blockbuster.
In other markets too, e-businesses can offer valuable products at very low cost by eliminating substantial costs associated with conventional supply chains, resulting in attractive profit margins. Buyers face few switching costs in taking up these alternatives. By getting very big very fast, the new providers establish buying power over their own suppliers and erect barriers against would-be rivals. The established suppliers are the substitutes, whose brick-and-mortar assets weigh them down and prevent them from competing in the new business model.
We saw the five forces at work again in the fiasco of the subprime lending boom of 2003–2007 that brought the world’s banking system to its knees. Someone spotted the opportunity to lend money for home purchases to people whose income levels or credit ratings were low. A fraction of these borrowers would likely default on these mortgages, but that was OK because the much higher interest that was charged to these borrowers would give sufficient income to cover those losses and more.
There was no way to keep this new business opportunity a secret, and nothing about it was hard for bank after bank to copy. New entrants to the market intensified competition, but in this case rivalry took the form not of lower prices but acceptance of increasingly risky customers. Ultimately, the total rate of defaults experienced by the subprime mortgage providers was not sufficiently covered by the high interest rates charged, and profitability collapsed. This whole sorry episode was made worse by banks’ packaging up of these toxic debts and selling them on to other institutions that did not appreciate the true risk, but fundamentally the whole edifice was built on appallingly bad strategic management.
It Is the Time Path That Matters
At first glance, the industry forces view makes a lot of sense, and there is indeed some tendency for industries with powerful pressure from these five forces to be less profitable than others where the forces are weaker. The implication is somewhat fatalistic: If industry conditions dominate your likely
performance, then once you have chosen your industry, your destiny is fixed. However, research has found that industry conditions explain only a small fraction of profitability differences between firms (McGahan & Porter, 1997). It turns out that factors to do with the business itself are far more important drivers of performance.
Management does matter: You can be successful in intensely competitive industries or unsuccessful in attractive industries. Moreover, the passive industry forces view takes no account of a firm’s ability to create the industry conditions that it wants. In essence, the world is the way it is today because Microsoft, Wal-Mart, Ryanair, and many other firms have made it like this, not because market growth and industry conditions have been handed down from on high.
can clear them, you are “in”; if not, you are “out.” But business life is not like that. Many industries include small firms operating quite nicely with only a little of the necessary resources, while larger firms operate from a more substantial resource base. In fact, barriers to entry do not seem like barriers at all; they are more like hills. If you are a little way up these hills, you can participate to some degree, and the further up you are, the more strongly you can compete.
So why are strategy tools so weak at answering the basic question of what is driving performance through time? It turns out that most strategy research is based on analyzing possible explanations for profitability measures, such as return on sales or return on assets. Recently, more sophisticated and appropriate measures have been used, such as returns based on economic profit (profit minus the cost of capital required to deliver that profit). Typically, data are collected for large samples of firms and plausible explanations for performance differences among the sample are tested using statistical regression methods.
Such studies generate an estimate of how much of the variation in the profitability of different firms is explained by the suggested causes. These may be external factors such as competitive intensity, or internal factors such as technology or staff training. Unfortunately, today’s profitability ratios are a very poor guide to future earnings and of little interest to investors. Would you, for example, prefer to have $1,000
invested in a firm making 20% margins but with declining revenue or in another firm making 15% but doubling in size every year?
What About Nonbusiness Settings?
The last main criticism that can be leveled against existing strategy methods is that they have little to offer the large number of managers who run organizations that are not primarily concerned with making profits. Public services in many economies have been made quasi-commercial in recent years through privatization, outsourcing, and other structural changes. Nevertheless, substantial fractions of all developed economies are still accounted for by public services. Charities, NGOs, security services, and other organizations also have objectives to pursue and resources with which to pursue them.
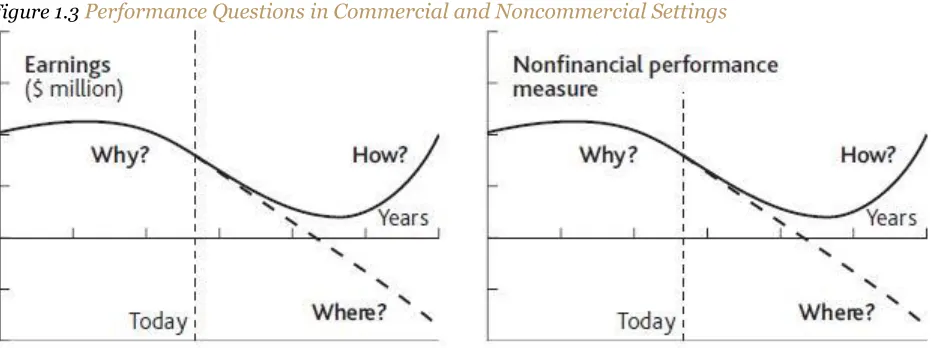
Commercial and Noncommercial Settings"). In all cases, they are expected to have sound answers to three key questions:
1. Why is our performance following its current path? 2. Where is it going if we carry on as we are?
[image:15.612.77.543.236.410.2]3. How can we design a robust strategy that will radically improve this performance into the future?
Figure 1.3 Performance Questions in Commercial and Noncommercial Settings
Case Example: Ryanair
An example of the failure of conventional industry analysis—and a testament to the success of a resource-based approach pursued over time—is provided by Ryanair. This low-cost airline operates a business model similar to that of Southwest Airlines in the United States. Its success came at a time when the global airline industry faced increased costs combined with static or declining passenger numbers. There was sympathy for the comment from Richard Branson of Virgin that “the safest way to become a
millionaire is to start as a billionaire and invest in the airline industry.”
Ryanair’s success built on the business model originally developed by Southwest, with one type of aircraft (Boeing 737), short-haul travel, no in-flight meals, and rapid turnaround times resulting in aircraft utilization up to 50% greater than the industry average. Ryanair took this approach further, avoiding travel agents, not issuing tickets, selling food and drink on the plane, and building sales through the Internet. These measures developed and reinforced the strategic priorities of efficiency, awareness, and customer satisfaction, and made the airline popular, distinctive, and successful in a fiercely competitive market.
In a sector where intense competitive forces have made the global industry endemically unprofitable for decades, Ryanair, easy Jet, Southwest, and a few other determined players have managed to do very nicely indeed.
1.4
Diagnosing Performance
A simple example helps to explain how this process of understanding, predicting, and improving performance works in practice. We will start it here and develop it in later chapters.
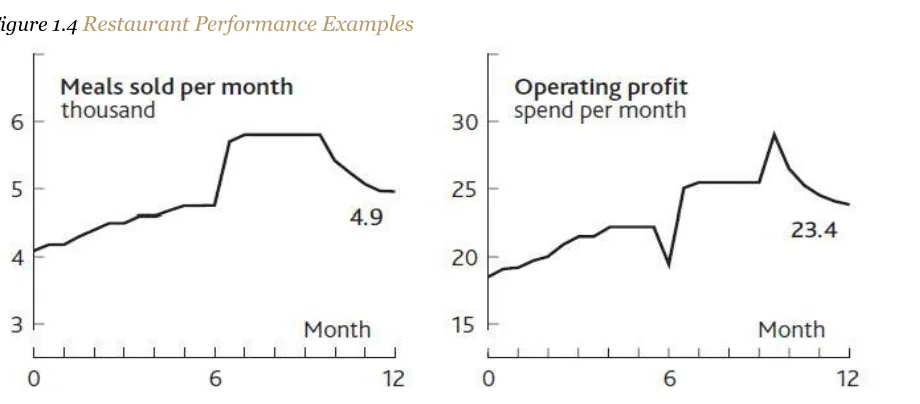
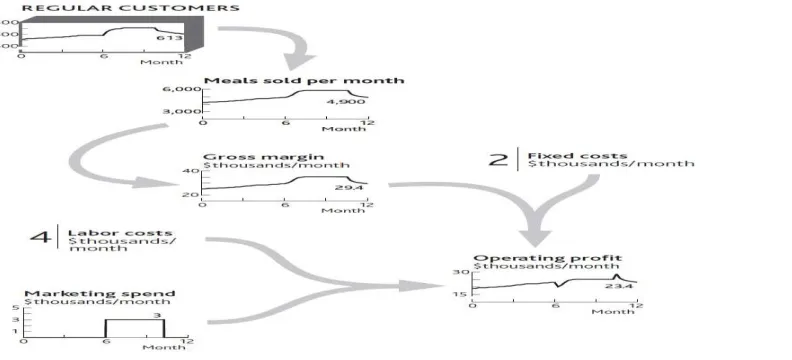
You find yourself in charge of a restaurant in a medium-size town that gets most of its business from regular customers. You also win a few new customers from time to time, some of whom become regulars. You have had a frustrating time over the past 12 months, as Figure 1.4 "Restaurant Performance Example" shows.
performance through time: We are not just concerned with static performance measures such as market share, profit margins, or return on capital.
[image:17.612.78.538.164.366.2]Valuing Performance
Figure 1.4 Restaurant Performance Examples
A particularly important reason for understanding performance through time is to put a value on firms. Essentially, investors hope to see a strong, increasing stream of “free cash flow”: the cash that is generated after reinvesting what is needed to deliver that growth. Free cash flow is
Operating income + Depreciation – Tax payments + Non-operating income – Net investments in
current assets.
Because investors prefer money sooner rather than later, the forecast free cash flows are discounted back to give a “present value,” whether for the firm as a whole or for an investment it intends to make. How these measures are calculated and the method of valuation are explained in detail elsewhere (Copeland, Koller, & Murrin, 2000), so from now on we will simply discuss earnings, profits, or operating income. We will assume that finance professionals can do the necessary translation into the correct financial measures.
the basis of assumptions about efficiency improvements). As we will see, there are dynamics at work within organizations that make such approaches to projecting performance highly unreliable.
Action Checklist: Starting With a Performance Time Path
A sound time path of past and future performance describing the challenge your organization is facing is an essential starting point. It highlights how the future might play out if resources and events continue to develop along their current path. Time paths are not forecasts, and there is little to be gained by trying to get them right. Rather, they describe how the future could turn out if things go well or badly.
Time paths provide clarity, helping to shed light on important and complex issues by showing where the current situation may lead and what impact may follow from specific decisions.
Here are some tips for preparing a performance time path:
Start with a chart of the measure that would ultimately spell success or failure.
Remember that numbers matter! Put a numerical scale and a time scale on the measure you have
chosen, going back far enough to cover the explanation for your current situation (except in the case of new ventures, obviously) and far enough into the future to cover the time-horizon of interest.
In most business-level challenges, a financial outcome is often appropriate, though intermediate
outcomes such as sales or customer numbers may work as well, provided the team recognizes that it is assuming these will lead to good financial results.
In noncommercial settings, adopt the same principle of looking for a performance measure that
closely indicates the outcome you are seeking, such as “beneficiaries served.”
Where you are tackling a challenge confined to a single functional area, such as marketing, staffing, or
product development, again look for an indicator that will signal progress toward your preferred outcome, such as sales, staff turnover, or product launch rate.
Use absolute numbers (such as millions of dollars or unit sales) rather than ratios. A 50% return on
sales of $10 is not very interesting; nor is an 80% share of a $100 market!
Consider supporting the main performance chart (e.g., profits, revenue) with a chart of a measure that
Chapter 2
Resources: Vital Drivers of Performance
Overview
Managers already know that building and conserving resources is vital, whether these are tangible items such as staff, cash, and customers, or intangibles such as reputation and investor support. They also understand that resources are interdependent; a firm’s winning product range is of little value if poor delivery damages its reputation.
Resources thus represent the crucial foundation. Leadership, capabilities, vision, and all the other subtle and complex concepts we bring to bear can improve performance only if they help us win and retain the necessary resources. This chapter will do the following:
explain the link between resources and performance
show you how to identify resources, keeping the list down to those few simple items that really
matter
explain how to define and measure resources, giving you the quantitative understanding you
need to manage and use resources successfully
2.1 What Makes a Resource Valuable?
“useful things that we have, or can use, even if we don’t own them” (Mainardi, Leinwand, & Lauster, 2008; Stalk, Evans, & Shulman, 1992).
Generally, managers focus on the truly strategic resources in their business—those few special items that might explain why one firm is more profitable than another. It is widely accepted that resources contribute to sustained competitive advantage only if they score well on most of the following questions (Barney, 2006; Collis & Montgomery, 1994).
Is the resource durable? A resource that quickly deteriorates or becomes obsolete is unlikely to
provide sustainable advantage. The more durable the resource, the better.
Is the resource mobile? Many resources are so easily moved between firms that they provide little
sustainable advantage. People are a clear example. The less mobile the resource, the better.
Is the resource tradable? Resources are particularly mobile if they can be bought and sold.
The less tradable the resource, the better.
Is the resource easily copied? Many resources are easy for competitors to copy, leaving little
scope for competitive advantage. The less easily copied the resource, the better.
Can the resource be substituted by something else? Even if a resource cannot be bought or
copied, an alternative serving the same purpose can erode any advantage. Dell Computers, for example, has negligible presence in retail stores, but its direct supply system is a great substitute. Video conferencing and collaborative working over the Web are substitutes for business air travel. The less easily substituted the resource, the better.
Is the resource complementary with other resources? Some resources work well to support
one another. The more complementary the resource, the better.
Of course, any resource you have that is difficult to copy, buy, substitute, and so on can give you an advantage, but these accepted criteria are neither necessary nor sufficient to explain why one firm beats others.
Consider this situation. You and I run competing restaurants that are next door to each other and identical in almost all respects: same size, same menu, same number of staff with the same
Now, resources do not get more tradable than cash. I could go and raise a million dollars, but it would cost me more in interest than you will make in interest on your million. It would also take time and effort to obtain, assuming, that is, that I could raise the money at all. What could you do with your million dollars? Develop new products, hire more staff, do more marketing, cut your prices for a while. You have a range of options, any one of which could start winning you more customers and sales than I have. Then you can plough back that extra income to build still more advantage. Moreover, even if I had one of those supposedly strategic resources, you could still beat me. I might have a secret recipe, for example, or exceptionally skilled and loyal staff. All the same, you could quite feasibly overwhelm me simply by spending your extra money on some mundane resources. This is not just a theoretical game; there are plenty of examples of firms winning with little evidence that they rely on such special resources. Consider McDonald’s: Its operating system is crystal clear. Thousands of executives have been through the company and know its operating manuals from cover to cover. Many have used what they learned to start their own fast-food operations. Yet none has come close to overtaking the leader.
Similar observations apply to Southwest Airlines and Ryanair. The day Ryanair started, any one of thousands of airline executives could have set up the same business. There is nothing mysterious about its operating methods. So the only criterion for strategic resources that remains from the list above is, are your resources “complementary”? In other words, do they work well together?
2.2 Identifying Resources
First, we need to identify resources, and then we need to understand a crucial feature of how they behave. Let us go back to the example of your restaurant and see how we can explain the history of your business performance over the past 12 months, shown in Figure 1.4 "Restaurant Performance Example".
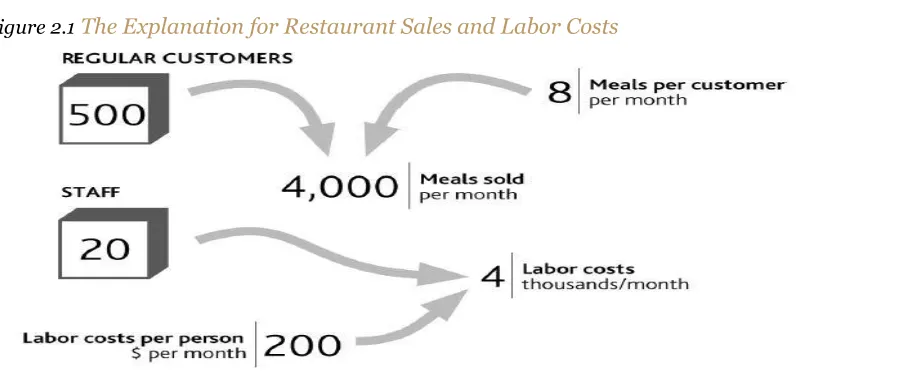
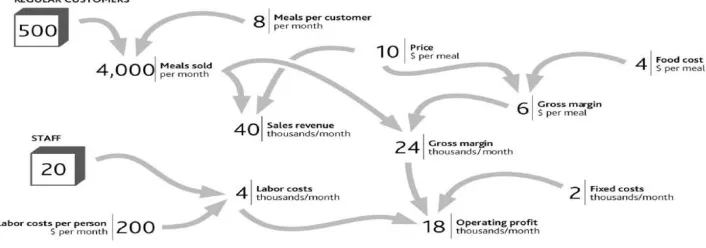
your sales and labor costs are therefore as shown in Figure 2.1 "The Explanation for Restaurant Sales and Labor Costs".
“Regular customers” and “Staff” are shown in boxes here because they are two major tangible resources in this business. Your cash and your restaurant’s seating capacity are two further resources. These items are critically important because if they do not change, neither does your business performance, provided of course that outside conditions such as competitive prices, the frequency with which customers visit your restaurant, and so on do not change either. If these resource levels do change, your profits must change immediately.
The first point to note is that resourcesare useful items that you own or to which you have
[image:22.612.79.529.360.556.2]reliable access. “Useful” simply means that they contribute to the rest of the business, either directly by providing sales or indirectly by supporting other items. You do not have to possess a resource for it to be useful. You do not “own” customers or agents, for example, but they are still somewhat reliable: There is a good chance that they will be with you tomorrow.
Figure 2.1 The Explanation for Restaurant Sales and Labor Costs
There is, however, one fundamental feature that customers and staff share, along with all other resources: The quantity of a resource that you have today is precisely the total of everything
you have ever won minus everything you have ever lost. We will look at the implications of this in Chapter 3 "Resources and Bathtub Behavior". But for now we simply need to connect your
To understand why customer numbers change through time to create our profit history, we need to learn more about how resources behave. Again, we will cover this in Chapter 3 "Resources and Bathtub Behavior".
2.3 Defining and Measuring Resources
Resources Involved in Airlines
The case of low-fare airline Ryanair from Chapter 1 "Performance Through Time" provides a useful example of business resources and their link to performance. We can take part of the airline’s financial history, add data on certain resources, and lay them out in the same graphical form that we used for your restaurant (Figure 2.3 "Explanation of Ryanair’s Revenue from 1995 to 2006, and a Possible Future to 2011"). Operating profit, on the right of the diagram, comes from revenues minus costs. Revenues result from the number of journeys made by customers and the average revenue from each journey (the fare paid by the passenger plus other items they may buy). “Journeys” do not equate with “customers,” however, since customers may travel several times in the course of a year.
Doing It Right: What Our Diagrams Mean
Word-and-arrow diagrams that at first sight look like Figure 2.1 "The Explanation for Restaurant Sales and Labor Costs" and Figure 2.2 "Your Restaurant’s Resources and Operating Profits" are common in business books. Often, though, all they mean is that two items have some general connection.
The diagrams used in this book are different. Every element within them has a specific meaning. The boxes denote resources. The curved arrows indicate that one item can be immediately calculated or estimated from another, as with a formula in a spreadsheet. For example, if you know how many regular customers you have and the frequency with which they buy, you can estimate sales volume; and if you know sales volume and price, you can calculate revenue.
Figure 2.3 Explanation of Ryanair’s Revenue from 1995 to 2006, and a Possible Future to 2011
The number of people who travel on Ryanair and the frequency with which they do so are not public knowledge, so we have used indications of plausible historical values. Nevertheless, a number of individuals do travel frequently; others regularly, but less often; and others only occasionally.
Note that, just as customer numbers have driven journeys and revenues up to 2006 (solid lines, bold text values), they will continue to do so into the future, so the exhibit also shows numbers the company might aim for in 2011 (dashed lines and normal text values).
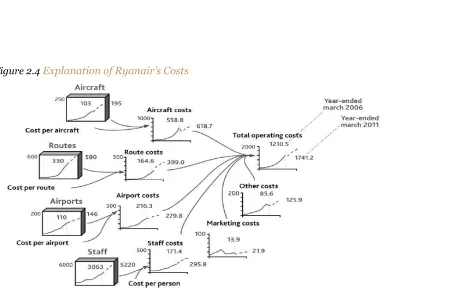
by having resources. It is also costly to win, develop, and keep resources. It is costly, for example, to start operations at a new airport, to hire staff, and to acquire aircraft.
Figure 2.4 Explanation of Ryanair’s Costs
Note that this picture of the company’s results is not merely a diagrammatic display of the arithmetic of its profit and loss statement. It is a rigorous, causal explanation. It therefore provides the start of a sound “theory” of performance. Theory has something of a bad reputation among executives. Believing
(correctly!) that management is a practical profession, many see theoretical concepts as the opposite of what should concern them. They also have good reason to be skeptical about theory, given its patchy record when it comes to providing good advice for organizations. Consequently, few theories are used by management or consulting firms for designing strategy or making strategic decisions. However,
executives use some kind of theory every time they make a decision, since they have assumptions about what the consequences will be and why (Christensen & Raynor, 2003). We need to ensure they
Standard Types of Resource
The airline case features a number of resources shown in the “tanks” on the left of Figure 2.3 "Explanation of Ryanair’s Revenue from 1995 to 2006, and a Possible Future to 2011" and Figure 2.4 "Explanation of Ryanair’s Costs". These four items are examples of some standard and commonly encountered types of resources:
Passengers are the customers that determine demand.
Airports and routes are effectively the airline’s product range.
Aircraft constitute its capacity.
Staffs are the human resources that operate the whole thing.
Resources often fall into two basic categories: those that drive demand for the product (passengers for our airline) and those that are needed to create the supply of the product (routes, planes, and staff, in this case).
Demand-Side Resources
The obvious demand-side resource is customers. There is one special case in which firms do not have identifiable customers: when they sell into commodity markets such as those for oil, minerals, and agricultural products. For just about everyone else, customers or clients are most important.
However, customers alone may not be all you need to enjoy demand for your product. In many cases you can reach your ultimate customers only through dealers or other intermediaries: another demand-side resource. Producers of fast-moving consumer goods (FMCGs) have supermarket companies as their immediate customers, but they ultimately depend on consumers wanting their products. Intel sells processors to computer makers, who sell to stores and resellers, who sell to companies and consumers. All three groups are vital in determining demand for Intel’s products.
Demand-driving resources also arise in noncommercial cases. Charities serving the needs of groups suffering disability or homelessness experience demand that reflects the number of people in the group they seek to serve. Nor is demand always a desirable factor: The rate of crime that places demand on police forces reflects the number of criminals.
Through Time", is typical of many firms that feature objectives for customer numbers. Cell phone operators and TV broadcasters also choose to set targets for customer numbers, since they are the key driver of revenues.
Supply-Side Resources
On the supply side, the first resource is the products and services that an organization offers in order to satisfy demand. Your restaurant has its menu, a car manufacturer has a range of models, and a law firm has the range of legal services it can provide.
Doing It Right: Numbers Matter
Although our list of common resource types may be helpful, the fundamental principle in identifying the core resources involved in your specific situation is to work back from the performance you want to explain. This is where sticking to the numbers is so helpful. If you want to explain the “sales” number, you must, in most cases, know the number of customers. If you want to explain “labor costs,”
you must know the number of staff, and so on. So start from the chart of performance over time that is bothering you, work back through the way each variable is calculated, and sooner or later you will bump into one or more of these things that fill up and drain away through time.
Next, you need some production capacity to manufacture or produce your product or service: the capacity of your kitchen to cook meals, or a carmaker’s factories and equipment that enable it to manufacture cars at a certain rate.
Making the whole system work requires people: Your restaurant’s cooks and waiters, a carmaker’s production-line workers, and a law firm’s lawyers are all resources that enable the organization to
Noncommercial organizations have many close parallels to these supply-side resources. Voluntary groups and public utilities offer services and sometimes products to their beneficiaries. Housing charities, health services, and police forces all need capacity to deliver their services. All of these rely on their staffs to deliver their services.
If you are concerned with a functional strategy challenge rather than the overall performance of the organization, Chapter 1 "Performance Through Time" mentioned that you will have objectives for
indicators relating specifically to that function, such as staff turnover or product launch rate. Here, too, it is possible that you might focus on an objective that is itself a resource. A law firm or an education service, for example, may well have targets to build staff numbers (lawyers or teachers) to certain levels by a certain date.
Financial Resources
We must not forget money! Cash itself is a resource and definitely obeys the rules for resources. The quantity of cash in your bank account today is precisely the sum of all cash ever added to the account minus all cash ever taken out. Debt can be thought of as a “negative” resource.
Action Checklist: Define and Quantify Resources Driving Performance
From Chapter 1 "Performance Through Time", you should have a sound time chart of past and future performance describing the challenge your organization is facing. The next step is to work back along the logical path of factors that account for the values on that chart.
Here are some tips for laying out the link from performance back to the resources that drive it:
Put your performance time chart to the right of your page.
Ask what this performance outcome is calculated from (e.g., profit = sales – costs). Put time charts for
these items to the left and connect them with arrows to the time chart of the performance outcome (see Figure 2.3 "Explanation of Ryanair’s Revenue from 1995 to 2006, and a Possible Future to 2011").
If you are not focusing on overall financial outcomes as much as some less tangible outcome, such as
example, may depend on “average staff workload.” Nevertheless, do try to specify this causal factor precisely in a way that you can quantify.
Continue asking the question “what causes what” to work back across the page to the left, adding time
charts and connections as you go. Stick firmly to the rule that if you know items to the left, you can calculate or estimate the values of items they link to on the right.
Repeat this until you hit one or more “resource” items. You should not need to make more than two to
four links before you hit these items, and you should not find very many of these resources (refer back to examples of typical resources described in this chapter).
Beware of being tempted by relationships that are outside the organization. Sales, for example,
are not determined by “market size” multiplied by “market share,” but by “customers” multiplied by “sales per customer.” (Market size is the sum of all companies’ sales, and market share is your sales divided by this total.)
Chapter 3
Resources and Bathtub Behavior
Overview
Resources have a special characteristic: They fill and drain over time, like water in a bathtub. This chapter explains this behavior, shows why it is so important, and also does the following:
explains how to work out what the numbers do when resources fill and drain
shows where management control lies
outlines how managers can develop resources through time
3.1 Bathtubs Rule! Resources Fill and Drain
Since a firm’s performance at any time directly reflects the resources available, it is essential that we understand how these resources develop over time and how we can control the process.
customers but then stopped. Perhaps they had a bad meal, got tired of the menu, or found another restaurant they preferred.
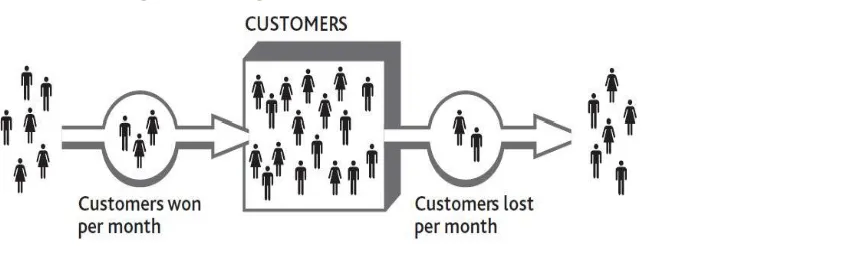
[image:31.612.85.518.335.463.2]This idea is captured in Figure 3.1 "Building and Losing Customers". The tank in the middle holds the number of customers you have right now. To the left is the outside world, where there are many people, some of whom may become future customers. The big “pipe” flowing into the tank has a pump that determines the speed at which the tank stock is filling with new customers. On the right, another pump on a pipe flowing out of the tank shows how quickly you are losing customers, and again you can see people in the outside world who include your former customers. Because the tank in this diagram holds the inventory or “stock” of customers, this diagram is known as a stock-and-flow structure.
Figure 3.1 Building and Losing Customers
Let us see how this works. By mailing out discount vouchers to local homes, you hope to pump some new consumers into the tank. However, if you do not have enough staff to provide good service, you will inadvertently increase the speed of the outflow pump and soon lose them again. The number of customers will have filled up, but then drained away again.
Doing It Right: Focusing on Numbers
The idea of resources filling and draining seems simple enough. After all, we see it happening around us all the time, from the water in our bathtub, to the cash in our bank, to cars in a city, to rabbits in a field. But merely being aware of this process is not enough if we want to take control. We need to know the following:
how many customers, staff, or other resource there are currently
how quickly these numbers are changing
how strongly these factors are being influenced by things under our control and by other forces
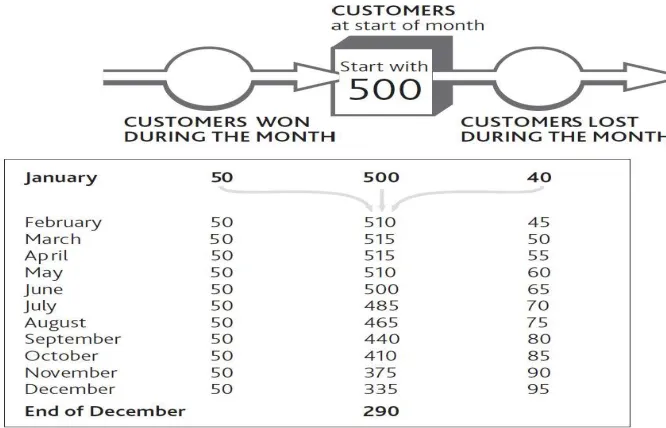
Figure 3.2 "Working Out Growth and Loss of Customers Through Time" shows what would happen to the number of customers in your business if you were to win 50 new people per month but also lose an increasing number of customers every month. You lose 40 people in the first month and an extra 5 people every month thereafter.
The case was made in Chapter 1 "Performance Through Time" and Chapter 2 "Resources: Vital Drivers of Performance" that you should always be looking at how things change over time, so these monthly numbers, too, can be shown as time charts. We can still keep the image of the bathtub or tank of customers and the pipes and pumps showing the rate at which customers are flowing in and out of your business (Figure 3.3 "The Change in Customer Numbers Over Time").
The idea that resources fill and drain over time has long been recognized in strategy research
(Dierickx & Cool, 1989), so what we will do here is make this mechanism practical to use and connect it to how the rest of the business system works.
Figure 3.3 The Change in Customer Numbers Over Time
3.2 How Management Control Affects Resources
Why are we so concerned about this “bathtub behavior” that all resources follow? Remember the problem we set out to solve, namely, what determines performance through time and how management affect performance in the future can. The logic is simple:
The resources in place drive performance at every moment.
These quantities are only explained by their inflows and outflows.
Thus to manage performance through time, the only way of exerting control is by managing the flows
of resources into and out of the system.
Consider your restaurant and see how these connections work (Figure 3.4 "How Changing Customer Numbers Drives Performance Over Time (for clarity, some items are not shown)"). In Chapter 2 "Resources: Vital Drivers of Performance" we looked at how the number of meals sold and the operating profits had changed during the previous 12 months and showed how these figures were driven by the number of customers and staff. Following the same logic, we next need to know what happened to customers and staff to bring about the performance history in Figure 2.1 "The
Explanation for Restaurant Sales and Labor Costs"and the inflows and outflows to these two resources.
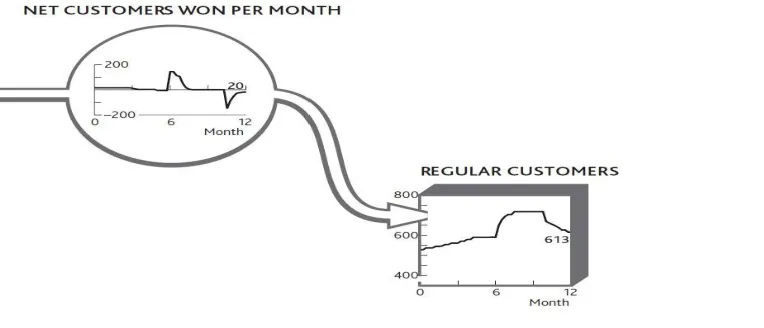
It is crucial to explain why the resource of customers developed over time as it did, and the only way to do this is to understand the flows (Figure 3.5 "The Net Flow of Customers Into and Out of Your Regular Customer Group").
Figure 3.4 How Changing Customer Numbers Drives Performance Over Time (for clarity, some
Doing It Right: Units for Resources and Flows
Figure 3.2 "Working Out Growth and Loss of Customers Through Time" and Figure 3.3 "The Change in Customer Numbers Over Time" label the flows entering and leaving the customer resource as “Customers won/lost during the month.” This is always the relationship between resources and the flows that fill or drain them: Whatever the resource in the tank, the flows are “[resource] per [time period].”
There is never any exception to this rule!
It looks as if you had an early small inflow of customers, but this slowed.
So you did some serious marketing, which brought a flood of customers.
But this soon died away again, and your customer stock settled down at a steady but higher level, with
seemingly no inflow or outflow at all.
Toward the end of the year, you experienced another flood of customers, but this time it was negative
(the downward slope on the customer flow): You were losing customers fast.
Once again the flood soon slowed to a mere trickle and your stock of customers steadied at a lower
level, again apparently with no inflow or outflow.
[image:35.612.95.491.72.252.2]You can put flesh on these bones. By asking your customers if and when they have previously visited, you get a good idea of the inflow rate. Although you cannot easily ask how many people become ex -customers each month (because they are not there to be asked!), you can work out what the outflow must have been to reconcile with the net change each month (Figure 3.6 "The Separate Flows of Customers Into and Out of Your Regular Customer Group").
Figure 3.6 The Separate Flows of Customers Into and Out of Your Regular Customer Group
Doing It Right: Separating Inflows From Outflows
But appearances are misleading. During the middle period, turbulent activity is taking place, with lots of customers arriving and many others leaving. In fact, customer churn is so rapid that by months 9 and 10, you are almost certainly losing many of the customers that your marketing efforts brought in just a short time before.
The factors driving resource gains are typically quite different from those driving losses, so you stand little chance of solving these challenges without distinguishing between the two flows.
Always try to identify resource “gain” and “loss” rates separately.
External Resources
Trying to build resources can be frustrating. For example, take hiring: Suitable staff may be scarce, and you may have to fight your competitors for the limited number of good people. Even if you win that battle or you have no strong competitors, potential staff may be looking at other opportunities that have nothing to do with the market in which you operate. A customer service person at Ryanair could leave to work in a hotel or even to become a teacher, for example.
At least with staff, there may be a continuous stream of new talent coming onto the market. Many other resources are finite. Once everyone has a cell phone, for example, there is no one left to be won and sales efforts have to switch to upgrades and luring people away from rivals. Similarly, chain stores run out of new locations, airlines run out of good routes that passengers may want to fly, and so on.
To capture this phenomenon, we need to be explicit about the stock of potential resources as well as the stock of developed resources, plus the rate at which we convert one to the other. Figure 3.7 "Developing Potential Locations for a Retail Chain" shows these elements for a new retail company that has developed a specialty store format and now wants to build outlets in all the towns where it may be successful. On the left are the towns thought to have enough of the right consumers to provide the demand for the stores; there are 100 of these at the outset. On the right is the increasing number of stores operating, and in between is the rate at which stores are being opened.
Identify the scale of potential resources—just how many are there in the potential pool?
Assess the rate at which the potential resource can be developed.
Look for ways to accelerate this development rate.
Look to stimulate growth of the potential resource itself.
The story of Alibaba.com in Chapter 1 "Performance Through Time" is a great example of a company identifying a specific potential resource—the large number of smaller Chinese companies seeking to go global—and developing that potential very rapidly. Once that opportunity was well exploited, it moved on to repeat the trick in other markets.
Resources Within the Business
The challenge of resource development is not confined to the bringing of potential resources into your business system: Certain resources must continue to be developed within the organization. The most common of these is staff, though the same challenge also applies to products and customers.
Figure 3.8 "The Staff Promotion Chain" shows an organization that has become badly out of balance because the flows of people through its internal development chain have been running at the wrong rates. At the most senior levels, promotions appear to be happening slowly, at just six per year. But turnover among senior staff is also low, so the upper ranks have become crowded.
The organization has clearly been promoting experienced staff to senior positions faster than other senior people have been leaving. But things are not quite that simple. Promoting 6 experienced people out of 50 each year, as we were in year 1, meant that experienced people had to wait more than 8 years for
promotion. By the time we get to year 5, the wait has grown to 20 years, because of the 100 experienced staff we have; only 5 are promoted each year. So reducing the promotion rate risks leaving experienced staff frustrated and may increase the rate at which they leave. Juniors, on the other hand, are not being hired fast enough to replace those who are leaving or are being promoted.
Doing It Right: Conserving Resources
Figure 3.8 "The Staff Promotion Chain" illustrates a further critical principle when resources flow from state to state. The sum of these stocks must add up to the total number of staff. They are said to be “mutually exclusive” (i.e., any resource item can appear in only one state at any time) and “collectively exhaustive” (i.e., taken together, they account for all of this resource in the system)—a principle known as MECE (pronounced “mee-see”).
This principle is easily overlooked. It is common, for example, for management to continue talking about a market’s total potential even after most of that potential has already been taken up.
This is why some companies pursue a seemingly perverse staff policy known as “up or out,” in which people are expected to seek promotion and are helped to leave if they are not successful. This can apply all the way up to top levels, where retirement or moving on to other organizations is also encouraged. The policy is all about making space for talented people to progress.
The “Choice Chain”
The last extension of this resource development idea concerns an almost universal phenomenon: the development of awareness, understanding, and choice among customers, employees, investors, donors, and other stakeholder groups (Desmet et al., 1998; Finskud, 2009).
and a tank of “loyal” consumers; rather, consumers move through a series of stages (Figure 3.9 "The Choice Chain for Consumers"):
Initially, the consumers who we may want will be unaware that our brand exists. The first challenge is
to pump them into being aware: ensuring that they will have at least heard of the brand, even if it means nothing to them.
Once they are aware, we need them to understand the brand and associate meaning with it—
preferably a meaning relating to values that are significant for them.
When they understand that the brand means something they can relate to, we can hope that they will
try the brand, at least on a disloyal basis. They may continue purchasing competing brands, but at least we are on their list of options.
Ideally, we would like consumers to be loyal and always choose our brand. This “certain future
choice” is rare, but highly valuable if it can be achieved. Coca-Cola itself has attained this status for many consumers, as have brands such as BMW, Wal-Mart, and CNN.
Now, these pumps are expensive to drive. Every advertising and promotional activity costs money, so it is vital to make judicious choices about which ones to drive and how fast, and how to change priorities as time passes. Moreover, while you are trying to do all this, your pool is draining back down the hillside: Consumers are forgetting why your brand is important to them, choosing to buy other brands, or simply forgetting about it altogether, hence the continuing efforts of even the strongest brands to keep
reinforcing consumer choice.
Figure 3.9 The Choice Chain for Consumers
will not do; you need to know how much of each activity to do at each moment. Many firms get these choices badly wrong.
One innovative industrial products firm consistently underinvests in all stages of this chain. The only reason it can boast of the high proportion of sales derived from new products is that this underinvestment forces sales managers to switch their effort from older products to the latest novelty. No sooner has the company pumped customers to within reach of becoming loyal then it abandons the effort and they slip back down again into the arms of grateful rivals!
In contrast, the pharmaceutical industry commonly overspends on sales. Sales representatives constantly struggle to get to see doctors who already prescribe their product and fully intend to continue doing so. With everyone in the industry making the same futile efforts, it is hardly surprising that one study found only 20% of sales calls in the United States even got to see the doctor and less than half of these calls were remembered (Elling, Fogle, McKhann, & Simon, 2002).
Similar development chains arise for other resources (Sterman, 2000, chap. 12). For some, however, such as product development, you have direct control over how individual items move through the system. Nevertheless, it is still important to know the quantity of resources at each stage and be aware of how your decisions are affecting their development. It is common, for example, for companies to invest effort and cost in developing promising products, only to fail to finalize them and drive them into the market.
Action Checklist: Developing Resources
Work out what is happening over time to the quantity of your resources and what you want to happen in the future. How are the flows of each resource changing? Can you complete a chart like Figure 3.3 "The Change in Customer Numbers Over Time" for your customers, staff, and other critical resources?
Understand the scale of potential resources you are developing. In the case of customers, useful questions to ask include the following:
How many potential customers are there?
Does this scarcity impose any constraints on the rate at which you can develop customers in future?
Is anything happening to the potential customer pool itself? For example, are your efforts and those of
What exactly defines this overall population? Who are they, and how many of them are there in total?
Again, what distinct stages do they move through?
How many are in each stage, and at what rate are they moving up and down the chain?
Do the numbers add up? Everyone in your defined group should be in one stage and one stage only, at
any moment.
Is anything happening to the group overall? Are demographic changes bringing new potential
customers into existence?
And, of course, what are you doing, to what extent, that influences these flows, and by how much?
Chapter 4
Overview
The way that resources increase or decrease through time is critical, and resources always rely on one another. Existing resources either enable growth in other resources or constrain it. This mutual reliance can even lead the whole system to collapse.
The next step is to show how these mechanisms make resources complementary and explore the implications of this interdependence over time. This chapter will do the following:
show how resources can drive their own growth
explain how growing a resource depends on the availability of other resources, creating
self-reinforcing feedback that can drive rapid growth or lead to collapse
describe how having too little of one resource can constrain another’s growth but
also protect against decline
highlight the impact of these interdependences on performance through time
4.1 Gaining and Maintaining Resources
So far we have learned the following:
Understanding and managing performance through time is the key challenge for management
(Chapter 1 "Performance Through Time").
Performance depends on resources: items that fill and drain (Chapter 2 "Resources: Vital Drivers of
Performance").
The way that resources flow into and out of the organization, and from stage to stage, is critically
important and difficult to manage (Chapter 3 "Resources and Bathtub Behavior").
The next crucial question is what drives the growth (inflow) and decline (outflow) of resources? There are three factors moving resources into and out of your organization:
2. Outside forces, for example, changes in customers’ needs, shortages of suitable staff, price cuts by competitors, and increases in expected service levels
3. Resources already in place, for example, salespeople to win customers, service people to deliver service and retain clients, and research staff to develop new products.
Decisions Affect Resource Flows
In fact, most of your own decisions—at least those that are likely to affect performance into the future— work by affecting resource flows, either directly or indirectly. You recruit more salespeople to win customers faster, add service capacity to keep customers from leaving, take on engineers to develop products, dedicate human resource (HR) staff to hiring, and so on.
If we start training people today, for example, we do not instantly get better bottom-line performance. The training improves the overall skill of the group over whatever time it takes to cover everyone in the group. Only those people who have been trained can start to deliver improvements, and this takes time. The one impact we do see immediately, of course, is the extra cost! Consequently, it is all too common for organizations to decide on beneficial changes, only to abandon them because they do not see enough immediate benefit to continue. What often gets cut first when performance falters? Training and marketing!
Let us look back at what happened to your restaurant over the past 12 months. Figure 3.6 "The Separate Flows of Customers Into and Out of Your Regular Customer Group" showed the inflow and outflow of regular customers. The decisions involved were to increase marketing spending but then cut back later in the year (Figure 4.1 "Marketing Decisions Change the Inflow of Customers").
Note that we are not looking to explain the impact of marketing on profits, not even on sales. The immediate effect is on the customer win rate, and we need to focus on the numbers: the rate of marketing spending and how much impact it had on the rate of winning new customers. It also seems that our marketing decisions are not quite enough to account for the customer win rate, since we had a trickle of new customers even when we were spending nothing.
We must not forget that such a change in a resource flow is not the only consequence of our decisions. Many will have cost or revenue implications, too. In this case, marketing spending has
an immediate impact on profits, as well as causing other changes (Figure 4.2 "The Impact of Changed Marketing Spending on Profits").
When you increased spending in month 7, profits dropped by the amount you decided to spend. Profits grew quickly after you implemented this decision, so something else must have happened. But
the immediate effect was a sharp drop: no delays or bathtubs filling in this part of the system, just simple arithmetic. The same applies to the decision in month 10 to cut marketing spending. The profit
rate immediately jumps by the $3,000 per month cut in marketing. Again, however, something else happens soon after to wipe out that profit increase.
Outside Forces Affect Resource Flows
Competitors and other factors also affect the flows of resources into and out of our business. Competitors can even help us develop resources, as we will see in Chapter 7 "Managing Rivalry for Customers and Other Resources". External influences are generally looked at under four categories:
1. Political changes, such as privatization and deregulation, open up entire industries. Some may even act directly on specific aspects of performance, such as price regulation in utility markets.
2. Economic changes constantly bring new customer groups into existence. Fast-developing economies can create conditions in which the inflow to the “potential customer” pool grows extremely rapidly. The opposite occurs when economies contract, as many companies experienced with the banking-led recession of 2008.
3. Social changes drive the migration of consumers, employees, and others into and out of the resource base of different industries. Simple demographic changes bring new young consumers into a potential market each year and of course take them out again as they age.
4. Technological progress largely manifests itself in two ways: changing the functionality of products and reducing the unit cost of offering them. Growing Internet penetration helped Alibaba.com but hurt Blockbuster Inc. in our examples from Chapter 1 "Performance Through Time".
Doing It Right: Stick to the Correct Language
We are often sloppy in our use of language about business, and since we have never been especially conscious of the bathtub behavior of resources there is a particular problem about levels and rates. We might discuss what we can do to increase the “level” of profits, say, or debate whether the “level” of
marketing spending is sustainable. Wrong! Profits and marketing spending are both rates at which money is being made or spent; their units are dollars per month. The only factors that should properly be
referred to as “levels” are resources, plus that rather special factor, price.
This may seem picky, but so long as we are inaccurate in the language we use, we will continue to misunderstand what is going on. And if we misunderstand, we will mis decide!
need to understand the scale and timing of the changes affecting your future. Imagine you run a company producing electronic goods, and you face an economic downturn. You need to know roughly how severe it will be, at what rate it will remove potential consumers from your pool of resources, and to what level. In addition, factors changing other markets can have powerful spin-off effects. TV viewing has fallen as viewers switched their time to online activities, with damaging consequences for advertising revenues. Internet usage in Europe has in turn been depleted by the time people spend sending text messages by mobile phone. These are both examples of quantifiable dynamics—that is, rates of change through time— concerning the influence of substitute products that feature in standard industry forces approaches to strategy (see Chapter 1 "Performance Through Time").
Resources Determine Each Other’s Growth
The most important point about what drives resource flows, however, is that current levels of resources determine the rate at which other resources fill up or drain away. This is the mechanism for which the system dynamics method is ideally suited (Sterman, 2000, chap. 8).
This is the reality of how resources work together; creating a system that can either perform strongly or constrain its own development. Interdependence can even bring about an organization’s self-destruction. Since we know that performance depends on resources, and that only flows of resource can alter these quantities through time, it follows that the only means by which management decisions can change your resources through time is by influencing what happens to the inflows and outflows.
However, as Chapter 2 "Resources: Vital Drivers of Performance" highlighted, you cannot build any resource without using resources already in place. This interdependence has two implications: 1. The more of a resource you currently have, the faster others can grow. (It is even possible for a
resource to generate its own growth, as when, for example, customers recommend their friends become customers.)
2. Conversely, having too little of a resource right now can slow or stop the growth of other resources. If this shortage is too severe, it can even cause other resources to be lost, which is where self-destruction can arise.
The more development engineers you have, the faster you can improve the range and quality of your
products.
The more donors a charity has, the faster it can acquire the cash it needs.
The more good clients a professional firm has, the faster it can win the best staff.
In the cases listed above, if you had none of the first resource, the second would not grow at all unless some other resource could replace it. If you have no salespeople, for example, you will need agents, a Web site, or some other alternative to capture customers. If a charity has no donors, it will need government funding or some kind of endowment to carry on its work.
So how does a new b