Interpretation and Reporting of Process Capability
Results: Focus on Improvement
Suren Behari, Aileen Cater-Steel, Anup Shrestha, Jeffrey Soar School of Management & Enterprise,
University of Southern Queensland Toowoomba, Australia
{Suren.Behari; Aileen.Cater-Steel; Anup.Shrestha; Jeffrey.Soar}@usq.edu.au
Abstract. A global financial services company followed a software-mediated process assessment (SMPA) approach based on ISO/IEC 15504, ISO/IEC 20000 and the IT Infrastructure Library (ITIL®). Using an action research approach, the Incident Management, Problem Management, and Change Management processes were assessed at two points in time during an ITSM process improvement project. This paper analyzes the results of the process assessments, highlights issues with the interpretation of the results, and offers an alternative method to report process capability results to motivate process improvement. The study found that by using the proportion of SMPA recommendations as a proxy measure for process improvement, the processes did improve yielding fewer recommendations in cycle 2 when compared to cycle 1 of the action research.
Key words: ITSM Process Assessment, ISO/IEC 15504, ISO/IEC 20000-4, IT Service Management, Process Improvement.
1 Introduction
Rapid advanced development in IT technologies has created new opportunities for the strategic use of technology for business benefits [1]. Organizations need efficient Information Technology Service Management (ITSM) processes to cut costs, but ironically, in order to implement highly capable processes, there are significant costs involved, both in terms of time and resources. A way to achieve better performing and higher capable processes is to employ methods to compare an organization’s processes against best-practice standards to identify performance gaps and receive guidance to improve the processes. Many of the existing process improvement methods require large investments [2].
A number of best practice frameworks have been created with the foundational goals of creating measures/processes to control, monitor and evaluate activity in the organization. The prevailing view of IT governance is that the outcomes or focus of these measures is to create strategic alignment, risk management, performance management, delivery of business value through IT, as well as capability management [3].
services. Company X is a global services company with over 200 employees, headquartered in Silicon Valley, California USA, with offices in New York, London, Singapore, Tokyo and Bangalore. Company X has about 70 in IT staff fielding incidents, problems and changes in the system. The Assessment team was led by the Director of Engineering at Company X, an experienced scholar-practitioner who was supervised by an accredited SPICE Assessor.
Company X began to scrutinize its IT group’s performance to ensure that it was in line with the overall business performance and contributed to the business’ bottom line. Company X embarked on implementing three ITSM processes: Incident Management, Problem Management and Change Management, and are now looking at improving these processes to lower costs, improve efficiency and offer higher service levels. The business drivers for process improvement are service availability and reliability and for continual improvement.
2 ITSM Process Assessments
Process assessment is described in the literature as a series of steps targeted to compare an organization’s everyday processes with reference processes that comprise typical activities for the process at different capability levels [4]. Process assessments are primarily conducted by organizations to benchmark results against an international standard [5]. The international standard for process assessment ISO/IEC 33002 suggests that process assessments can be used for process improvement or to determine process capability [6]. One of the primary goals of process assessment is to provide guidance to improve processes as suggested in ISO/IEC 33014 that provides a guide for process improvement [7].
Practitioner resources suggest that organizations prefer an easy, cost-effective and timely process assessment mechanism that unveils a realistic indication of process capability [8]. This is particularly true for smaller organizations that are undertaking their first experience with assessments [5].
The Software-Mediated Process Assessment (SMPA) approach to process assessment was chosen to assess the capability of IT service management processes, for its alignment with international standards, its transparency and efficiency, and its ability to objectively measure feedback from stakeholders [9]. The SMPA approach uses online surveys for data collection and a decision support system for analysis and reporting. The detailed design of the SMPA approach is described in [9]. The SMPA approach allocates assessment questions to the survey participants, via an online interface, based on their role within each process: process performers; process managers; and external process stakeholders. Questions are based on the process assessment model (PAM) and sourced from an exemplar PAM for ITSM (ISO/IEC 15504 part 8). The PAM for ITSM [10] consists of a set of base practices to achieve the process outcomes and a set of generic practices for process management (CL2), standardization (CL3), quantitative measurement (CL4) and innovation (CL5) of process capability [9].
standard family of ISO/IEC 33000 series [11]. The references made to ISO/IEC 15504 standards as applied in this research can be viewed as a specific and valid instance of the ISO/IEC 33000 standard series in terms of the process assessment model and the measurement framework [12]. While the new standard series presents a generic and more abstract view of process assessment, it still corresponds to related ISO/IEC 15504 content. The measurement framework defined in ISO/IEC 15504-2 that was used in the SMPA method has been revised but it can be treated as a simpler instance of the new ISO/IEC 33020 standard [13].
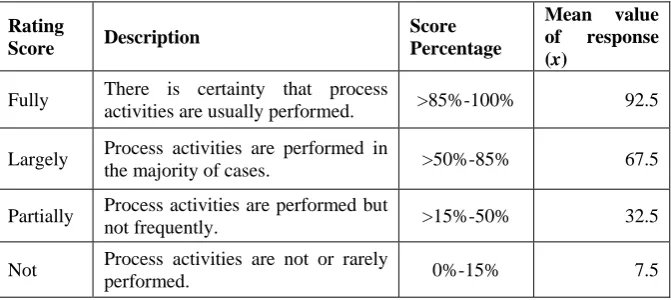
[image:3.595.131.467.293.443.2]The process capability score is calculated from the average rating of all responses and uses the process attribute achievement scale as shown in Table 1. The process capability level can then be derived from the attribute ratings.
Table 1 Process attribute achievement scale Rating
Score Description
Score Percentage
Mean value of response (x)
Fully There is certainty that process
activities are usually performed. >85%-100% 92.5
Largely Process activities are performed in
the majority of cases. >50%-85% 67.5
Partially Process activities are performed but
not frequently. >15%-50% 32.5
Not Process activities are not or rarely
performed. 0%-15% 7.5
[image:3.595.130.466.530.690.2]The SMPA tool generates recommendations for every question for PA1.1, and from PA2.1 onwards recommendation items are only generated when the process rating score is Partially (P) or Not (N). For PA1.1 questions are specific to the process, while from PA2.1 onwards the same questions are used for all processes. The detailed design and architecture of the SMPA approach has been previously published [2]. Table 2 shows the number of questions and recommendations (knowledge items) per process attribute.
Table 2 Process Attribute Assessment Questions and Knowledge Items
Process Attribute No. of
Questions
No. of Knowledge
Items
% Knowledge Items/ No. of
Questions
PA1.1 Incident Management 8 8 100.0
PA1.1 Problem Management 11 11 100.0
PA1.1 Change Management 14 14 100.0
PA2.1 Performance Management
24 21 87.5
PA2.2 Work Product Management
14 13 92.9
PA3.1 Process Definition 14 11 78.6
PA3.2 Process Deployment 13 9 69.2
3 Methodology
This research followed the cyclical process of action research to systematically measure ITSM process capability at two points in time. Company X decided to assess three ITSM processes: Incident Management, Problem Management and Change Management. Employees who were actively involved in each process at Company X were purposively selected for the study. The participants were drawn from five business units: Business Support, Operations, Trading Solutions, Execution Services, and Program Management. The research involved the measurement of three components: process capability, process performance and financial performance.
For this study, two rounds of data were collected from multiple primary and secondary sources [14] for the six month period 1 May 2015 to 31 October 2015, and 1 May 2016 to 31 October 2016. Qualitative methods were applied in the form of interviews, focus groups and observation [15]. In addition, quantitative methods used data from online surveys and the case company’s internal systems to measure process performance and calculate costs.
The process capability measurement was facilitated by the use of the SMPA method. Although ISO/IEC 15504 provides for capability levels from zero (incomplete) to five (optimizing), only questions relating to level 1 (performed), level 2 (managed) and level 3 (established) of the SMPA tool were used, as it was anticipated from observation that the case organization was not performing higher than level 3.
The questionnaire data collection used the SMPA approach to enable the researcher and case study organization to assess ITSM process capability. The SMPA tool was hosted by an industry partner Assessment Portal Pty Ltd that specializes in online assessment services. Details of the case and the SMPA method have been presented in a previous paper [16].
4 Findings – Assessment Results
4.1 Assessment 1 – 2015
All three processes achieved process capability level 1. Process activities are performed. The process achieves its purpose but in a non-repeatable way and with few controls. During each instance, the process is not implemented in a managed fashion (planned, monitored, and adjusted). Work Products are not appropriately established, controlled, and maintained. Moreover, the way the process is managed is not uniform throughout the organization.
Incident Management
Table 3 Incident Management Process Assessment Results
Level 1 Level 2 Level 3
Profile PA1.1 Process Performance PA2.1 Performance Management PA2.2 Work Product Management PA3.1 Process Definition PA3.2 Process Deployment Rating Score % of
responses 93% 93% 93% 93% 93%
Problem Management
[image:5.595.131.467.347.440.2]Problem management had 84 percent valid assessment survey responses. Less than 1 percent of participants did not understand the questions and 16 percent did not know the answer to questions. All 21 invited survey participants completed the Problem Management assessment. The Process Performance attribute (PA1.1) scored Largely, while all other process attributes scored Poorly. The summary of the assessment results for the Problem Management process is shown in Table 4.
Table 4 Problem Management Process Assessment Results
Level 1 Level 2 Level 3
Profile PA1.1 Process Performance PA2.1 Performance Management PA2.2 Work Product Management PA3.1 Process Definition PA3.2 Process Deployment Rating Score % of
responses 100% 100% 100% 100% 100%
Change Management
In order to generate the assessment profile for Change Management, 80 percent of assessment survey responses were considered. 29 percent of participants chose the Do not know option while less than 1 percent did not understand the questions. Out of the 46 invited participants, 1 participant did not attempt the survey. The summary of the assessment results for the Change Management process is shown in Table 5.
Table 5 Change Management Process Assessment Results
Level 1 Level 2 Level 3
Profile PA1.1 Process Performance PA2.1 Performance Management PA2.2 Work Product Management PA3.1 Process Definition PA3.2 Process Deployment Rating Score % of
responses 98% 98% 98% 98% 98%
Improvement Plan
[image:5.595.131.468.526.618.2]The recommendations for all three processes were discussed in detail, and a draft process improvement plan was developed at the workshop. Examples of some of the action items for process improvement are presented in Table 6.
Table 6 Examples of action items for process improvement ITSM Process Action Plan
Incident Management
Review Zendesk® (a cloud-based customer service platform used by Company X) for the incident logging workflow and communicate policy to field.
Train Business Support staff on how to prioritize incidents. Problem
Management
Establish an Operating Level Agreement (OLA) between Engineering and Support, to set expected turnaround times for problem resolution.
Ensure that all problem resolutions go through Quality Assurance (QA) and Change Management.
Change Management
Change the organization structure to relocate the Trading Solutions business unit from Sales to Engineering at Company X, so that all involved with Change Management follow the same procedure.
Add a mandatory field to Zendesk to force one to enter the classification of proposed changes
4.2 Assessment 2 - 2016
In cycle 2 of the action research, process managers were more comfortable with identifying areas of process improvement and more enthusiastic about discussing challenges and implementing the process improvement plans. Less time was spent on planning meetings when compared to cycle 1. Process managers appeared to be complacent about the results of cycle 2, as they were aware of the effort put in to improve processes. Despite these effors, the second assessment reported that all three processes were still rated at capability level 1.
Incident Management
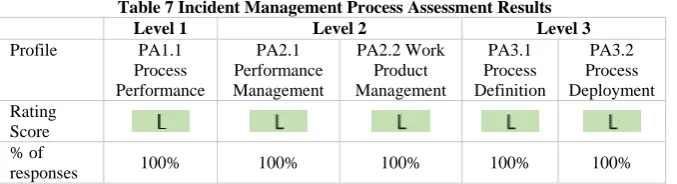
[image:6.595.130.469.586.678.2]The generated assessment profile for Incident Management considered 81 percent of assessment survey responses as valid answers as 19 percent of respondents selected the Do not know option. All process attributes scored Largely. The summary of the assessment results for the Incident Management process is shown in Table 7.
Table 7 Incident Management Process Assessment Results
Level 1 Level 2 Level 3
Profile PA1.1 Process
Performance
PA2.1 Performance Management
PA2.2 Work Product Management
PA3.1 Process Definition
PA3.2 Process Deployment Rating
Score % of
Problem Management
[image:7.595.132.466.219.313.2]Problem management had 90 percent valid assessment survey responses. All participants understood the questions with 10 percent choosing the Do not know option. All process attributes scored Largely. The summary of the assessment results for the Problem Management process is shown in Table 8.
Table 8 Problem Management Process Assessment Results
Level 1 Level 2 Level 3
Profile PA1.1 Process
Performance
PA2.1 Performance Management
PA2.2 Work Product Management
PA3.1 Process Definition
PA3.2 Process Deployment Rating
Score % of
responses 100% 100% 100% 100% 100%
Change Management
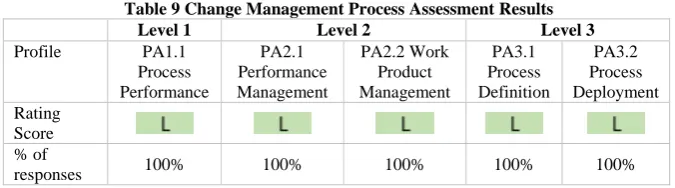
Eighty percent of assessment survey responses were considered in generating the assessment profile for Change Management. The Do not know option was selected by 20 percent of participants while less than 1 percent did not understand the question. All process attributes scored Largely. The summary of the assessment results for the Change Management process is shown in Table 9.
Table 9 Change Management Process Assessment Results
Level 1 Level 2 Level 3
Profile PA1.1 Process
Performance
PA2.1 Performance Management
PA2.2 Work Product Management
PA3.1 Process Definition
PA3.2 Process Deployment Rating
Score % of
responses 100% 100% 100% 100% 100%
5 Discussion
Management at Company X was interested in the results of the 2nd assessment to see if the actions taken had resulted in improvements to the capability of processes. Although the process attributes of Problem Management improved significantly, there was no change to the capability levels of any of the processes or the attribute ratings for Incident Management and Change Management.
5.1 Comparison of Assessment Results
[image:7.595.128.466.395.489.2]related to Problems at Company X, there was a lack of knowledge of the Problem Management process by employees. Table 10 shows the comparison of process attribute ratings for assessment 1 and assessment 2.
Table 10 Comparison of process attribute ratings for assessment 1 and assessment 2
A
ssessm
en
t Level 1 Level 2 Level 3
PA1.1 Process Performance
PA2.1 Performance Management
PA2.2 Work Product Management
PA3.1 Process Definition
PA3.2 Process Deployment Incident Management
1 2
Problem Management 1
2
Change Management 1
2
Based solely on the process attributes, it is not evident whether there was a process capability improvement or not.
In discussion with Senior Management at Company X, an alternative approach was found to explore and report on the extent of process improvement in the 12 months between the initial and second assessment. A comparative analysis of the number of recommendations from the ITIL guidelines was conducted to determine if process capability improved year-over-year. These recommendations generated by the SMPA tool are closely aligned with the ISO/IEC 20000-4 [17] process reference model (PRM).
Incident Management
Figure 1 shows a comparison of the number of recommendations for assessment 1 and 2 for Incident Management. In assessment 1 and assessment 2 there were no recommendations for Process Performance (PA1.1).
recommendations, with none for assessment 2. This indicates that the incident management process improved from assessment 1 to assessment 2.
[image:9.595.134.464.194.346.2]Figure 1 A comparison of the number of recommendations between assessment 1 and 2
for Incident Management
Problem Management
Figure 2 A comparison of the number of recommendations between assessment 1 and 2 for Problem Management
Change Management
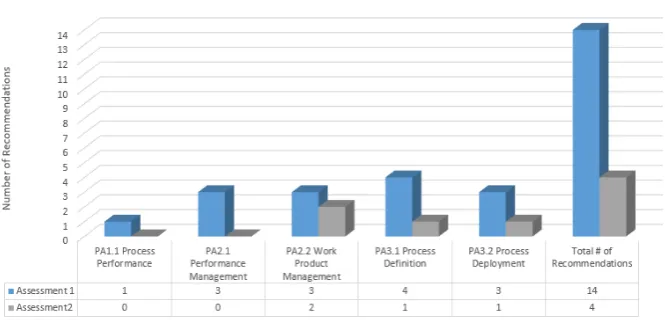
The Attribute Rating Scores for Change Management were identical for assessment 1 and assessment 2. However, a breakdown of the number of recommendations year-over-year revealed that the process improved in cycle 2. Figure 3 shows a comparison of the number of SMPA recommendations for assessment 1 and 2 for Change Management.
Figure 3 A comparison of the number of recommendations between assessment 1 and 2
for Change Management
[image:10.595.131.464.442.604.2]Work Product Management (PA2.2) had three recommendations for assessment 1 with two for assessment 2. Process Definition (PA3.1) had four recommendations for assessment 1 with one for assessment 2, and Process Deployment (PA3.2) had three recommendations in assessment 1 with one for assessment 2.
Summary of Process Improvement
At the Process Performance (PA1.1) level every survey question had a corresponding one-to-one knowledge item. However at higher process attributes the same knowledge item was used for multiple questions in a number of instances since some of the questions were closely related and could be addressed by a single knowledge item. At Process Performance (PA1.1) level the recommendations are specific to the process in question. From Performance Management (PA2.1) onwards, the recommendations are developed as general guidelines that may apply to any process.
The average of the number of recommendations as a percentage of the total number of knowledge items for each process was used as the Key Performance Indicator (KPI) and incorporated into a model to link Process Capability, Process Performance and Financial Performance.
Table 11 shows the average percentage of recommendations over both assessments for the Incident Management, Problem Management, and Change Management processes, respectively. The average recommendation ratio decreased considerably from cycle 1 to cycle 2 demonstrating process improvement.
Table 11 Average Recommendation Ratio for all Processes Incident Management Problem Management Change Management Process Attributes # of Knowle dg e It em s Ass ess m e nt 1 Ass ess m e nt 2 # of Knowle dg e It em s Ass ess m e nt 1 Ass ess m e nt 2 # of Knowle dg e It em s Ass ess m e nt 1 Ass ess m e nt 2
PA1.1 Process Performance 8 0 0 11 0 0 14 1 0 PA2.1 Performance
Management
21 3 0 21 11 0 21 3 0
PA2.2 Work Product Management
13 0 0 13 8 0 13 3 2
PA3.1 Process Definition 11 4 0 11 10 4 11 4 1
PA3.2 Process Deployment 9 2 0 9 5 3 9 3 1
Total # of Knowledge Items 62 65 68
Total # of Recommendations
9 0 34 7 14 4
Average Recommendation Ratio
Although there was no change in the capability levels, process capability improved for all three processes as measured by the comparison of the number of recommendations in the process capability assessment reports in cycle 1 and 2. In particular, of the 62 potential recommendations for the Incident Management process, no recommendations were present in the assessment report in cycle 2 compared to nine recommendations in cycle 1. The Problem Management process was presented with 34 of the 65 potential recommendations in cycle 1, while only seven recommendations were presented in cycle 2. The Change Management process decreased from 14 recommendations in cycle 1 to four in cycle 2 out of a potential of 68 recommendations.
Combining the recommendations for improvement across the three processes showed an improvement in the total recommendations for improvement from 57 in cycle 1 to 11 in cycle 2.
Therefore, consistent with previous studies [18, 19], this study found that improving processes results in higher process capability attainment, as evident by a reduction in the number of recommendations for improvement.
6 Conclusion
In the context of the process improvement program at Company X, where only three processes were assessed, the Process Managers at Company X held the view that the process attribute ratings generated by the SMPA tool based on the four-point NPLF scale, were not sufficiently informative and representative of the process improvement gained for the three processes examined. The NPLF scale provided a good foundation, but the recommendations offered more granularity for process improvement for Company X. The decrease in the number of recommendations (assessment indictors) as a proxy measure of process improvement was more meaningful, and representative of the improvement achieved at a more granular level. It is interesting to note that the revised version of the process assessment standard (ISO/IEC 33020) provides finer granularity (than ISO/IEC 15504) with an option to report process attribute achievement on a six-point scale: N, P-, P+, L-, L+, F [13]. Future research will map the SMPA results to the new six point scale to explore its utility.
The inability to access the raw scores for the assessment was a limitation, as the SMPA tool normalized the arithmetic mean of survey responses to the NPLF rating scale. The assessment results may have been more accurate if the actual raw data were used to determine the capability level. This may have led to a different process improvement plan at Company X. To overcome this limitation, the novel approach of using the average number of knowledge items reported was undertaken for this study. Future research can use the actual data to determine process capability. The approach of using the recommendation ratio may be applied to tradition or manual process assessments as well.
A unique contribution of this research is the use of the number of recommendations as a proxy measure of process improvement rather than capability level or attribute achievement.
6.1 Implications to Researchers and Practitioners
The research contributes to the body of knowledge on ITSM process capability, by using a standards-based maturity model, ISO/IEC 15504 for the measurement of process capability, and adapting it to provide a fit-for-purpose measurement model. The adaption was to use the variation in the number of recommendations (generated by the SMPA report) based on process attributes to determine improvement in process capability rather than the process capability level. The account of the use of a transparent, efficient tool (SMPA) for process assessment contributes to the literature on process assessments.
The practical contribution of the research is that it offers an example from which other organizations can learn to measure their ITSM Process Capability for ITSM Process improvement.
Note. ITIL® is a Registered Trade Mark of AXELOS Limited and Zendesk® is a registered trademark of Zendesk Inc.
References
1. Galliers, R.D. and D.E. Leidner, Strategic Information Management: Challenges and Strategies in Managing Information Systems. 2014, New York, NY USA: Routledge.
2. Shrestha, A., Development and evaluation of a software-mediated process assessment approach in IT service management, in Faculty of Business, Education, Law and Arts. 2015, University of Southern Queensland.
3. De Haes, S. and W. Van Grembergen, IT governance and its mechanisms. Information Systems Control Journal, 2004. 1: p. 27-33.
4. Barafort, B. and A. Rousseau. Sustainable Service Innovation Model: A Standardized IT Service Management Process Assessment Framework. in European Conference on Software Process Improvement. 2009. Alcala de Henares, Spain: EuroSPI.
5. Juran, J. and A. Godfrey, Juran's Quality Handbook. 1999, McGraw-Hill: New York, NY USA.
6. ISO/IEC, ISO/IEC 33002:2015 Information technology -- Process assessment -- Requirements for performing process assessment. 2015, International Organization for Standardization: Geneva.
7. ISO/IEC, ISO/IEC 33014:2013 Information technology -- Process assessment -- Guide for process improvement. 2013, International Organization for Standardization: Geneva.
9. Shrestha, A., et al. Software-mediated process assessment for IT service capability management. in 22nd European Conference on Information Systems. 2014. Tel Aviv, Israel: ECIS.
10. ISO/IEC, ISO/IEC TS 15504-8 Information Technology - Process Assessment - Part 8: An Exemplar Process Assessment Model for IT Service Management. 2012, International Organization for Standardization: Geneva, Switzerland. 11. ISO/IEC, ISO/IEC JTC1/SC7 WG10 Transition from ISO/IEC 15504 to
ISO/IEC 330xx, in Standing Document. 2017, International Organisation for Standardisation.
12. Shrestha, A., et al., Benefits and relevance of International Standards in a design science research project for process assessments. Computer Standards & Interfaces, 2018.
13. ISO/IEC, ISO/IEC 33020:2015 Information technology -- Process assessment -- Process measurement framework for assessment of process capability. 2015, International Organization for Standardization: Geneva.
14. Myers, M., Qualitative research in business & management. 2008, Thousand Oaks, CA USA: SAGE Publications Limited.
15. Oates, B.J., Researching Information Systems and Computing. 2006, London: SAGE.
16. Shrestha, A., et al. Evaluation of software mediated process assessments for IT service management. in International Conference on Software Process Improvement and Capability Determination. 2015. Springer.
17. ISO/IEC, ISO/IEC TR 20000-4:2010 – Information Technology – Service Management – Part 4: Process Reference Model. 2010, International Organisation for Standardisation: Geneva, Switzerland.
18. Cater-Steel, A., M. Toleman, and T. Rout, Process improvement for small firms: An evaluation of the RAPID assessment-based method. Information and Software Technology, 2006. 48(5): p. 323-334.