City, University of London Institutional Repository
Citation
:
Sevastjanova, R., Becker, F., Ell, B., Turkay, C. ORCID: 0000-0001-6788-251X,
Henkin, R. ORCID: 0000-0002-5511-5230, Butt, M., Keim, D. and Mennatallah, E-A. (2018).
Going beyond Visualization. Verbalization as Complementary Medium to Explain Machine
Learning Models. Paper presented at the VIS Workshop on Visualization for AI Explainability
(VISxAI), 22 October 2018, Berlin, Germany.
This is the accepted version of the paper.
This version of the publication may differ from the final published
version.
Permanent repository link: http://openaccess.city.ac.uk/21848/
Link to published version
:
Copyright and reuse:
City Research Online aims to make research
outputs of City, University of London available to a wider audience.
Copyright and Moral Rights remain with the author(s) and/or copyright
holders. URLs from City Research Online may be freely distributed and
linked to.
City Research Online:
http://openaccess.city.ac.uk/
[email protected]
Going beyond Visualization: Verbalization as Complementary
Medium to Explain Machine Learning Models
Rita Sevastjanova1, Fabian Beck2, Basil Ell3, Cagatay Turkay4,
Rafael Henkin4, Miriam Butt1, Daniel Keim1, Mennatallah El-Assady1,5 1University of Konstanz, Germany
2University of Duisburg-Essen, Germany 3Bielefeld University, Germany 4City University of London, UK
[image:2.612.80.540.219.377.2]5University of Ontario Institute of Technology, Canada
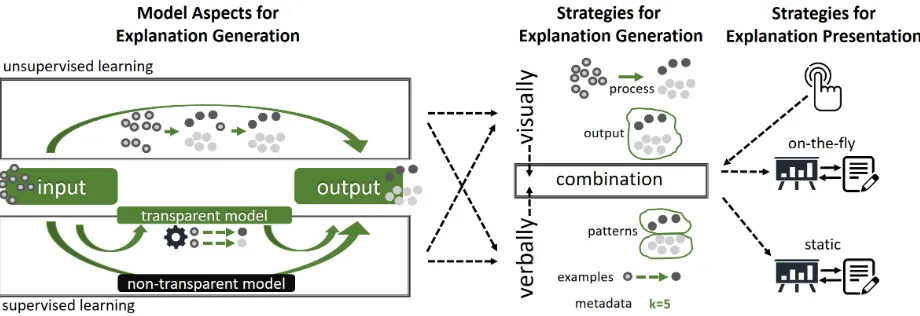
Fig. 1: Our design space maps out the aspects of a machine learning model thatcan be explainedthrough visualization and verbalization techniques, and discusses strategies on how these explanations can be achieved. We argue that certain aspects of a model are more suitable to be explained visually, some verbally, but most importantly, through effective combinations of both. The combinations can be curated by the user (e.g., the visual and verbal components are generated on-the-fly), or can be predefined (e.g., where both visualization and text are static), and they can emphasize different concepts such as the algorithmic process, key individual examples, or patterns observed in the output.
Abstract—In this position paper, we argue that a combination of visualization and verbalization techniques is beneficial for creating broad and versatile insights into the structure and decision-making processes of machine learning models. Explainability of machine learning models is emerging as an important area of research. Hence, insights into the inner workings of a trained model allow users and analysts, alike, to understand the models, develop justifications, and gain trust in the systems they inform. Explanations can be generated through different types of media, such as visualization and verbalization. Both are powerful tools that enable model interpretability. However, while their combination is arguably more powerful than each medium separately, they are currently applied and researched independently. To support our position that the combination of the two techniques is beneficial to explain machine learning models, we describe the design space of such a combination and discuss arising research questions, gaps, and opportunities.
Index Terms—Verbalization, Visualization, Explainability, Interpretability, Machine Learning
1 INTRODUCTION
According to Mohri et al. [17, p. 1], machine learning (ML) “can be broadly defined as computational methods using experience to improve performance or to make accurate predictions.” It is a powerful tool to solve complex problems; thus, it has been applied to a variety of fields such as machine translation, image recognition, patient diagnos-tics, spam and malware filtering, fraud detection, customer support, etc. ML systems are generallyblack boxesas they usually provide no
ex-Manuscript received xx xxx. 201x; accepted xx xxx. 201x. Date of Publication xx xxx. 201x; date of current version xx xxx. 201x. For information on obtaining reprints of this article, please send e-mail to: [email protected]. Digital Object Identifier: xx.xxxx/TVCG.201x.xxxxxxx
planation as to how the models evolve in the training phase, nor how the predictions are made. However, in various fields, explainability is crucial, as it makes reasons governing predictions transparent, high-lights capabilities and limitations of learned models and enables their improvement.
More formally, explainability (frequently called interpretability, un-derstandability) is “the degree to which a human can understand the cause of a decision.” [2], and Ehsan et al. [5] write that an explanation focuses on sequential problems and is grounded in natural language communication. The concept of explainability has gained more and more relevance in the recent years, as evidenced, for example, by the explainable AI DARPA program1– a program with a goal to generate a set of methods to provide developers different design options in creat-ing an understandable representation of ML models.
Explanations of ML models can have many facets. Krause et al. [10] argue that, while a ML technique is often defined as being more or less interpretable, it is hard to assign a level of interpretability to the whole class. The aspects to be explained depend on various factors such as the learning type of a model (e.g., supervised vs. unsupervised), the model’s type (e.g., decision tree vs. neural network), the task, and also user preferences and expertise. This will also impact the methods that are used to generate explanations: explainability methods can be model-agnostic [23] or specific to a type of model.
Several media can be utilised to explain ML models. Most com-monly used techniques are visualizations [7, 13, 14, 29, 32] with also verbalization [5, 8, 27] being frequently considered in explaining model decisions. In the state-of-the-art applications for explainable ML, these techniques are used separately. In 2007, Google Sheets2presented a new feature calledExploreto enable users ask questions in a natural language regarding the data and gather insights presented visually and verbally. Although it only presents statistics of the data, it is a nice use case for an effective combination of the two media. We argue that a combination of visualization and verbalization techniques is also ben-eficial for creating a more comprehensive and more versatile insight into a ML model’s working mechanisms. The combination not only supports a better understanding of the transmitted message and more robust decision making, but also integrates complementing advantages of the two techniques. For instance, while a visualization represents a powerful means of summarizing a large amount of information, natu-ral language has evolved over the millenia precisely in order to explain complex patterns across space and time. Commonly, visualizations contain some level of natural language (e.g., in the title or labels). In their recent survey on Natural Language Generation (NLG), Gatt and Krahmer [6] write that “Other important dimensions [...] include the role of graphics in text, an area where there is the potential for further interaction between the NLG and visualization communities, address-ing such questions as which information should be rendered textually and which can be made more accessible in a graphical modality [...].” We propose a deep combination of visualization and verbalization to explain ML models and their decisions.
In this position paper, we introduce a design space that presents the scope and the benefit of combining visualization and verbalization techniques to explain ML models. The combination is not trivial; for different models, tasks, and user preferences, the best solution needs to be determined. Furthermore, we discuss open research questions and motivate researchers to work on potential solutions.
2 BACKGROUND ANDRELATEDWORK
In this section, we describe existing techniques to explain ML mod-els. Here, we look at visualization and verbalization approaches sepa-rately, as for ML model explainability they are currently applied and researched independently.
2.1 Visualization
Many visualization techniques have been developed to help experts bet-ter understand ML models [14]. By designing perceptually effective visual representations, one can enable efficient, accurate, and trustwor-thy interpretations [10].
The choice and design of techniques depends on the ML approach and the explanation model. In supervised learning, it is possible to use bothwhite boxandblack boxmodels. Some interactive visualiza-tions for the white box model have focused on helping users to take informed decisions when building models through algorithmic support, such as the BaobabView [29] system for interactive construction and analysis of decision trees, the partition-based framework for regression models [19], and parallel coordinates for association rule mining [30]. Network-based techniques [7] represent a neural network as a directed acyclic graph (DAG). In this case, size, color, and glyphs can be used to encode important information from the network, such as neurons or connections between neurons belonging to different layers [14].
2https://www.google.com/sheets/about/ accessed on the 5th of August 2018
Due to the complexity of neural networks, research has also focused oninterpretationmethods that enable visualizing the structures to improve the performance of these models. Examples include techniques that map the structure into pixel space [32] and clustering techniques for layers and neurons [13].
For black box models, popular approaches include using dimension-ality reduction techniques such as t-SNE [15] and Principal Compo-nent Analysis (PCA) [9] to visualize the relationship between input and output with point-based techniques [31]. For image classifiers, saliency [26] and gradient maps [24] are also used to identify the most important parts of the input that affect a prediction.
2.2 Verbalization
According to Reiter et al. [22, p. 1], NLG “focuses on computer systems that can produce understandable texts in English or other human lan-guages.”. Generating verbalized explanations has been explored in the context of ML with different paradigms. In human-robot interaction,AI rationalizationconsists of using NLG to explain agent behaviour. Ehsan et al. [5] state that this process has several potential benefits over other explainability techniques. Firstly, explanations in a natural language are intuitive to humans, which can lead to a higher level of satisfaction, con-fidence, and willingness to use autonomous systems. Secondly, rational-ization is fast, thus appropriate for real-time human-agent collaboration. Natural language explanations have been investigated in rule-based systems and classifiers, where a major challenge is deciding which aspects should be explained, a problem that we address in further sections. Stumpf et al. [27] test three types of explanations in e-mail classification: why a rule has been applied, which keywords triggered a rule, and which similar e-mails direct the classification. Hendricks et al. [8] explore the use of textual descriptions of images that involve justification for a decision and a visual description of an image, in contrast with explanations that focus only on one of these aspects.
3 ONCOMBINING VISUALIZATION ANDVERBALIZATION FOR
EXPLAINABLEMACHINELEARNING
Explanations of ML models are crucial for various fields and applica-tions. Both visualization and verbalization are powerful means for the explanation of decisions, data relations, and a model’s inner structures. Nevertheless, they both may also work as complementary elements uniting their strength into a single and powerful explanation medium. It is challenging to provide guidelines for the best combination of visu-alization and verbvisu-alization methods, as they depend on several factors. These factors include model specifications, user preferences, user level of expertise, data type, etc. Also, the separation of aspects for visual-ization and verbalvisual-ization is difficult. The speculation of what should be visualized and what verbalized is subjective. Therefore, our paper aims to start a discussion on potentially relevant aspects and motivate further research in this particular field of combining visualization and verbalization techniques for explainable ML.
Several factors favor the combination of visualization and verbaliza-tion techniques to explain ML models. When the complete informaverbaliza-tion describing a model is double-encoded, more user groups might poten-tially be served (those who prefer visualizations and those who prefer verbalization). Borkin et al. [3] performed a study to determine what components of a visualization attract people’s attention, and what infor-mation is encoded into memory. Authors write that “when redundancy is present, to communicate quantitative values (data redundancy) or the main trends or concepts of a visualization (message redundancy), the data is presented more clearly as measured through better-quality descriptions and a better understanding of the message of the visualiza-tion at recall.” They also discuss the importance of textual elements to explain visualizations. In their study, across all visualizations, the ele-ments that were refixated the most were the textual descriptions (e.g., legend, table header row, and title).
ex-ample, one known strength of visualization is to present large volumes of diverse information in compact forms concurrently. This is often achieved with the presentation of trends and patterns through various viewpoints and abstraction levels, which in turn minimizes the need for observing individual data points closely. Verbalization, on the other hand, could be effectively used in explaining specific constraints, rules, or patterns in detail. It can describe particular interrelationships be-tween individual data items and unravel complex concepts better than a visualization. It might thus be appropriate, for a particular case, to em-phasize this strength of visualization in providing high level summaries with detailed and focused explanations achieved through verbalization. To support our position for a combination of both media, we introduce a new design space (shown in Fig. 1). It illustrates which aspects of a model can be explained and which strategies can be used for the gen-eration and presentation of the explanations. To cover more specific aspects, we describe unsupervised and supervised learning separately, and provide application use cases for each in Section 4.
3.1 Model Aspects for Explanation Generation
The aspects of a model to be explained are generally based on two modalities of explanations:white boxortransparent modelsandblack boxorpost-hoc interpretability[10, 12]. Explanations of white box models focus on themodel structure, enabling users to understand the inner mechanisms of models and techniques. Important properties of such a transparent model are simulatability (the final model is transpar-ent and simple enough that a human can interpret its calculations), and decomposability (each part of the model, e.g., inputs, parameters, and calculations, has an intuitive explanation themselves); and algorithmic transparency (the learning algorithm can be understood) [12].
Post-hoc interpretability is focused onmodel representation, that is, an explanation that uses the relationship between the output of a model and the input instead of an explanation of model’s inner working mech-anisms [18]. To explain a black box model, one can learn a transparent model on the predictions of the black box model, or observe changes of model’s predictions when input features are changed [23]. Lipton [12] writes that “common approaches to post-hoc interpretations include natural language explanations, visualizations of learned representations or models, and explanations by example.”
In both modalities, explanations can include validation metrics, the influence of hyperparameters, and overviews of the input data. The next section discusses strategies of how to combine these aspects to generate explanations.
3.2 Strategies for Explanation Generation
Combinations of generated text and visualizations to explain ML mod-els only use their full potential when they complement each other. De-ciding the best representation—visual or verbal—for information re-mains a largely unexplored and open research question. Here we dis-cuss some ideas on how to combine the two methods.
Double—Encoding: The most
straightforward approach to combine visualization and verbalization is to double-encode every relevant aspect of a model. The information redundancy achieved by the two channels could
help users reach a better understanding of the described model.
Overview and Summary: It is
un-likely that a complete double-encoding strategy is the most efficient. Due to the perceptional strength of visualiza-tions for the summarization of a large amount of information, it is a powerful
medium for providing an overview of the relationship between input and output or the model structure. In this case, textual summaries us-ing natural language could facilitate a close examination of the main patterns in the model.
Overview and Metadata: Instead of summarizing the model,
nat-ural language could be used to explain the different aspects of its
metadata. Textual summaries or tables can give an overview of in-put data characteristics (e.g., size of the data, balance of labels), parameters of the machine learning
ap-proach (e.g., number of neuron layers, selected activation function, etc.), the training process (e.g., number of itera-tions), and quality of results (e.g., pre-cision and recall measures).
Overview and Detail: Another
strat-egy is to complement visualization-based overviews with natural language being used to explain individual in-stances of decisions. Explanations could describe features and their rele-vance for a particular decision.
3.3 Strategies for Explanation Presentation
After deciding which level of information should be used by each type of medium, one needs to decide how the specific content should be selected and presented.
Interaction In some cases, the separation of the information for verbalization and visualization tasks can be defined in advance. One important aspect is that the content to be visualized or verbalized frequently depends on the targeted users. Thus, we might enable the user to choose these specifications. Given an interactive user interface where users explore predictions made or steps taken by a model, the visualization and verbalization components could be generated on-the-fly, since generation in advance would be impractical if too many combinations are possible.
Details on Demand:When
visualiza-tion is used to provide an overview of results and verbalization is used for the details, information overload can be minimized by showing details through interactions such as mouse hovering.
This type of interaction works for both types of integration (visualiza-tion into text and text into visualiza(visualiza-tion), as shown in Sec(visualiza-tion 4.1.
Data-Driven Guidance: In addition
to showing an overview, visualization could guide the user through the data or decision space and provide expla-nations of the most interesting items in natural language. Verbalization can
also be used for sensitivity analysis. A text could describewhat-if situ-ations, where potential changes of (classification) results being influ-enced by sensitive data attributes might get highlighted.
Agent-based Dialogue Systems: In
these interactive systems, users are able to specify concrete questions and re-ceive explanations via both channels. Proactive systems can also decide the adequate form based on the flow of the conversation.
Exploration:Users with different
pref-erences or expertise levels might favor different settings. Thus, the user could specify aspects of the model to be ex-plained; additionally, an appropriate medium for the explanation could be selected by the user or suggested by the system.
desirable. The two components have to be tightly integrated in each other; thus, both of them should also use the same design principles. An Interactive Integration of Text
into Visualizations:Currently, the
in-tegration of text into visualization is usually limited to manually created an-notations such as the title of visualiza-tion and its labels. If visualizavisualiza-tion is
used as the main component and text is used to display detailed infor-mation about single decisions or data points, then the integration of text can be done on demand (e.g., on mouse hover). There, however, the location of the textual description needs to be selected carefully as it can influence the perception of the presented information. By interact-ing with the visualization, the textual description can be continuously updated concerning the observed model space.
An Interactive Integration of
Visual-ization into Text:Beck [1] writes that
integration of word-sized graphics into text could avoid additional cognitive load caused by splitting the readers at-tention between figures and text. Such
micro visualizations can act at three levels: at theabstraction level, where the visualization reveals the overall structure of the text; at the
amplification level, supporting, contextualizing, or questioning the writ-ten statements visually; or at thedetail level, by adding new informa-tion to the text [20].
4 APPLICATIONEXAMPLES
In this section, we present several applications where the explanation of a model can be made more versatile using a combination of visu-alization and verbvisu-alization. We cover different model types, such as an explanation of hierarchical clustering results, a decision tree solv-ing the two-class classification problem, and an example of an agent-based dialogue system which is used to question the system regarding k-means clustering results.
4.1 Understanding Clustering Results
Clustering algorithms are unsupervised learning approaches whose goal is the identification of groups of similar objects. Typically, multivariate data is used as an input (i.e., various numeric and categorical variables describing the available data points) and distances of data vectors define similarity. Hierarchical clustering algorithms output a tree structure which shows in which order the algorithm suggests merging the data points into clusters. An advantage over algorithms that produce a flat clustering (i.e., a partition of the data points) is that hierarchical clustering makes transparent the clustering process and allows the user to choose a granularity level without rerunning the algorithm.
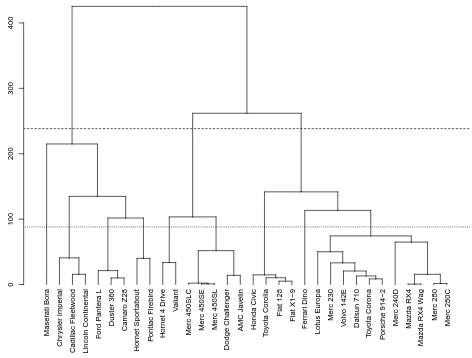
As an application example, Fig. 2 presents a mock-up report, based on a combination ofoverview and metadataandoverview and sum-marystrategies, that represents the hierarchical clustering result visu-ally while providing textual explanations on noteworthy findings and additional information. The first sentence gives an explanation of what the report is about and what clustering algorithm and data have been used. Next, a dendrogram—the established standard visualization for hierarchical clustering results—represents the clustering result and pro-cess. Then, the report suggests cut levels, which are the recommen-dations of an additional analysis of the clustering result to produce a meaningful partition of data points. The final two paragraphs highlight remarkably similar groups of data points. In addition to pointing the reader to these interesting patterns, the explanations also report on con-textual details, for instance, how the data points are similar or dissimi-lar. This information is not visible in the dendrogram and is difficult to extract manually from the raw data.
We envision these reports to be used as part of interactive documents through thedetails on demandparadigm. Users might request explana-tions for results of applied data analysis methods and heuristics by click-ing on the small info icons. These explanations can be tailored accord-ing to the data the method was applied to and illustrataccord-ing examples can be taken from this data. Also, the text can be linked to the dendrogram
0 100 200 300 400 Maser ati Bor a Chr ysler Imper ial Cadillac Fleetw ood Lincoln Continental F ord P anter a L
Duster 360 Camaro Z28
Hor
net Spor
tabout
P
ontiac Firebird Hor
net 4 Dr
iv
e
V
aliant
Merc 450SLC Merc 450SE Merc 450SL
Dodge Challenger AMC J a v elin Honda Civic T o y ota Corolla Fiat 128 Fiat X1−9 F err ar i Dino Lotus Europa Merc 230 V olv o 142E Datsun 710 T o y ota Corona P orsche 914−2
Merc 240D Mazda RX4
Mazda RX4 W
ag
Merc 280
[image:5.612.314.550.82.261.2]Merc 280C
Fig. 2: Example report (mock-up) summarizing the result of a hierar-chical clustering algorithm (unsupervised learning). Symbols i rep-resent options to retrieve on demand additional explanations on the applied procedure or definition. Bold font indicates text that can be interacted with, highlighting an element in the figure or providing addi-tional textual or visual content.
interactively. All bold-font text indicates options for interaction in our example. For instance, we can highlight the respective data point in the diagram when the name of the data point is selected in the text. In addi-tion to simple highlighting, we can generate further explanaaddi-tions on de-mand, for example, when selecting a cluster, describing the cluster size and main variables that discriminate the cluster from other data points, or by letting the user move the cut-line and describe the new clusters (patterns) verbally. One could also provide arguments for decisions as part of the text, e.g.,“Given the suggested cut levels, the number of clus-ters is 3 and 9, which is a good number since this would be well in the limits of human capacity for processing [16]. Thus, if this model is to be used or maintained by humans, this amount of clusters is advised.”
4.2 Explaining Classification Instances
Classification algorithms try to identify which of a set of categories a new observation belongs to. In Fig. 3, visualization is used to present a decision tree model which solves a two-class classification problem. The visual representation shows anoverview of the classified data instances and the tree structure of the model. Here, we might use natural language to describe the decisions made for each data instance separately where a decision is a set of Boolean functions, usually constructed by the syntax likeif... then... else...For example, the user might hover over a data instance to receive detailed information about the features which influenced the particular outcome, such as“This home is classified as San Francisco because its elevation is above 34 feet, the price per square feet is in the range between 1,078$ and 1432$, it has been built before 2009, and...”by using thedetails on demand
paradigm.
Fig. 3: Decision tree which distinguishes homes in New York from homes in San Francisco. On the left hand side, a visualization is used to present an overview of the decisions. On the right hand side, a text described the sensitivity of the model according to used attributes. The visualization example is taken from3.
would lead to the entity being classified differently, thus suggesting sensitivity towards certain changes, or which big changes would not affect the entity’s classification, thus suggesting tolerance towards certain changes. In the example in Fig. 3, the verbalization of the selected entity could contain the following text:“Note that, if the size would be smaller by just 1%, then the entity would be classified not as San Francisco but instead as New York. The classification is relatively stable given the other attributes, where changes only in the range of 50%-72% would affect the classification.” These findings could be discovered through a task that in the NLG literature [6] is referred to asContent Selection. In this task, interesting patterns in the data are searched and added to the content that is to be communicated to the user.
4.3 Agent-based Dialogue System
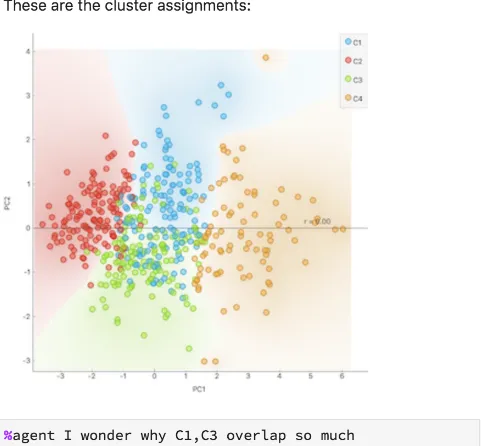
An agent-based dialog system would allow a user to engage in a conver-sation with a cognitive agent in natural language for the purpose of un-derstanding a ML model or a decision that is made based on that model and to perform explorations such as via sensitivity analysis. The use of visualization and verbalization can be applied in a highly interactive context, where both users and systems combine the media in the flow of the conversation. For instance, the user may be able to filter input data using natural language or interactive visualization. At the same time, the agent may apply any of the previously described strategies in its re-sponses. Fig. 4 is an example of a conversation following theoverview and metadataandoverview and detailstrategies: cluster results—the output—are shown visually, whereas the explanation requested by the user is provided in textual form. The agent’s answer also provides a hint to the user regarding a parameter of the algorithm (the number of clusters) and how the results could change. One needs to take into con-sideration that besides NLG, Natural Language Understanding (NLU) is another core component of agent-based dialogue systems. NLU is “the process of mapping natural language into internal computer
repre-sentations” [22, p. 1], which is a complex research field on its own.
5 OPPORTUNITIES, CHALLENGES, AND OPEN RESEARCH
QUESTIONS
In this position paper, we introduce ideas on how and when a combina-tion of visualizacombina-tion and verbalizacombina-tion techniques is beneficial. How-ever, designing such combinations effectively is challenging due to their dependencies on several factors such as the task, model, and users. Currently, no clear guidelines exist to support designers of such sys-tems and many research questions remain still open.
Adapting to Different Users:Users’ preferences and their level of
expertise will have a strong influence on the strategies used to combine visualization and verbalization. It is well known that people have different learning styles. The visual learners process the information best if they can see it; the auditory learners like to hear information;
3http://www.r2d3.us/visual-intro-to-machine-learning-part-2 accessed on the 5th of July 2018
Fig. 4: Example of a conversation with an agent for a clustering prob-lem. The user—gray boxes—addresses the agent by explicitly request-ing a command and also conveyrequest-ing doubt about the results. The agent, in addition to answering the question, also proactively makes sugges-tions to the user. In this example, the explanation about a validation metric—silhouette scores—is provided verbally.
the read-write learners prefer to see the written words, however the kinaesthetic learners like to acquire information through experience and practice [21]. Collecting and analyzing this information could help to decide which generation strategy to apply, as well as the integration strategies. An interesting open question is investigating how these various strategies can be used inadaptiveinterfaces to cater for the needs of different user groups.
Identifying Relevant Data Enrichments:It would be interesting to
semantically enrich ML approaches and models with the schema of the data that the algorithm is applied on. This would allow the generation of messages to be communicated in visual or textual form based on reasoning. For example, in unsupervised clustering, one could have a taxonomy that is used when explaining the clustering results. Cluster labels could then be generated based on the taxonomy, such asmammals
for a cluster that contains instances from sub-classes of mammals, or
mammals without rodentsif rodents were the only mammal instance assigned to another cluster.
Identifying Optimal Media: As seen in the agent-based example
above, verbal explanations might be used as part of the learning process with user interaction. For example, for each instance of a trained model, verbal explanations about the differences between models can be given. This is also applicable inwhat-if situations and proactive feedback, when it is not computationally expensive for the system to provide such feedback. Besides task-related requirements, the challenge here is in identifying the situations where the different explanation strategies may be applied to improve results.
Balancing Different Media:When a textual representation is added
[image:6.612.323.565.98.321.2]data point or decision and the amount which can be easily handled by the user needs to be discovered (e.g., using evaluation studies).
Generating Text Effectively:Another open question is how to build
vocabularies that are used to generate explanations and also interpret users intents in agent-based systems. Empirical methods are commonly used as part of the design process for user input [25]—the same vocab-ulary and methodology could be used to define explanation templates, for example. Automated methods, such as topic modelling or text seg-mentation, could be utilised to extract parts from a text corpus com-prising scientific papers where explanations of results from a machine learning model are included as part of the discussions on the analysis. Traditionally, the NLG process can be divided into two main cat-egories: template-based(includingcanned-text) andstandard(also know asdeep-linguisticoradvanced) methods [28]. Although the template-based methods are assumed to generate poorer output than advanced methods [22, p. 60], some researchers argue that there is no important difference between the two types of methods and their perfor-mances [4]. The challenge is that the generation of a meaningful text can become complex even when simple template-based approaches are used.
6 CONCLUSION
This paper argues for a combination of visualization and verbalization techniques to explain ML models. To support our position, we pre-sented a design space which maps out the aspects of a ML model that can be explained through visualization and verbalization techniques; moreover, we discussed different strategies in order to achieve and present the generated explanations. Using multiple application exam-ples, we demonstrated the benefit of the combination of the two media. Designing such combinations is challenging; thus, many aspects still need to be explored and researched.
ACKNOWLEDGMENTS
We gratefully acknowledge the German Research Foundation (DFG) for financial support within the Research Unit FOR 2111 with grant number: DFG-431/16, and CT and RH are supported by the UK Engi-neering and Physical Sciences Research Council (EPSRC) with grant number: EP/P025501/1 .
REFERENCES
[1] F. Beck and D. Weiskopf. Word-sized graphics for scientific texts.IEEE Trans. on Visualization and Computer Graphics, 23(6):1576–1587, 2017. [2] O. Biran and C. Cotton. Explanation and justification in machine learning:
A survey. InIJCAI-17 Workshop on Explainable AI (XAI), p. 8, 2017. [3] M. A. Borkin, Z. Bylinskii, N. W. Kim, C. M. Bainbridge, C. S. Yeh,
D. Borkin, H. Pfister, and A. Oliva. Beyond memorability: Visualiza-tion recogniVisualiza-tion and recall.IEEE Trans. on Visualization and Computer Graphics, 22(1), 2016.
[4] K. V. Deemter, M. Theune, and E. Krahmer. Real versus template-based natural language generation: A false opposition?Computational Linguis-tics, 31(1):15–24, 2005.
[5] U. Ehsan, B. Harrison, L. Chan, and M. O. Riedl. Rationalization: A neural machine translation approach to generating natural language explanations.
CoRR, abs/1702.07826, 2017.
[6] A. Gatt and E. Krahmer. Survey of the state of the art in natural language generation: Core tasks, applications and evaluation.Journal of Artificial Intelligence Research, 61:65–170, 2018.
[7] A. W. Harley. An interactive node-link visualization of convolutional neural networks. InInt. Symp. on Visual Computing, pp. 867–877. Springer, 2015.
[8] L. A. Hendricks, Z. Akata, M. Rohrbach, J. Donahue, B. Schiele, and T. Darrell. Generating visual explanations. In B. Leibe, J. Matas, N. Sebe, and M. Welling, eds.,Computer Vision – ECCV 2016, pp. 3–19. Springer International Publishing, Cham, 2016.
[9] I. Jolliffe. Principal component analysis. InInternational encyclopedia of statistical science, pp. 1094–1096. Springer, 2011.
[10] J. Krause, A. Perer, and E. Bertini. Using visual analytics to interpret predictive machine learning models. arXiv preprint arXiv:1606.05685, 2016.
[11] S. Latif, D. Liu, and F. Beck. Exploring Interactive Linking Between Text and Visualization. InEuroVis 2018 - Short Papers, pp. 91–94. The Eurographics Association, 2018.
[12] Z. C. Lipton. The mythos of model interpretability.Queue, 16(3):30, 2018. [13] M. Liu, J. Shi, Z. Li, C. Li, J. Zhu, and S. Liu. Towards better analysis of deep convolutional neural networks.IEEE Trans. on Visualization and Computer Graphics, 23(1):91–100, 2017.
[14] S. Liu, X. Wang, M. Liu, and J. Zhu. Towards better analysis of ma-chine learning models: A visual analytics perspective.Visual Informatics, 1(1):48–56, 2017.
[15] L. v. d. Maaten and G. Hinton. Visualizing data using t-SNE.Journal of machine learning research, 9(Nov):2579–2605, 2008.
[16] G. A. Miller. The magical number seven, plus or minus two: Some limits on our capacity for processing information.Psychological review, 63(2):81, 1956.
[17] M. Mohri, A. Rostamizadeh, and A. Talwalkar.Foundations of machine learning. MIT press, 2012.
[18] G. Montavon, W. Samek, and K.-R. M¨uller. Methods for interpreting and understanding deep neural networks.Digital Signal Processing, 2017. [19] T. M¨uhlbacher and H. Piringer. A partition-based framework for building
and validating regression models. IEEE Trans. on Visualization and Computer Graphics, 19(12):1962–1971, 2013.
[20] J. Parnow and M. D¨ork. Micro visualizations: Data-driven typography and graphical text enhancement. InProc. IEEE Conf. Inf. Vis. Posters, 2015. [21] C. Qaxton and P. Murrell. Learning styles: Implications for improving
education practices.ASHE-ERIC Higher Education Rep, (4), 1987. [22] E. Reiter and R. Dale. Building natural language generation systems.
Cambridge university press, 2000.
[23] M. T. Ribeiro, S. Singh, and C. Guestrin. ”Why Should I Trust You?”. In
Proc. of the 22nd ACM SIGKDD Int. Conf. on Knowledge Discovery and Data Mining - KDD ’16, pp. 1135–1144. ACM Press, 2016.
[24] R. R. Selvaraju, M. Cogswell, A. Das, R. Vedantam, D. Parikh, and D. Ba-tra. Grad-CAM: Visual explanations from deep networks via gradient-based localization. InICCV, pp. 618–626, 2017.
[25] V. Setlur, S. E. Battersby, M. Tory, R. Gossweiler, and A. X. Chang. Eviza: A Natural Language Interface for Visual Analysis. InProc. of the 29th Ann. Symp. on User Interface Software and Technology, vol. 10, pp. 365– 377, 2016.
[26] K. Simonyan, A. Vedaldi, and A. Zisserman. Deep inside convolutional networks: Visualising image classification models and saliency maps.
CoRR, abs/1312.6034, 2013.
[27] S. Stumpf, V. Rajaram, L. Li, W.-K. Wong, M. Burnett, T. Dietterich, E. Sullivan, and J. Herlocker. Interacting meaningfully with machine learning systems: Three experiments.International Journal of Human-Computer Studies, 67(8):639–662, 2009.
[28] K. van Deemter, M. Theune, and E. Krahmer. Real vs. template-based natural language generation: a false opposition.Computational Linguistics, 31(1):15–24, 2005.
[29] S. van den Elzen and J. J. van Wijk. BaobabView: Interactive construction and analysis of decision trees. InVisual Analytics Science and Technology (VAST), 2011 IEEE Conf. on, pp. 151–160. IEEE, 2011.
[30] L. Yang. Pruning and visualizing generalized association rules in parallel coordinates.IEEE Trans. on Knowledge and Data Engineering, 17(1):60– 70, 2005.
[31] T. Zahavy, N. Ben-Zrihem, and S. Mannor. Graying the black box: Under-standing DQNs. InInt. Conf. on Machine Learning, pp. 1899–1908, 2016. [32] M. D. Zeiler and R. Fergus. Visualizing and understanding convolutional networks. InEuropean Conf. on Computer Vision, pp. 818–833. Springer, 2014.