This is a repository copy of Modelling contact mode and frequency of interactions with social network members using the multiple discrete–continuous extreme value model. White Rose Research Online URL for this paper:
http://eprints.whiterose.ac.uk/109808/ Version: Accepted Version
Article:
Calastri, C, Hess, S orcid.org/0000-0002-3650-2518, Daly, A
orcid.org/0000-0001-5319-2745 et al. (3 more authors) (2017) Modelling contact mode and frequency of interactions with social network members using the multiple
discrete–continuous extreme value model. Transportation Research Part C: Emerging Technologies, 76. pp. 16-34. ISSN 0968-090X
https://doi.org/10.1016/j.trc.2016.12.012
© 2017 Elsevier Ltd. Licensed under the Creative Commons Attribution-NonCommercial-NoDerivatives 4.0 International http://creativecommons.org/licenses/by-nc-nd/4.0/
[email protected] https://eprints.whiterose.ac.uk/ Reuse
This article is distributed under the terms of the Creative Commons Attribution-NonCommercial-NoDerivs (CC BY-NC-ND) licence. This licence only allows you to download this work and share it with others as long as you credit the authors, but you can’t change the article in any way or use it commercially. More
information and the full terms of the licence here: https://creativecommons.org/licenses/ Takedown
If you consider content in White Rose Research Online to be in breach of UK law, please notify us by
1
Modelling contact mode and frequency of interactions with social
network members using the multiple discrete-continuous extreme
value model
Authors: Chiara Calastri*, Stephane Hess*, Andrew Daly*, Michael Maness~, Matthias Kowald, Kay Axhausen°
* Institute for Transport Studies & Choice Modelling Centre, University of Leeds, UK
~Oak Ridge National Laboratory, Center for Transportation Analysis, USA
RheinMain University of Applied Sciences, Germany
° ETH Zurich, Switzerland
ABSTRACT
Communication patterns are an integral component of activity patterns and the travel induced by these activities. The present study aims to understand the determinants of the communication patterns (by the modes face-to-face, phone, e-mail and SMS) between people and their social network members. The aim is for this to eventually provide further insights into travel behaviour for social and leisure purposes. A social network perspective brings value to the study and modelling of activity patterns since leisure activities are influenced not only by traditional trip measures such as time and cost but also motivated extensively by the people involved in the activity. By using a multiple discrete-continuous extreme value model (Bhat 2005), we can investigate the means of communication chosen to interact with a given social network member (multiple discrete choices) and the frequency of interaction by each mode (treated as continuous) at the same time. The model also allows us to investigate satiation effects for different modes of communication. Our findings show that in spite of people having increasingly geographically widespread networks and more diverse communication technologies, a strong underlying preference for face-to-face contact remains. In contrast with some of the existing work, we show that travel-related variables at the ego level are less important than specific social determinants which can be considered while making use of social network data.
Keywords: social network analysis; multiple discrete continuous; snowball sample
1. INTRODUCTION
In the activity-travel perspective, travel is a derived demand due to activities (Ortúzar and Willumsen, 2011). Individuals connect the activities in their lives by travel because they
bring value to their life T
2
network structure and information and communication technology (ICT) interaction. Habib C
L W
emotional support from family led to more joint travel trips as compared to emotional support from non-family friends and acquaintances. Castiglione et al. (2015) note that activity-based models at the academic level have considered full social networks in joint travel decisions and in generating and scheduling daily tours, but their use in practice-ready activity-based models has not been implemented yet.
This need for socialising can also be achieved by other forms of communication. Often, these communication patterns are correlated by different modes of communication and travel (van den Berg et al., 2012a; Frei and Axhausen, 2009; Kowald, 2013; Lin and Wang, 2014; Schaap et al., 2016; Tillema, 2010). Thus, communication patterns are an integral component of activity patterns and the travel induced by these activities. Understanding the determinants of communication patterns between people and their social network members is critical for gaining further insights into travel behaviour for social purposes. A social network perspective brings value to the study and modelling of activity patterns since social activities are influenced not only by traditional trip measures such as time and cost but also motivated extensively by the people involved in the activity (Ryley and Zanni, 2013). Van den Berg et al. (2012b) provide an extensive review connecting social networks, ICT use for social interaction and communication patterns:
The majority of social network studies in transportation use egocentric social network data. These approaches prompt users with a name generator to create a list of relevant contacts. By following this up with questions about the given contacts,
be formed including network-wide
measures (e.g. centrality, density, between-ness) as well as dyad-level measures (characteristics of the linkage between two individuals).
There is still limited research on the impacts of ICT use on social activity generation. Support for the substitution hypothesis of ICT use replacing all face-to-face communication is limited. In contrast, studies have found a complementarity between ICT use and social activity generation.
Communication mode and frequency have been found to be impacted by not only individual characteristics, but also by dyad-level attributes such as tie type and relationship, tie strength and geographic distance.
one-3
-dependency lead to a
Previous research mainly used multi-level models (Frei & Ohnmacht, 2014) to address the complexities in communication mode choice and frequency. This hierarchical structure
of interaction, the ego-level characteristics and the ego-alter dyad ones. Van den Berg et al. (2012a) used multilevel path analysis to describe mode-specific communication frequencies and correlations between modes. Their results indicated a complementary relationship
T
contact frequencies of the different modes, especially face-to-face and telephone, can also
be largely explained by the ego ationship and
the distance between ego and alter F A
multilevel path analysis to describe communication mode and frequency relationships. Frei (2012) notes a limitation of path analysis techniques in that the models are fitted on sample covariance rather than sample values.
In contrast, a multivariate regression approach can be used to fit a model on sample values. Frei (2012) and Kowald (2013) used multivariate multilevel linear regression models of
dyad-lev F
Increases in distance correspond to decreases in face-to-face and phone contact frequency while e-mail frequency is unaffected.
Ego-level socio-demographics were more influential than dyad-level (ego-alter) characteristics.
T he different contact modes and face-to-face meetings are
Kowald (2013) also reports similar results and additionally found that nuclear family members and close social ties were contacted more frequently than other contacts. But the multivariate linear regressions used in that work have limitations due to the skewness in mode frequency data. This is due to high incidences of no communication via a mode and because some contact frequencies occur at very high levels. In these studies, the authors dealt with this concern by either removing observations (mode-level) for an ego-alter communication mode if no communication was performed via that mode (Kowald 2013), or using a log-transformation with a residual maximum likelihood estimator and setting communication frequencies of zero to the minimum positive frequency for that mode (Frei 2013). Either of these approaches is unsatisfactory and this is a further motivation for the approach used in our work.
4
certain mode, but only describe how much communication occurred if the mode was chosen.
The present study aims to account for this limitation by explicitly modelling the selection of communication mode and its corresponding communication frequency. In our work, we simultaneously take into account potential determinants of the decision at both the ego and the ego-alter level. By using a multiple discrete-continuous extreme value model (Bhat 2005), we can simultaneously investigate the mode of communication chosen to interact with a given network member and the frequency of interaction by each mode. The model further allows us to investigate satiation effects from different modes of communication. The multiple discrete component of the model accommodates the fact that each ego potentially communicates with multiple alters and using different modes of communication. The continuous component of the model accommodates the fact that for each alter and mode and communication, there is the possibility of either 0, one, or multiple interactions. Of course, the number of times an ego communicates with an alter using a given mode is an integer value in the data, and the use of a continuous response model thus represents somewhat of an abstraction from reality. This is however no different in regression work.
The paper is organised as follows. The next section introduces the dataset used for the study. Section 3 provides an overview of the modelling framework, with an emphasis on the role of the different utility function parameters, before presenting the specification used in our analysis. The fourth section presents the results of the model estimation and provides an interpretation of the specific coefficients and their impact on behaviour, while the fifth section shows a simple forecast example on the basis of the estimated model. The final section draws conclusions and implications for travel behaviour analysis and outlines the next steps to be taken in the study of this topic.
2. Data
2.1. Survey overview
Over the past decade, the field of transport planning has been using methods from social network analysis to approach and explain leisure travel (see Larsen et al., 2006; Carrasco 2006; Frei and Axhausen 2007; van den Berg et al., 2009, Kowald & Axhausen 2014).
The selection of this methodological approach is based on the recognition of leisure travel as being primarily undertaken to join others in leisure activities. For this reason, leisure
Existing work analysed correlations
between characteristics of network topology (for example the number of social contacts and geographical distances between people) and aspects of travel activity, resulting in new empirical findings (Larsen et al., 2006, Carrasco et al., 2008, Silvis et al., 2006, Frei and Axhausen, 2007 and Kowald & Axhausen 2014) as well as suggesting advances to overcome the challenges in data collection and modelling (Frei and Axhausen, 2008, Hogan et al., 2007 and Carrasco et al., 2008). These studies though did not try to survey a population-wide
5
the wider network structure connecting personal networks to form a population-wide one
allow more generaliza
network in agent-based travel demand simulations.
The Institute for Transport Planning and Systems (IVT) of ETH Zurich conducted a survey between January 2009 and March 2011 to investigate this global leisure network topology, as part of a joint project with the Institute for Sea- and Land-Transport (ILS) of TU Berlin. One way of obtaining a population-wide leisure network is to sample respondents by means
nitial respondents are asked to report their social contacts and these contacts are in turn used to enlarge the network sampled. The survey implemented to collect the data used in this paper makes use of one of the best-known
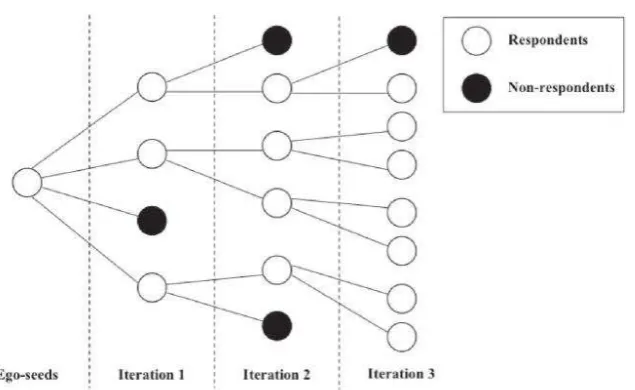
[image:6.595.143.461.405.600.2]to report their social contacts. These social contacts are then again asked to report their social contacts and invite them to take part in the study, a procedure that can be repeated for a predefined number of iterations. With the exception of the seeds, all respondents in a snowball sample are reported by former respondents. An illustration of a network obtained by a snowball chain is given in Figure 1.
Figure 1: An illustration of a three-iteration snowball chain. Source: Kowald & Axhausen (2012)
6 The survey instrument was made up of four sections.
T -demographics and
mobility biography, i.e. a report of the places where they lived and worked throughout their lives.
The second section was made up of two name generators. Name generators are questions, generally in the form of tables, which ask people to report names of their social contacts. The wording of the question makes use of specific stimulus to help respondents focus on the part of their social network of interest to a study and recall all the relevant names (Marsden, 1990, Campbell and Lee, 1991 and Wolf, 2004). The use of two name generators is motivated by the need to use different stimulus for a complete and more accurate recall of the social network of interest. The first name generator asks explicitly for leisure contacts providing examples related to leisure interactions, which should guide respondents in distinguishing whether a relationship fits to the requirements or not. The second name generator applies a different approach, as it asks respondents to mention the people with whom they discuss important problems. The question asked in relation to the second name generator differs from the one used in the first one in that it uses an affective perspective instead of a stimulus about the context of social interactions. Although the latter might be subject to individual interpretation, contacts from both name generators can trigger leisure travel and are therefore relevant given the scope of the study. The social network reported through the two name generators could not exceed the size of 40 contacts, but participants were encouraged to use additional sheets of paper if needed. In most analyses of the present dataset (Illenberger et al. 2011, Kowald & Axhausen 2012), including the one in the present paper, we only make use of the first 40 contacts to avoid potential bias deriving from the extra effort some participants made to report names in a non-survey form.
T egos were
asked to enrich the list of names reported in the name generators by adding alters socio-demographics as well as information related to the ego alter relationship, e.g. duration and circumstances of first meeting.
T
addresses were collected so that the survey and an optional invitation card could be sent to them. Only a paper version of the survey was in fact administered, therefore physical addresses were necessary to communicate with participants.
T
7
As this type of survey could appear quite unusual to respondents, special care was taken of question formulation, so that potential sources of misinterpretations were avoided. Where a risk of misunderstandings was identified, examples were provided to clarify the question. Another potential problem with this type of survey is that respondents might not be comfortable with providing information (especially home addresses) about their social contacts. Several measures to establish trust between respondents and the survey promoters were adopted. Egos were asked to sign an invitation card to be sent to their alters by the research team (for more details see Kowald et al., 2009), and once they had agreed to take part, the survey instrument was sent to them together with a 20 CHF 9 in 2015) monetary incentive. A response rate of 26% was achieved and considered satisfying by the promoters. Although some fatigue effects are present in the responses, the share of missing values is low, around 3% for egos alters characteristics (for details see Kowald et al., 2010). As mentioned above, the sample had no predetermined geographical limits, but despite this setting most respondents were from the German speaking part of Switzerland. Although data cleaning and censoring somewhat limited its representativeness, the originally collected sample matched the characteristics of the Swiss population well.
For further information and details about the data collection protocol, see Kowald & Axhausen (2014).
2.2 Sample characteristics
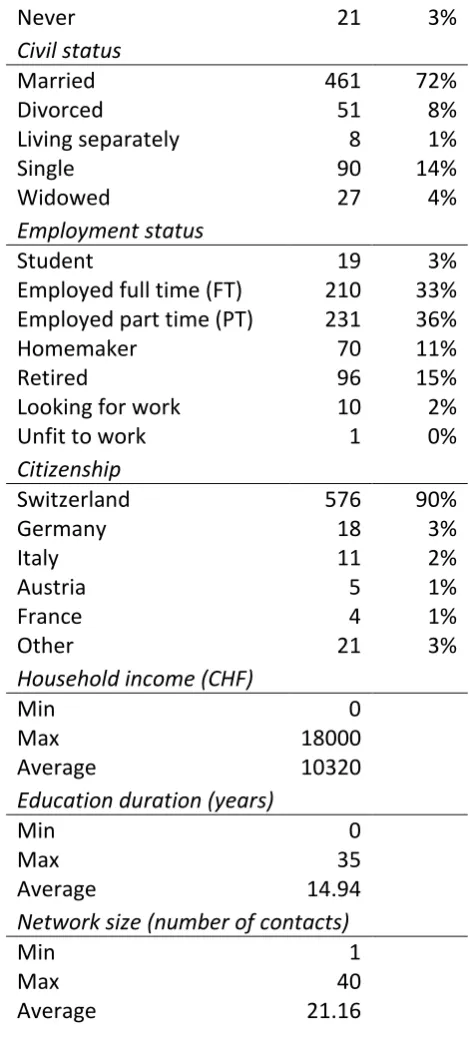
We excluded from the analysis all the egos who did not report any frequency of communication with any of their network members. We also excluded egos for whom most of the basic socio-demographic information were missing. Our final sample is made up of 638 egos, who named 13,500 alters. The socio-demographic and economic characteristics of the egos are reported in Table 1.
Number of egos= 638 Number of dyads= 13,500
N %
Sex
Male 245 38%
Female 389 61%
Age
Age = 18 4 1%
Age 19-30 47 7%
Age 31-45 149 23%
Age 46-60 258 40%
Age > 60 149 23%
Car availability
Always 60 9%
Often 90 14%
8
Never 21 3%
Civil status
Married 461 72%
Divorced 51 8%
Living separately 8 1%
Single 90 14%
Widowed 27 4%
Employment status
Student 19 3%
Employed full time (FT) 210 33% Employed part time (PT) 231 36%
Homemaker 70 11%
Retired 96 15%
Looking for work 10 2%
Unfit to work 1 0%
Citizenship
Switzerland 576 90%
Germany 18 3%
Italy 11 2%
Austria 5 1%
France 4 1%
Other 21 3%
Household income (CHF)
Min 0
Max 18000
Average 10320
Education duration (years)
Min 0
Max 35
Average 14.94
Network size (number of contacts)
Min 1
Max 40
Average 21.16
Table 1 Descriptive statistics of the sample
Note that we consider as an ego any respondent who has completed the entire survey and named her (or his) alters, no matter the wave in which she was recruited. In this sense, we virtually make use of egocentric data despite the fact that the dataset has been collected as a snowball sample.
[image:9.595.179.414.71.591.2]9
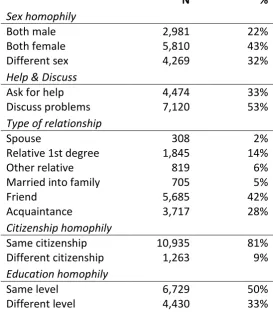
2 reports continuous measures and their basic statistics, while Table 3 reports categorical variables. Note that the statistics for distance between ego and alter includes only As stated above, missing values are excluded from these tables (this is why the percentages do not sum to 100%) although a specific treatment has been adopted in the modelling, as detailed in section 4.2.
Mean Median
Distance (km)
2,817.57 8.68 Age difference (years)
16.51 15
Relationship duration
(years)
21.27 19
Table 2 continuous dyad measures
N %
Sex homophily
Both male 2,981 22%
Both female 5,810 43%
Different sex 4,269 32%
Help & Discuss
Ask for help 4,474 33%
Discuss problems 7,120 53%
Type of relationship
Spouse 308 2%
Relative 1st degree 1,845 14%
Other relative 819 6%
Married into family 705 5%
Friend 5,685 42%
Acquaintance 3,717 28%
Citizenship homophily
Same citizenship 10,935 81%
Different citizenship 1,263 9%
Education homophily
Same level 6,729 50%
Different level 4,430 33%
Table 3 - categorical dyad measures
3. Methodology
[image:10.595.160.434.352.667.2]10
The family of MDCEV models first proposed by Bhat (2005) and extended in different directions (Bhat 2008, Pinjari and Bhat 2010, Castro et al. 2012) represents the state of the art in modelling multiple discrete-continuous choices. The initial exponential utility function proposed in Bhat (2005) was later replaced in most application by a Box-Cox specification which presents several advantages, as described in Bhat (2008); in particular, the continuity of the Box-Cox form with respect to the exponent, even for values near zero, turned out to be important in our work.
The Multiple Discrete Continuous Extreme Value (MDCEV) model and its various extensions have been applied to several empirical contexts, mainly related to the study of travel behaviour. Examples are applications to the choice of vehicle type and mileage (Bhat and Sen, 2006; Sen 2006), to the type or timing and duration of activities (Bhat 2005, Srinivasan and Bhat 2005, Pendyala and Bhat 2004) and to vacation-related decisions (Pinjari and Sivaraman 2013). The model has also been used in applications other than transport. For example, Lu et al. (2015) have applied it to the case of multi-buy alcohol promotions. Woo et al. (2014) used the model to understand how the use of traditional media (e.g. television, radio, newspaper) had been affected by new ones, such as in-home and mobile internet. Another application to media use is Block and Schultz (2015), focussed on understanding the time spent on each medium (television, radio, print, internet) by American consumers. The present paper represents the first application of the present modelling framework to investigate patterns of social interaction between people and their social contacts.
The model is derived coherently with the random utility maximisation theory, and it differs from traditional choice models in the fact that, by allowing the choice of multiple products, it relaxes the assumption of the alternatives being mutually exclusive. The additive but non-linear formulation of the utility function guarantees that the consumption of one good does not affect the utility of the others and that these goods are imperfect substitutes. The non-linear specification allows estimation of the satiation experienced from each good by allowing for diminishing marginal returns. The derivation of probabilities also differs from standard choice models.
11
The functional form of the direct utility is a generalised variant of the translated CES function, additive with respect to the different products but non-linear to allow diminishing marginal returns, i.e. that the benefit of an additional unit purchased of a given good decreases with increasing consumption of that good. The utility formulation, introduced by Bhat (2008), assumes the presence of K goods and assumes good 1 to be the outside good, although this choice is fully arbitrary. The utility function is as follows.
so that U is a quasi-concave, increasing and continuously differentiable with respect to and , , and are parameters relating to good .
The specific role of these parameters is as follows.
- is the defined as the baseline utility of good k . It is in fact the marginal utility of the good at the point of zero consumption. A higher baseline utility makes corner solutions (i.e. zero consumption of a good) less likely. is a function of observed characteristics associated with good k and the decision maker. also includes a constant reflecting the generic preference for good k. The random form of the utility is obtained by introducing an exponential multiplicative random element. This, together with an exponential form of the deterministic component of utility, ensures the positivity of the utility, which can be written as: , where is an extreme value error term, and is an estimated vector of parameters. For identification, we set the deterministic part of the log baseline utility for one good to zero, say the outside good.
- The parameters in the model have several roles. First, they are translation parameters that allow for corner solutions, so that for any good (other than the outside good) it is possible to evaluate the model with . Second, defines a scale for each good. Third, because defines a scale, it also affects the satiation, as a higher implies that more consumption of the corresponding is needed to obtain the saturation effect. It is this last role of that makes separate identification of and difficult.
- satiation parameter. By exponentiating the consumption quantity of good k, it reduces the utility of any additional unit consumed. can take any value smaller or equal to 1. Low means faster satiation. In our model, we bound
as suggested by Bhat (2008). When , the utility form above collapses to a linear expenditure system (see Bhat, 2008). Conversely, would choice models, i.e. with constant marginal utility of consumption and no satiation effects allowed.
12
made use of the -profile (cf. Bhat 2008), which estimates the parameter for the outside good only with other parameters taking the zero limit and all .
The probability that an individual consumes the quantities , where M of the K goods are consumed in positive amounts, is given by (see Bhat, 2008):
where is an estimated scale parameter and where .
3.2. Application to social network data
The MDCEV model can accommodate the fact that people choose simultaneously between different products, in our case the means of communication with every member of their social network (face-to-face, phone, e-mail, SMS) and the quantity of each, in our case the frequency of interaction. We believe that this framework is more adequate than previous approaches to represent real-world behaviour in this specific case. The choice of how and how frequently to stay in touch with someone requires joint consideration of the ego and alter characteristics, and the understanding of underlying behaviour would be limited without considering the substitution effects that are likely to be present in this context.
The dependent variable of our model is the frequency of interaction by each communication mode with each social network member per year. As there are 4 possible modes of communication (face-to-face, phone, e-mail, SMS) and each ego can have at most 40 social 4*40=160. As not all the egos have named 40 social contacts, in the case in which someone has reported a lower number, say n, the remaining 40-n contacts are considered to be unavailable to her. The outside good, that in the present context represents all the activities other than communication, takes the total number of products to 161.
13
approaches to estimate a latent budget for vehicle miles travelled, while Dumont et al. (2013) proposed a latent budget approach for money budgets.
For our specific case study, we use a slightly different approach. Firstly, as neither costs nor durations for the different types of interactions are available, the definition of time or money budgets would be difficult. Secondly, the use of such an approach would be geared at aiming to model (and then predict) the overall level of interaction an ego undertakes. In our work, we focus instead on understanding how, with the overall annual number of communications being determined exogenously, an ego distributes these across alters and across modes of communication.
I
budge I
the same cost applies to one phone call as to one face-to-face meeting, for example. The budget for a given ego is then simply given by the total annual number of communications that we observe for that ego in the data, across all alters and all modes. We maintain an outside good in our model specification and simply assign one unit of the budget for the outside good1.
We are aware of the simplification implied by assuming a joint budget for all four communication modes, with the same unit cost for each mode. In reality, the cost (time and money) of face-to-face interactions, especially when two people live far away from each other, is likely to be much higher than the cost of sending that person an e-mail. To test the impact of these simplifying assumptions, we also estimated models with a number of different specifications for costs and the budget. We first tested the impact of the unit cost assumptions, by making facto-face the most expensive mode, ahead of phone, sms and e-mail. We still allocated one unit to the outside good. Secondly, we tested the impact of the budget assumption and specifically the allocation to the outside good, where we estimated a model in which a generic fixed amount is allocated to the budget for each individual. The full details of these tests are reported in our online appendix2. Neither of these departures had a significant impact on our overall findings, and we thus maintained the unit cost assumption, and a budget given by total expenditure across inside goods plus one unit for the outside good.
The final specification of the model has been obtained by first testing the performance of the different specifications that can be empirically estimated (according to Bhat 2008). As
-
the for and for the outside good. This profile provides better statistical fit than either - or - in this specific empirical application. As presented an extremely small and insignificant value in all the model specifications we
1 This is for econometric reasons alone, as it is helpful to have one good that is always chosen.
14
estimated, we decided to fix it to zero in order to avoid computational problems. As an example, in the latest model specification where it was estimated, its value was 0.001 with a t-statistic of 0.878. In very simple specifications, for example where only the structural parameters of the models, the constants and the distance coefficients were estimated, was equal to 0.000005 with a t-statistic of 0.057. As explained in Bhat (2008), , implies that the utility form collapses to a linear expenditure system, i.e. to a log utility formulation.
Moreover, as it would have been impossible to estimate a for each of the 160 inside goods, we only estimated four of them, one for each mode of communication, which were then reused across alters. In estimation, to ensure positive values, we work with
, with log being estimated. For the presentation of the results, we then apply the transform, and report .
4. Empirical results
We started off by estimating a base version of the model and systematically adding and combining variables on the basis of statistical significance, intuition and guidelines from previous studies.
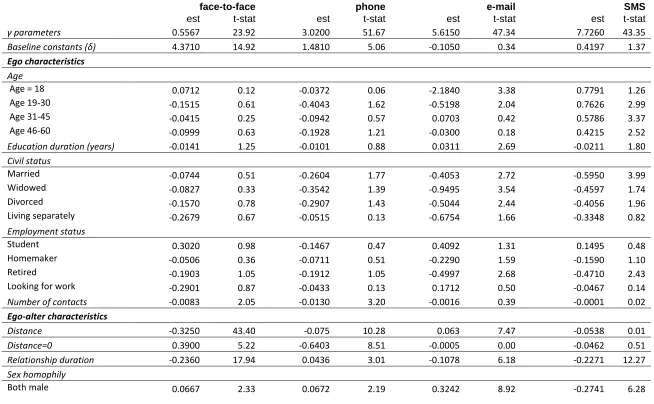
Our results are displayed in Table 4, where the estimates and t-statistics of coefficients are presented. A detailed presentation and interpretation of results follows.
4.1. Core results
Baseline constants
The parameters represent the baseline preference constant component of the utility of each alternative, where they enter through an exponential into . A higher value for thus leads to an increase in the baseline utility of alternative k. The parameters in turn determine, jointly with the baseline utilities , the impact that each additional unit of consumption has on the contribution that the consumption of good k makes to the overall utility. All else being equal, including the socio-demographic effects being the same across products, we could state that increases in will lead to bigger increases in utility for each additional unit being consumed, while for , the opposite applies. What we then see from our results is that, if the socio-demographic impacts on baseline utilities are the same across modes (a point we will return to below), a face-to-face contact has more impact on the utility function than a contact by phone ( and
. The impacts of an interaction either face-to-face or by phone is also stronger than
that of e-mail or SMS. However, for the latter two, the ordering is less clear cut, as and . With in our models, the utility component
reduces to a log specification, with . Ignoring the
15
is always stronger than the impact of an e-mail. With bigger consumption, this difference increases. This is a direct result of the fact that satiation is stronger with lower . We then also note that satiation approaches more rapidly for a given number of contacts when they are by phone and especially face-to-face. Intuitively this appears reasonable, as people exhaust all the activities/communication they want to undertake with an alter in fewer face-to-face meetings than with other forms of communication, followed by phone T parameters could also be thought of, to some extent, as representing the amount of time and the cost of setting up the communication by each mode.
Effect of ego-level characteristics
The ego level characteristics are in general not strongly significant, possibly indicating that measures of the attributes of just one of the two people involved in the interactions are not sufficient in explaining the communication frequency. Nevertheless, we will try to interpret the significant coefficients for each of the variables. For each ego-level variable, we estimated for coefficients, one for each communication mode. This approach allows us to observe the impact of that variable on mode-specific frequency of communication.
Age
A categorical variable represents the age of egos, as shown in Table 1. The category including people more than 60 years old is used as a base. The significant coefficients give some interesting insights: the e-mail coefficient for the youngest category is negative and significant, meaning that teenagers are less likely to use e-mail than people who are over 60. This result may seem counter-intuitive if we think about the familiarity of younger generations with ITC, but existing studies (e.g. Agosto et al., 2012) found that teenagers make a reduced use of e-mails and see it only as a mode to communicate with adults or in particularly formal communication.
People in their twenties resulted being less likely to communicate by phone (although the significance level is only 90%) and rather surprisingly also by e-mail than people more than 60 years old, while they are significantly more likely to send SMS with respect to the oldest group. The last point is also true for the 31-45 and the 46-60 years old categories, confirming that this mode is probably not used much by those over 60.
Education duration
A log transformation is applied to the years spent in education. As concluded by previous studies (Frei and Ohnmacht, 2014), this variable is not particularly relevant in explaining the frequency of social interaction. The only significant coefficient shows that the longer the time spent in education, the more likely someone is to communicate via e-mail. This could be motivated by the fact that people with a higher level of edu
IT
therefore are more likely to use their computer as a way to communicate.
16 The different categories considered for the ego
married “
coefficients should be interpreted as effects relative to this category. In line with results of studies on the impact of marriage on social life and contact with the family of origin (e.g. Sarkisian & Gerstel, 2008), we find that married people are significantly less likely to communicate by e-mail and SMS than single people. Although the literature also suggests an effect on physical interactions, we do not find the impact on face-to-face meetings as significant. Both widowed and divorced people get a lower benefit from communicating via SMS than singles. We also find a negative effect on communication via e-mail for widows. Although several explanations for this could be possible, one interpretation could be that widowed people are believed to intensify phone and face-to-face contacts to overcome their loss and reduce their use of impersonal communication for social purposes, especially in late stages of life (Utz et al., 2002).
Employment status
This variable specifies whether the ego is a student, looking for a job, a homemaker, a retiree or is employed (full or part time). The last category is our base. Most of the coefficients are not significant, but we observe that retired people are significantly less likely to use e-mail and SMS than those in employment. This result does not contradict the
A
The higher propensity to communicate of those who are in employment with respect to those who are not has been found in previous research (Frei and Ohnmacht, 2014).
Number of social network contacts
In line with previous findings (Frei and Ohnmacht, 2014; Dunbar, 2003) all the mode-specific coefficients show that the higher the number of social contacts in the network, the less the utility that accrues by communicating by any mode. The intuitive explanation is that social contacts require maintenance, so the bigger the network, the lower the number of interactions that people can have with each of their network members.
Ego characteristics excluded from the model
Several ego-level variables that previous studies have found to be relevant for social interactions have proved to be non-significant in our model. As an example, differently from Carrasco and Miller (2009), we did not include network measures in our final specifications, as even the most commonly used ones, such as degree centrality, betweenness and density, did not have a significant effect on communication frequency. We believe that this is due to the fact that the actual pattern of communication is mainly determined by characteristics of the two individuals involved in it, not necessarily by the overall network structure.
17
unexpected. We appreciate that face-to-face contact with people who live far away could be rather costly, but lacking information on the spatial arena of each interaction, it would have been difficult to expect a specific effect.
We also excluded the variable indicating the availability of a car to the ego as we found no significant effects on patterns of communication. This variable had four levels (i.e., a car could always, often, seldom or never be available), and we attempted various specifications with these levels but no effect was found. We also tested possible interactions of this variable with others, namely civil status, employment status, level of education, presence of children in the household and number of social contacts, but no significant effect was found. This finding may be surprising, but a review of the existing literature reveals the lack of robust evidence about this effect. Frei & Axhausen (2009) and Frei & Ohnmacht (2014) find relatively weak positive effects of car availability on face-to-face interaction, while Tillema et al. (2010) and Sharmeen et al. (2014) find an effect of the number of cars on frequency of interaction. Other studies reached conclusions in line with ours, i.e. they do not find significant effects (Carrasco, 2011; van den Berg & Timmermans, 2015) or highlighted that car availability can have an effect on decisions other than frequency in the domain of social interactions, such as the decision of whether to interact (van den Berg et al., 2015) and the number of trips for social purposes (van den Berg et al., 2013). Moreover, van den Berg et al. (2012b) find that car ownership has no effect on frequency of interaction and only has a weak impact on the choice to communicate by phone. One possible interpretation of our findings could be related to the fact that the public transportation system in Switzerland is
very efficient and relatively inexpensive.
Somewhat surprisingly, the ownership of a public transport pass also did not significantly affect the frequency of interaction by any mode. Respondents could state whether they owned a half-price ticket or a full exemption for all Swiss transport, a regional pass or a pass for a specific route. These categories were tested separately as well as aggregated in a dummy corresponding to owning a pass versus not owning it. No effect at the 0.05 significance level was found. Similar conclusions were reached, for example, by van den Berg et al. (2015). While acknowledging that some of these results may be due to intrinsic characteristics or limitations of the specific dataset/context, with a high share of respondents owning a public transport pass, we believe that this and other results may suggest that dyad-level variables can be more important determinants of communication patterns than ego socio-demographics and characteristics related to the transport system.
Effects of ego-alter (dyad) characteristics
The coefficients estimated for the variables expressing dyad characteristics are substantially more significant than those described in the previous section. A detailed interpretation of these coefficients follows.
18
This continuous variable represents the distance (measured as a straight line, in kilometres) between the ego each alter home location. It enters the model in 2 different levels, i.e. positive distance (in logs, given the strongly skewed distribution, evident from mean and median statistics reported in Table 2) and zero distance, i.e. dyads living together. 74% of the ego-alter pairs present positive distance between their homes, while 3% of them live together.
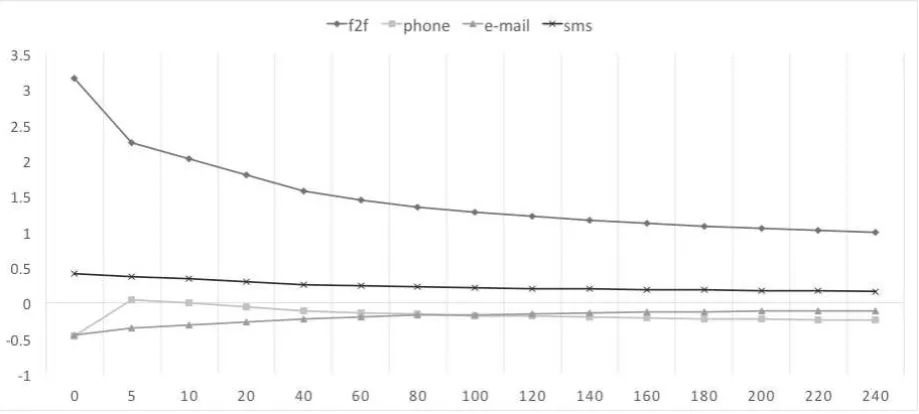
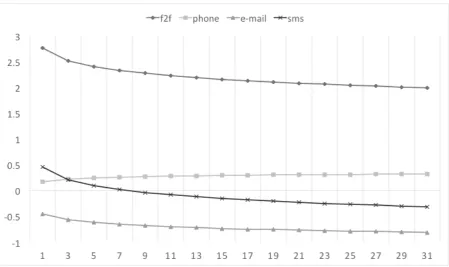
In line with previous findings (Carrasco and Miller 2009, Frei and Ohnmacht, 2014, Kowald 2013) and with basic intuition, the effect of distance on interactions is very significant, and in particular we find that higher distances are related to lower face-to-face social interactions. In Figure 2, we simulate the impact of increasing distance between ego and alters home locations on utility for distances between zero and 500 km. This is computed by adding the mode-specific baseline constants to the values of utility computed considering only the effect of distance.
We observe that the impact of distance on face-to-face is larger than on the other modes. In particular, the second strongest effect on utility is for SMS contact, then for phone and e-mail, although the order of the two latter modes is reversed for distances higher than approximately 90 km. The utility accrued by face-to-face communication is substantially lower for people who live far away than for people living close by. Utility decreases with distance also in the case of contact via phone and SMS, while in the case of e-mail we observe the opposite effect: the utility people get from this type of interaction increases with distance. This pattern in the signs of coefficients is not only observed in the case of distance and it seems to suggest that e-mail is a mode of communication that is used for different purposes and with different people with respect to the other three modes. This finding is supported by previous evidence that tackled the same research question (Frei and Ohnmacht 2014).
19
Figure 2 effect of distance on utility
Relationship duration
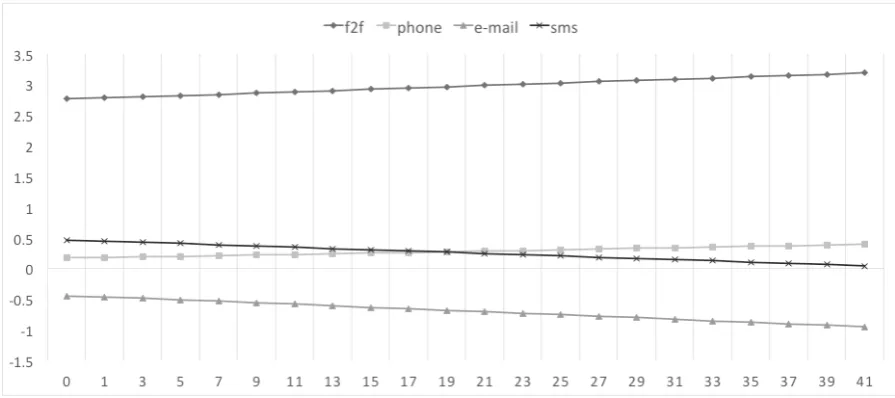
This variable indicates for how many years the ego and each alter have known each other. A log transformation is applied to the values. The coefficients for all the modes are significant and negative except for the phone one, which is positive. This implies that people who have known each other for a long time are more likely to interact via phone than people who have met more recently. Conversely, communication by e-mail, face-to-face and SMS (the coefficients for the last two modes are nearly identical) provides less utility for longer-term relationships than for recently formed ones. It is likely that people who have known each other for long may have relocated to different parts of the city/country, which makes interaction by phone a preferable mode, as it is not as impersonal as other modes but not much affected by distance. Another explanation could be that both people are rather old and will therefore prefer to use the phone. In general, the negative coefficients should not be surprising, as generally long term relationships seem to display lower and lower communication frequencies as time goes by (Kowald 2013, Frei and Ohnmacht, 2014).
[image:20.595.73.533.72.279.2]20
Figure 3 effect of relationship duration on utility
Age difference
This variable indicates the absolute value of the age difference (in years) between the ego and each alter. All the coefficients are significant.
[image:21.595.73.523.69.336.2]21
Figure 4 effect of age difference on utility
Core social contacts
These two dummy variables report the response of the ego to the W
W
discuss important personal problems with the person (e.g. personal relationships, illness)?
T ego, as
she considers them someone to rely on. Respondents could answer Yes (coded as 1) or No (coded as 0). As expected, all the mode-specific coefficients are positive and significant, possibly indicating that people are more likely to interact by any mode
than with people they are not so emotionally close to. The magnitude of the coefficients is generally quite small and mode-specific coefficients are similar for the two variables.
We also included an interaction term between these two variables, to consider the very strong contacts, i.e. the people that the ego would both ask for help and discuss problems with. In this case, only the face-to-face coefficient is significant and has positive sign, indicating a more likely interaction with this group of people with respect to others only in person. This finding is in line with the results obtained by Carrasco and Miller (2009).
Sex homophily
[image:22.595.73.521.71.270.2]22
characteristics in different levels of the model, i.e. for example Kowald et al. (2013) considers ego sex in Level 3 and alter sex in Level 2.
Type of relationship
A number of dummy variables are employed to specify whether each alter is the ego spouse, relative of first degree, another relative, someone married into the family, acquaintance or friend. The latter is used as a base category.
We observe a strong significant effect of almost all these variables on communication
T egos are more likely to
communicate by all means with their spouses than with their friends. The face-to-face and phone coefficients are particularly large in magnitude.
Positive signs of all coefficients are also observed in the case of 1st degree relatives, i.e. For more distant relatives and people married into the family we observe lower likelihood of making use of e-mail and SMS than with friends and but more likelihood of using phone. In the case of people married into the family, the face-to-face coefficient is also positive. It is in fact intuitive that contact with family members who are not immediate family will be mostly maintained through occasional phone calls and face-to-face meetings at family gatherings. Our results also reflect previous findings in the sense that SMS seems to be used mainly with very close contacts (like spouses) or family members than with friends (Tillema et al., 2010). The same holds for face-to-face, suggesting the presence of potential complementarities between the two modes. We also observe that although e-mails are likely to be used with very strong contacts like spouses, they are more likely to be used with friends than with not very close relatives and acquaintances.
Education homophily
As mentioned above and highlighted by previous studies, the level of education does not seem to be a determinant of communication frequency. When looking at whether the ego and alter have the same level of education, we observe that those with the same level tend to interact by e-mail and SMS more than those with a different level. The opposite holds for face-to-face, suggesting that it is more likely for two people with a different level of education to meet in person than for people with the same level. Communicating with someone with a different level of education could be relatively more difficult, and the richness of expression possible with face-to-face can be a way to overcome such difficulty.
Citizenship homophily
23
unexpected, and is also supported by recent work on residential location choices in the Swiss city of Lugano (Ibraimovic & Hess, 2016) We observed that this variable is only significant (and positive) in the case of face-to-face and SMS, giving us a hint on possible complementarities between these two modes.
4.2. Missing values analysis
The name generator technique applied to collect the data used for the present study presents a number of issues when it comes to the reliability of the information reported by respondents. One problem which has been addressed by previous research is the accuracy of the reported network composition, as people are more likely to remember those social contacts who are emotionally closer to them (Bell et al., 2007; Marin 2004).
Another often observed problem is the difficulty encountered by respondents when it comes to recalling information about the alters that they name, for example because of fatigue or satisficing behaviour (Pustejovsky and Spillane, 2009) or simply lack of knowledge of the requested information.
We hypothesised that the presence of missing values might not have been random in the dataset, and that by modelling these values as a separate category of exogenous variables we could have tried to interpret results and understand the reasons behind non-reporting. In addition, elimination of all the egos who reported missing information for at least one of their alters would have resulted in massive loss of observations.
It is sometimes relatively easy to provide an interpretation of the coefficients estimated for the dummy variables indicating a missing value, while in other occasions this is not the case. Most of the missing values were due to lack of information about alters, with the only exception of ego years of education. The corresponding coefficients are reported in the first
line of the M ection of Table 4 (although they are not
significant), followed by a number of dyad measures.
In the case in which the ego did not report his or an alter home location, it was not possible to compute the distance and the variable was treated as missing. In this case, we find significant and negative coefficients for communication face-to-face, by phone and via SMS, meaning that people who do not provide addresses are less likely to communicate by these modes than those who do. As most of the missing values were at the alter-level, this could be interpreted by hypothesising that if an ego does not know where the alter lives he either does not know this person very well, or the person lives too far for the ego to provide an accurate address. If this is true, it would make sense to imagine that there will not be intensive communication between them.
24
loose social network members. Also in the case of missing values for age difference (generally implying that the alters t makes sense to observe that those are people with whom there is no intensive face-to-face or phone interaction. The positive
coefficient on e-
-related interaction by e-mail with these people with respect to the ones whose personal information such as age are known to the ego.
In the case of relationship duration, we observe that the coefficients in the missing values case present the same signs as the case when values are stated, although the absolute magnitudes are slightly higher in the first case. A possible reason for non-reporting this piece of information is that the ego could have known the alter for a long time and could not be able or willing to recall the exact number of years, as this is the way the question was posed. If this is the case, a similar effect on utility in the two cases would not be very surprising.
In some cases, like when the type of relationship with the alter is not specified by the ego, there is no intuitive interpretation of the missing values coefficients, as all the possible categories were included in the multiple-choice question. In our case, none of the coefficients are significant. Also, the missing values in the simple Yes/No questions asking egos whether they ask a given alter for help or discuss problems with them are not easy to interpret. One possible interpretation is that participants decided to skip this question in cases it required them to much thinking/recalling, i.e. in cases when the alter was neither someone very emotionally close to them, nor an acquaintance. This would explain the
positive face-to-face D A
f ego but not too closely.
The opposite signs of the e-mail coefficients and the negative one for the SMS ones are more open to different interpretations.
The separate modelling of the missing values is an important approach in our application. Not only we can learn more about the phenomenon that we are investigating, i.e. the communication patterns, but we can also infer recommendations about survey design, as these coefficients can suggest, for example, that one should not aim at collecting too large and loose networks because the quality and availability of information about the alters
ego. This approach is also the most appropriate in terms of modelling: we have indeed tested whether separate coefficients for the missing values were to be necessarily included or if the implied values were not significantly different from the mean (in the case of continuous variables). It was not the case, and therefore we had to treat them separately, also given that many of them were significant.
25
An interesting question related to the topic studied in the present paper is to what extent the pattern of communication between an ego and her social contacts changes if there is a change in the characteristics of one of the alters, for example if a friend moves further away from the ego. In order to investigate this issue, we applied the forecasting procedure for MDCEV models proposed by Pinjari & Bhat (2010).
In particular, we selected a subsample of our dataset that only includes egos who reported a friend who lives less than 5 km away from them (excluding friends who live with them). If more than one contact with these characteristics existed, we only considered one of them, in particular, the first one reported in the name generator. This resulted in a sample of 398 people. Following Pinjari & Bhat (2010), we computed the frequencies of interaction with all the alters in the base scena
distance to the ego is increased by 10%.
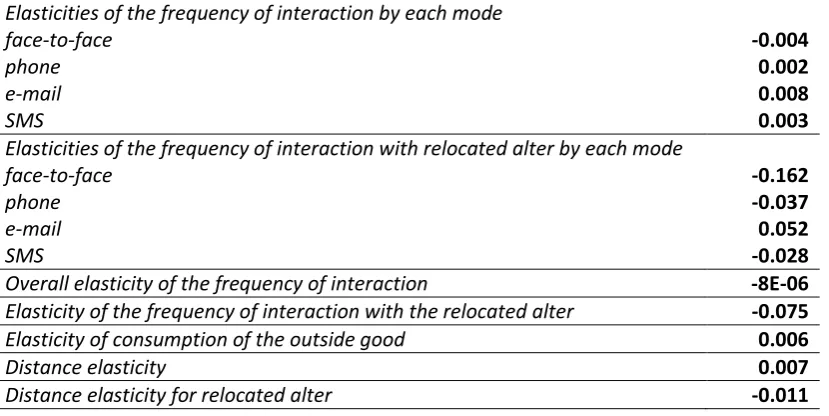
In order to summarise the effect of the change, the forecasting results were used to compute elasticities of the frequency of interaction and of distance travelled across the sample of respondents. These are displayed in Table 5.
Elasticities of the frequency of interaction by each mode
face-to-face -0.004
phone 0.002
e-mail 0.008
SMS 0.003
Elasticities of the frequency of interaction with relocated alter by each mode
face-to-face -0.162
phone -0.037
e-mail 0.052
SMS -0.028
Overall elasticity of the frequency of interaction -8E-06
Elasticity of the frequency of interaction with the relocated alter -0.075
Elasticity of consumption of the outside good 0.006
Distance elasticity 0.007
[image:26.595.94.509.360.568.2]Distance elasticity for relocated alter -0.011
Table 5
These results provide some important insights. First of all, we can observe that the overall frequency of interaction with social contacts is inelastic with respect this change. The elasticities of the frequency of interaction by each mode also underline that a change in distance will cause a reduction of overall face-to-face contact only, as obviously increased distance will mainly impact this type of interaction.
26
positive (though also small), meaning that there is a positive overall impact on the overall distance travelled, so that the ego compensates the drop in travel to the affected alter with more travel to other alters.
As expected, we observe a greater value for the elasticities of the frequency of interaction with the relocated social contact. Not only face-to-face interactions are sensitive to the increase in distance, but also the variation in phone and SMS, although smaller, is found to be negative. This finding potentially highlights the role of the latter two modes as complementary to face-to-face and as being used mainly for coordination purposes with contacts who live close by. E-mail frequency, in line with the overall findings of the model, seems to be likely to increase following an increase in distance. These results hint at the potential presence of substitution effects between face-to-face and ICT, which Sharmeen et al. (2013) already suggested to be strongly related to distance. Finally, we observe that the overall elasticity of interactions with the relocated alter is negative, meaning that overall, the ego will interact less with this person. Differently from our findings, Sharmeen et al. (2014) suggested a positive coefficient for interactions with a relocated alter, though acknowledging the counterintuitive result. Moreover, the authors tested the effect of a neighbour relocation, while our case concerns friends: these findings could highlight the importance of considering dyad-level characteristics such as relationship type to capture an accurate behavioural picture.
Although these results provide interesting insights about the sensitivity of the frequency of interaction to a change in distance between two people, it is important to point out that our forecasts are based on a model estimated on cross-sectional data. Over time, an ego has put together a network of alters that he/she interacts with and the specific pattern of interactions has evolved over that time. This in turn means that the impact distance has on frequency of interaction in the data is reflecting interaction patterns in some continuously evolving and partially stable situation. If an alter moves further away from the ego, then this may reduce interaction, but the effect may be more of less than the difference in the level
live at different distances from the ego. Only the availability of longitudinal data with some location changes by alters or egos would allow us to truly understand the impact that changes in distance will have on interaction patterns. For this reason, the present exercise is likely to overstate the impact, at least in the short term.
27
6. CONCLUSIONS AND FUTURE RESEARCH
Our study investigated the determinants of communication frequency by four modes (face-to-face, phone, e-mail, and SMS) between people and their social network members.
Its findings contribute not only to a better understanding of social networks, but also provide interesting insights for the analysis of travel behaviour for social and leisure purposes.
In terms of understanding communication patterns, we gave a detailed picture of mode-specific determinants of communication, advancing the study of this topic by using a model which simultaneously examines the contribution to utility of communication of both individual and ego-alter characteristics. On top of showing the detailed effect of each of these variables, we provide a picture of satiation effects from different communication modes, showing that despite face-to-face meetings remaining the most preferred type of communication, a lower number of interactions are demanded for each network member with respect to the other modes.
Our work also provides interesting insights into the modelling of travel behaviour, as understanding the pattern of interaction between leisure network members helps to understand travel for social and leisure purposes. The confirmation of the presence of a strong underlying preference for face-to-face contact (especially in the maintenance of core contacts) is an important conclusion given the ongoing debate on potential substitution effects between ICT based modes of communication and most traditional ones.
28
model of the type used here can be used to gain insights into the likely changes in travel patterns resulting from changes in the composition and characteristics of a social network.
The findings and the modelling framework also has implications for the design of activity-based models. As previous research and this work have shown, face-to-face meetings
T
these communication models can be used to determine the probability of an individual generating social activities in their daily activity patterns. Additionally, the communication model gives an indication of what types of in and out-of-household contacts are likely meet and the frequency of this contact. Thus, the model also helps to enhance ABMs that include the coordination of joint inter- and intra-household activities. These enhancements will have important considerations as segments of society move toward less car ownership and vehicle sharing.
The present work constitutes a first step in the use of MDCEV models in the investigation of communication frequencies, and several improvements and more flexible structures can be suggested to better represent this specific behavioural process.
A first issue that we raised is the use of this model when the budget specification is not clear-cut. Both investigating the use of simplified approaches like in this paper and the attempt to derive prices and budgets which are not observed can constitute an interesting next step in this work.
In this paper, we estimated one parameter for each mode of communication to avoid explosion in the number of parameters. Nevertheless, heterogeneity in satiation could be accommodated in
ways other than estimating one for each product. A possible option would be to parameterise the
four mode-specific s as a function of observed ego- and dyad-level characteristics to investigate whether these can affect satiation. We aim to perform a detailed investigation of this research question in future work on this topic.
Moreover, as mentioned while presenting the model results, we have observed that the signs and magnitudes of coefficients suggest the possible presence of complementarities between different modes while in other cases the substitution effects were more evident. The limiting case of perfect substitution between different modes can also not be excluded. The presence of these complex patterns is supported by existing literature, e.g. Sharmeen et al. (2013). The current version of the model, by only allowing the consideration of imperfect substitute goods, does not allow us to test these hypotheses. An extension of the present work to test for more flexible complementarity and substitution patterns is an important area for future work. This could involve developing a nested version of the current model, or relying on model extensions such as Bhat et al. (2015). Finally, as highlighted in the forecasting example, an important next step would be the use of longitudinal data in a study of this type.
Acknowledgements
30
Table 4 Model results
face-to-face phone e-mail SMS
est t-stat est t-stat est t-stat est t-stat
parameters 0.5567 23.92 3.0200 51.67 5.6150 47.34 7.7260 43.35
B 4.3710 14.92 1.4810 5.06 -0.1050 0.34 0.4197 1.37
Ego characteristics
Age
Age = 18 0.0712 0.12 -0.0372 0.06 -2.1840 3.38 0.7791 1.26
Age 19-30 -0.1515 0.61 -0.4043 1.62 -0.5198 2.04 0.7626 2.99
Age 31-45 -0.0415 0.25 -0.0942 0.57 0.0703 0.42 0.5786 3.37
Age 46-60 -0.0999 0.63 -0.1928 1.21 -0.0300 0.18 0.4215 2.52
Education duration (years) -0.0141 1.25 -0.0101 0.88 0.0311 2.69 -0.0211 1.80
Civil status
Married -0.0744 0.51 -0.2604 1.77 -0.4053 2.72 -0.5950 3.99
Widowed -0.0827 0.33 -0.3542 1.39 -0.9495 3.54 -0.4597 1.74
Divorced -0.1570 0.78 -0.2907 1.43 -0.5044 2.44 -0.4056 1.96
Living separately -0.2679 0.67 -0.0515 0.13 -0.6754 1.66 -0.3348 0.82
Employment status
Student 0.3020 0.98 -0.1467 0.47 0.4092 1.31 0.1495 0.48
Homemaker -0.0506 0.36 -0.0711 0.51 -0.2290 1.59 -0.1590 1.10
Retired -0.1903 1.05 -0.1912 1.05 -0.4997 2.68 -0.4710 2.43
Looking for work -0.2901 0.87 -0.0433 0.13 0.1712 0.50 -0.0467 0.14
Number of contacts -0.0083 2.05 -0.0130 3.20 -0.0016 0.39 -0.0001 0.02
Ego-alter characteristics
Distance -0.3250 43.40 -0.075 10.28 0.063 7.47 -0.0538 0.01
Distance=0 0.3900 5.22 -0.6403 8.51 -0.0005 0.00 -0.0462 0.51
Relationship duration -0.2360 17.94 0.0436 3.01 -0.1078 6.18 -0.2271 12.27
Sex homophily
[image:31.842.70.724.118.522.2]31
Both female 0.0093 0.04 0.2510 9.79 0.0858 2.64 0.4698 13.82
Age difference 0.010 10.15 0.0054 4.94 -0.0122 8.06 -0.0101 6.52
Help & Problems
Ask for help 0.2733 5.01 0.4673 8.11 0.3353 4.61 0.3069 3.73
Discuss problems 0.2373 9.06 0.4483 16.03 0.2305 6.64 0.4947 13.07
Ask for help x Discuss
problems 0.1545 2.59 -0.0668 1.06 -0.1434 1.81 -0.1391 1.58
Type of relationship
Spouse 2.1530 26.86 1.1950 15.22 0.2216 2.24 0.9860 10.35
Relative 1st degree 0.5001 14.47 0.5084 14.04 0.0112 0.24 0.3530 7.23
Relative -0.0291 0.68 0.0608 1.36 -0.3955 6.16 -0.0786 1.19
Married into family 0.1171 2.65 0.1381 2.96 -0.5771 8.33 -0.3397 4.68
Acquaintance -0.2245 8.82 -0.3868 13.85 -0.1176 3.53 -0.5809 14.90
Same level of education -0.0433 2.00 -0.0242 1.05 0.1246 4.28 0.1092 3.51
Same citizenship 0.1085 3.91 0.0285 0.94 0.0272 0.75 0.1069 2.64
Missing values coefficients
Ego education duration 0.7742 1.35 -0.4215 0.73 0.8407 1.43 -0.4971 0.82
Distance -0.9766 27.85 -0.2386 6.70 -0.0416 0.98 -0.1308 2.89
Relationship duration -0.5914 6.22 0.3452 3.61 -0.7104 5.55 -0.9118 7.25
Age difference -0.4591 7.05 -0.4893 6.94 0.4654 5.28 0.0283 0.29
Ask for help 0.1899 1.58 0.3669 2.82 -0.4536 2.48 -0.4743 2.16
Discuss problems 0.3971 2.92 -0.1233 0.81 0.3689 1.98 -0.6967 2.59
Type of relationship -0.0217 0.19 -0.1860 1.44 -0.1018 0.63 -0.0272 0.17
Same level of education -0.1045 2.70 -0.1653 4.13 0.0453 0.97 -0.0830 1.65