EFFECTIVENESS OF SENSORY INTEGRATION TO REDUCE
NEGATIVE SYMPTOMS AND TO IMPROVE FUNCTIONAL
ABILITIES IN SCHIZOPHRENIC PATIENTS
DISSERTATION SUBMITTED
FOR
MASTER OF OCCUPATIONAL THERAPY
2016
–
2018
K.M.C.H. COLLEGE OF OCCUPATIONAL THERAPY
THE TAMIL NADU Dr. M.G.R. MEDICAL UNIVERSITY
CERTIFICATE
This is to certify that the research work entitled “EFFECTIVENESS OF SENSORY
INTEGRATION TO REDUCE NEGATIVE SYMPTOMS AND TO IMPROVE FUNCTIONAL ABILITIES IN SCHIZOPHRENIC PATIENTS” was carried out
by Reg. No. 411612001, KMCH College of Occupational Therapy, towards partial fulfillment of the requirements of Master of Occupational Therapy (Advanced OT in Mental Health) of the Tamil Nadu Dr. M.G.R. Medical University, Chennai.
Guide Principal
Mr S.G.Praveen Mrs. Sujata Missal MOT.,M.Sc.,(C&PT) M.Sc. (OT), PGDR. (OT) KMCH College of KMCH College of Occupational Therapy. Occupational Therapy
ACKNOWLEDGEMENT
I praise and thank the Lord Almighty for being my epicenter and my source of
strength throughout my study.
I profess my gratitude and thank my family members for their sincere prayers, unconditional love, encouragement and unstinted support during my course of the study.
I owe my sincere gratitude to Mrs. Sujata Missal, M. Sc. (OT), PGDR (OT),
Principal, K.M.C.H College of Occupational Therapy valuable suggestions and support throughout in conducting the study and for all the facilities which have been provided for us in the institution to conduct the study.
It is my bounded duty to thank Mr. S.G. Praveen, M.O.T (Psychiatry), and Vice Principal, K.M.C.H College of Occupational Therapy to my project guide, for his timely advice, constant support and enormous faith on me throughout the study.
I convey my heartfelt gratitude to Mrs. Sugi Sowmian, M.O.T (Paediatrics), Professor, K.M.C.H College of Occupational Therapy, and her valuable suggestions.
I extend my deep sense of gratitude to Dr. Srinivasan, Consultant Psychiatrist, KMCH, for guiding me throughout the study.
I take this opportunity to express my gratitude to Mr.Venugopal, Professor and K.M.C.H Institution of Health Science, for helping me with statistics and also supported me to conduct the study.
I convey my heartfelt thanks to Dr. B. Ravi Shankar, Dr.Pradeep and Chairman of Naveen Hospital, Trichy Road, Coimbatore for allowing me to do my
project in their hospitals.
I extend my deep sense of gratitude to my subjects, for their cooperation in conducting the study. I gratefully acknowledge the help received from the faculty members of K.M.C.H College of Occupational Therapy.
CONTENTS
SL.NO.
CONTENTS
PAGE NO.
1.
ABSTRACT
1
2.
INTRODUCTION
2
3.
OPERATIONAL DEFINITION
5
4.
AIMS AND OBJECTIVES
6
5.
HYPOTHESES
7
6.
RELATED LITERATURE
8
7.
REVIEW OF LITERATURE
14
8.
CONCEPTUAL FRAMEWORK
17
9.
MATERIALS AND METHODOLOGY
19
10.
DATA ANALYSIS
23
11.
RESULTS
39
12.
DISCUSSION
44
13.
CONCLUSION
45
13.
LIMITATIONS AND RECOMMENDATIONS
46
14.
REFERENCES
47
1
ABSTRACT
OBJECTIVE:
The purpose of this study is to find the effectiveness of sensory integration to reduce negative symptoms and to improve functional abilities in schizophrenic patients
METHOD:
30 schizophrenic patients with negative symptoms, with an age group of 20-60 years were selected and they were conveniently assigned into experimental and control groups. Each group consist of 15 subjects. Subjects were evaluated at the beginning and end of treatment with Adult Sensory Profile, Scale for the Assessment of Negative Symptoms and Specific Level of Functioning Assessment. Sessions
lasted for 45 min to 1 hour. Statistical analyses were performed using ‘t’ test and independent ‘t’ test.
RESULT:
The statistical analyses showed that there was a significant reduction in the negative symptoms and also improvement in the functional abilities of the patients with schizophrenia.
CONCLUSION:
The result helps to conclude that sensory integration is an effective treatment in reducing the negative symptoms and improving the functional abilities of patients with schizophrenia. It also encourages the use of sensory integration therapy in adult population as it is cost effective and has better recovery.
KEY WORDS:
2
INTRODUCTION
Prevalence of schizophrenia is about 0.3% - 0.7%. Schizophrenia is recently categorized into two as non-deficit schizophrenia characterized by negative symptoms and deficit schizophrenia characterized by positive symptoms (1). It usually begins in
early adolescence, has a chronic course and has variable outcomes. People with schizophrenia show decreased likelihood of living independently, maintaining relationships, achieving education or getting employed (12).
Negative symptoms are responsible for more disability in schizophrenia. These factors also contribute to decrease in psychosocial functioning. Negative symptoms are observed in more than 50% of the patients with schizophrenia. The etiology and pathophysiology of negative symptoms are generally less amenable to treatment. Negative symptoms also increase the duration of the hospital stay(3). Based on the suggestions from some work, it is seen that negative symptoms are inversely correlated with functional outcomes(4).
Environment is rich in sensory stimuli and people with schizophrenia have difficulty in processing these stimuli. Sensory integration is a way to explain and describe behavior. It explains why a person behave and respond in certain ways such
as why a person is bothered by labels in clothes, won’t eat certain textures of food or
have difficulty standing in crowds(21). Sensory integration theory provides a framework for treatment. Treatment emphasizes the processing of sensory input, especially tactile and vestibular-proprioceptive, coupled with demand for an adaptive motor response to integrate the input. Certain treatment reflects the basic tenets of sensory integration with children. It is not the same as skill building, or cognitive strategies training(21).
Jean King has linked sensory integration to schizophrenia and her works helped many occupational therapists to use sensory integration as a treatment for
3
supported by many studies showing that schizophrenic individuals have abnormal vestibular reactivity and also by empirical observations of posture, movements, muscle tone and general behaviour in the non-paranoid schizophrenic patient population(11). King specified few elements while planning sensory integration treatment for schizophrenic patients. She also advices to use group treatment as it is cost-effective and also patients can learn from each other and feels that a therapist and one assistant can work effectively with a group of six to ten patients. King suggests that existing space (dining room or day room) can be utilized by moving the furniture and by making the patient move it, as it provides heavy work and proprioceptive feedback for the patient and also states that minimal equipment are needed(21).
A study conducted by Dennis P, et.al reported that functioning of higher cognitive processes are prevented in schizophrenia, because of this thinking is distorted i.e. the information which reaches the higher brain centers are incomplete or inaccurate even though they have normal higher cognitive process. Information processing was hypothesized into many stages such as conscious perception followed by iconic stage and speed of information processing. Iconic storage is hypothetically seen as the preconscious input facility of the nervous system that is capable of detecting, registering and transiently storing very large amounts of information. Iconic stage occurs immediately after sensory detection. For example when a stimulus is presented briefly and terminated, even before conscious perception, all the information about the stimulus will be available in the iconic storage but the
individual is unaware of this until these information’s are transferred to higher brain
function. There are limits in the rate of transfer of information from iconic stage and the information is not transferred until the iconic decompensates are lost. Studies support that there is a disturbance in schizophrenia during the first few hundred milliseconds of processing have generally reported results that are consistent with deficits in either iconic storage or slow information processing from iconic storage to more permanent memory system(23).
Studies on schizophrenic patients also suggest that they have an inability to
4
and King, sensory integrative treatments are subcortical in nature and stimulate the vestibular, auditory, proprioceptive, tactile, visual and olfactory systems(11).
Sensory integration is the process of cognitive neuropsychology (1).Ayres
defined sensory integration as “the organization of sensory input for use. The ‘use’
may be a perception of the body or the world, or an adaptive response, or a learning process, or the development of some neural function”(9). It was identified as one of
the effective treatment methods.
NEED FOR THE STUDY:
• Schizophrenia is often a lifelong illness associated with high rates of morbidity and disability, affecting their performance in independent living, relationship maintenance and achievement in education or employment(12). • Negative symptoms are generally less amenable to treatment. Negative
symptoms also increase the duration of the hospital stay(3).
• Negative symptoms have greater negative impact on cognitive functioning of the patient(21).
• One of the effective treatments is the use of sensory integration therapy(1). • Only few studies are available on this topic(1).
• Sensory integration is a cost-effective treatment and equipment needs are minimal(21).
RESEARCH QUESTION
5
OPERATIONAL DEFINITION
Negative Symptoms: affective flattening, poverty of speech, loss of drive and malfunctioning of social and interpersonal relationships.
Sensory Integration: it is a cognitive neuropsychological process in which sensory data from the environment are received, processed, results in providing appropriate responses and adaptive behaviour.
6
AIMS AND OBJECTIVES
AIM
• To find the effectiveness of sensory integration in schizophrenia in reducing negative symptoms and improving their functional ability skills.
OBJECTIVES
• To reduce the negative symptoms using sensory integration.
7
HYPOTHESES
NULL HYPOTHESIS
Sensory integration provided to patients will not reduce negative symptoms and will not improve their functional abilities.
ALTERNATIVE HYPOTHESIS
8
RELATED LITERATURE
SCHIZOPHRENIA
It is a disorder with “many different faces” (Andreasen, 2001). The most
common symptoms of schizophrenia will include changes in the way a person thinks, feels, and relates to other people and the outside environment. Schizophrenia is officially defined by various combinations of psychotic symptoms in the absence of other forms of disturbance, such as mood disorders, substance dependence, delirium or dementia.
Schizophrenia is a devastating disorder for both the patients and their families.
It disrupts many aspects of the person’s life, decreases their quality of life in terms of
both subjective satisfaction and ability to compete. It also has great impact on society, among the mental disorders, it is the second leading cause of disease burden. After the onset of schizophrenia, many people do not return to expected levels of social and occupational adjustment.
Schizophrenia has been categorized into three phases: prodromal, active and residual. The slow development of signs and symptoms before the diagnosis occurs in prodromal phase. Active phase is seen by the presence of schizophrenia usually with positive symptoms. The final phase is the residual phase, during this active symptoms are controlled and remaining symptoms are negative. After diagnosis patients fluctuate between the residual and active phases, sometimes positive symptoms never
completely resolve and patients remain in active phase. Some schizophrenic patients remain in the residual phase throughout the course of the illness(16).
SYMPTOMS
The symptoms can be divided into three dimensions: positive symptoms, negative symptoms and disorganization (Lenzenweger, 1999).
Positive symptoms
Negative symptoms
9
VULNERABILITY MARKERS FOR SCHIZOPHRENIA
Working Memory Impairment: Many studies reported that schizophrenic patients have impaired ability to perform laboratory tasks that usually involving the central executive component of this working memory. Working memory problems are more stable and do not fluctuate in schizophrenic persons.
Eye-Tracking Dysfunction: when people with schizophrenia were made to
track the motion of the pendulum or similar oscillating stimulus while the
person’s head is kept in static position. Instead of smooth-pursuit eye movement schizophrenic persons showed frequent interruptions by numerous rapid movements
TREATMENT
ANTIPSYCHOTIC MEDICATION: Medications are divided into first
generation of drugs (1950s) are also called traditional or classical antipsychotics and second generation drugs (1990s) are also known as atypical antipsychotics as they are less likely to produce motor side effects when compared to classical antipsychotics. Chlorpromazine (Thorazine) is a first generation drug and was successful in treating chronic psychotic patients. The second generation antipsychotic includes risperidone (Risperdal), olanzapine (Zyprexa), quetiapine (Seroquel), etc. These atypical antipsychotics are less likely to produce tardive dyskinesia and are also useful in maintenance treatment to reduce the risk of relapse. These drugs have good effects on positive symptoms and the bad news is that these are less effective in treating negative symptoms.
PSYCHOSOCIAL TREATMENT: Many interventions are proved to be
10
SENSORY INTEGRATION
Sensory processing is the ability of a person to register and modulate sensory information and to organize this input to respond to situational demands. Sensory processing difficulties can occur in some or all sensory systems and are expressed by extreme behaviours in response to sensory systems and are ranging from hypersensitivity to hyposensitivity , from sensory seeking to sensory avoidance behaviours(18). Dunn’s (1997) model of sensory processing describes the patterns
consistent with the supersensitivity and overinhibition constructs. Based on this model the responses to sensory experiences are organized across two dimensions into four
quadrants. One dimension is low versus high neurological threshold. The other reflects behaviours that match versus counteract the threshold. Individuals with low threshold require less stimulation for sensation to be perceived and to receive a quick response (super sensitivity). In contrast, individuals with high neurological thresholds require more stimulation and thereby are more likely to miss sensory cues (overinhibition). The other quadrant differentiates between responses that are in accord with threshold level versus those that serve to counteract it. Resulting quadrants are sensory sensitivity (irritability and distractibility with sensation) and sensory avoiding (responses to counteract a low neurological threshold).
Modulation is an important aspect in the process of sensory integration, by
which the nervous system balances the person’s level of arousal with the intensity of stimuli experienced. It’s an internal thermostat which cues one when to arouse or to
calm oneself. When there is a sensory integrative problem, the person’s internal capacity to modulate is affected. Vestibular and tactile information processing deficits are found in children and adults with schizophrenia, substance abuse, also with persons with post-traumatic stress disorder. Sensory integrative problems can have a
major impact on the person’s autonomy, independence and mastery of new skills.
Hitting, smashing or throwing things can be related to hypersensitivities. Mood regulation problems can be found in people with combination of both hypo and hypersensitivities, can be often noticed in bipolar disorder. The person with sensory
11
An integration of data from a broad spectrum of studies reports that sensory sensitivity, sensory avoiding and low registration are common responses in schizophrenic population. Sensation avoiding in schizophrenia is characterized by the appeal of predictable and low demand environments together with presence of negative symptoms(5).
Sensory integration is a framework first described by occupational therapist A.
Jean Ayres, PhD, in the 1970s. It refers to the body’s way of handling and processing
sensory inputs from the environment. Based on Ayres and King, sensory integrative treatments are subcortical in nature and stimulate the vestibular, auditory,
proprioceptive, tactile, visual and olfactory systems(11).
COGNITIVE REMEDIATION THERAPY (CRT)
Psychiatric conditions are commonly accompanied with cognitive deficits and sometimes these can be the core features of these disorders. Cognitive remediation can also be called as cognitive rehabilitation but some experts claims that intervention that are general refers to cognitive rehabilitation and interventions that are developed to specific etiologies refers to cognitive remediation. Cognitive remediation is based on neuroplasticity (neurobiological process by which learning and environmental factors alter cognitive processing). The goal of cognitive remediation therapy is to improve the cognitive functions and also the ability to generalize the improved function by providing a behavioural training intervention(22).The definition was
updated in 2012 as “an intervention targeting cognitive deficits using scientific
principles of learning with ultimate goal of improving functional outcomes”.
Cognitive remediation helps to stimulate new learning or relearning of cognitive tasks and therefore improves cognitive deficit. This therapy is to engage patient in learning activities that improve neurocognitive skills relevant to their recovery goals.
Cognitive remediation programs vary in implication method, area focused and complexity. Example some programs are administered individually and some in
12
Eack (2012) proposed principle components of cognitive remediation for schizophrenic individuals: (1) strategic: developing cognitive strategies to complete tasks; (2) drill and practice: repetition of strategies until performance noted; (3) hierarchical: tasks graded from simple to complex; (4) cueing: use of external aids to support cognitive abilities; (5) fading: gradual removal of external aids to increase the task difficulty; (6) adaptive: adjusting the difficulty of cognitive tasks to keep it interesting and challenging; (7) anchoring: linking the learned skills to real-world behaviours; (8) integrating with other treatment methods: using remediation along with other treatment to increase the possible benefits.
REPETITIVE TRANSCRANIAL MAGNETIC STIMULATION:
TMS was developed in 1980’s to study about the functioning of the brain. In
this procedure a magnetic field is created and passed through the skull which creates a current in the brain and this current activates the nearby nerve cells. A coil of wire s wrapped in a plastic and is held to the head while a capacitor discharges the magnetic field. Researchers found that repeated application of TMS over a period of several days showed changes in the brain activity. The magnetic field can be targeted to any specific region of the brain where the nerve cells are associated with the psychiatric symptoms. Recent studies on the use of repetitive TMS reported that it had promising reduction of negative symptoms of schizophrenia. Other studies also showed reduction of positive symptoms.
ELECTROCONVULSIVE THERAPY:
It is a medical procedure in which seizures are induced in patients by giving electrical shock through the electrodes that are attached to the scalp. During brief procedures, anesthesia is administered. Mortality rate is about 2 deaths per lakh treatments and also has anesthesia complications. It is mainly used for treating symptoms that are resistant to other treatments. Studies report that it has short-term
13
MINDFULNESS INTERVENTIONS FOR SCHIZOPHRENIA:
14
REVIEW OF LITERATURE
Jinoos Jadidi, and Mina Sadat Mirshoja conducted a study to describe the impact of the sensory integration approach on positive and negative symptoms in patients with non-paranoid schizophrenia. The treatment involved eight sessions held 3 days a week and lasting 45 minutes each. The patient had a defined Iranians form
social relationships schizophrenia evaluated and treatment. Sensory integration therapy in these patients focused on the following elements: vestibular and proprioceptive senses, exercises to improve walking, improving upper extremity coordination and movement, writing activities, cognitive skills, activities of daily living, and family therapy. The subject (A.H.) was a 32-year-old male graduate student with no history of previous hospitalization. His diagnosis was schizophrenia. After eight sessions, increased awareness of the environment, improved posture and gait pattern, improved motivation and enjoyment, improved patient tolerance, improved appearance and personal hygiene, loss of purposeful behavior, a realistic plan of action every day, improved attention span, improved decision-making skills, and improved community involvement and coping skills were achieved. The environment is rich in sensory stimuli. The integration and processing of each individual senses creates different behavioral responses. The results showed that a sensory integration approach combined with drug therapy is an effective treatment for patients with schizophrenia.
Isa Levine, Helen O'Connor, Beverley Stacey were conducted a pilot study at the Douglas Hospital Center of Montreal in 1975 to determine whether stimulating the sensory integrative processes of the central nervous system would effect any
behavioral changes in non-paranoid schizophrenics. Based on the theory of Lorna Jean King, the paper delineates the plan of the study, the testing battery developed for
evaluating patients, and the program of activities utilized during the project. The results of the pilot study reveal that a correlation seems to exist between sensory integrative functioning and the behavior of chronic non-paranoid schizophrenics.
Rashmi Patel, Nishamali Jayatilleke, Matthew Broadben, conducted a
15
processing and assess their relationship with clinical outcomes. The study concluded that negative symptoms were common and associated with adverse clinical outcomes, consistent with evidence that these symptoms account for much of the disability, admission and readmission, and also increases duration of the hospital stay for the patients with schizophrenia. Natural language processing provides a means of conducting research in large representative samples of patients, using data recorded during routine clinical practice.
Jonathan Rabinowitz, Stephen Z. Levine, George Garibaldi, did a study to find the relative effects of negative symptoms on functioning, as compared to other
symptoms, using data from the National Institute of Mental Health CATIE trial of chronic schizophrenia by examining correlations of Positive and Negative Syndrome Scale factors, Calgary Depression Rating Scale and select items from Heinrich's and Lehman's Quality of Life Scales measuring aspects of functioning that did not overlap with negative symptoms. The data suggests that negative symptoms are more strongly correlated with functioning than the positive symptoms and also shows that improving negative symptoms will improve functioning.
Catana Brown, Rue L. Cromwell, Diane Filion conducted a study to find the possible coexistence of supersensitivity and overinhibiition in schizophrenia was studied using the Adult Sensory Profile. Individuals with schizophrenia, bipolar disorder and mentally healthy people were compared. Results showed that schizophrenic patients tend to miss the available stimuli and when stimuli were detected, they were avoided.
Judith E. Reicman and Anne B. Blakeney concluded a study that there was a need for further efficacy studies in this area and for the development of standardized tests of sensory integrative status in adults. In the absence of such a tool, Crist (1979) was not able to quantify changes in body image using a modification of the Goodenough Harris Draw-a-Man Test. However, she reported many subjective observations of improved ability to function in the treatment group as well as a
16
Bailey (1978) focused on the effect of sensory integrative treatment on increasing verbalizations in chronic schizophrenics, an observation reported by King (1974) and other therapists (Blakeney, Strickland & Wilkinson, 1983). While Bailey's study lends partial empirical support to increased verbalizations following sensory integrative treatment, her study showed that sensory integrative activities improved the quality of life in non-paranoid schizophrenic patients but had less effect on rate and quality of speech.
Paola Rocca, Cristiana Montemagni, et.al conducted a study to find the effect of negative symptoms on everyday functioning in schizophrenic patients. The
Personal and Social Performance scale and Quality of Life scales were used. The results suggest that the negative symptoms have a greater correlation with functional outcomes.
Armida Mucci, Paola Rucci, et,al. conducted a study to find construct
validity, internal consistency and factor structure of “The Specific Level Of Functioning Scale”. It was conducted on 895 Italian people with schizophrenia and was analysed by means of multitrait-multimethod approach. Results suggested that SLOF is a reliable and valid instrument for the assessment of social functioning and it also has good construct validity and internal consistency.
17
CONCEPTUAL FRAMEWORK
SENSORY INTEGRATION
King hypothesized that person diagnosed as having chronic schizophrenia have deficits in their reception or processing of proprioceptive and vestibular information and that these sensory integrative deficits contribute to or perhaps even cause the psychotic symptoms.
King also postulated that these schizophrenic patients are unable to move fluidly because they have an ineffective proprioceptive feedback mechanism, the most important component which is an underactive or underactive vestibular regulating system, i.e. the person with schizophrenia cannot, at subcortical level, effectively use sensory information regarding his or her own position and this inability leads to restrictive, protective movement.
By limiting the movements, the individual tends to exacerbate the problem by decreasing vestibular and proprioceptive input. Having to think about moving slows the person, and movement loses its fluidity. This tends to interfere with the
individual’s ability to engage in normal physical activity, this ultimately lessens their
comfort in social situation and increases withdrawal.
An integration of data from a broad spectrum of studies reports that sensory sensitivity, sensory avoiding and low registration are common responses in schizophrenic population. Sensation avoiding in schizophrenia is characterized by the appeal of predictable and low demand environments together with presence of negative symptoms
The aim of this study is to provide sensory integration therapy which helps the patients to process the sensory stimuli there by resulting in reduction of negative symptoms and improving their functioning abilities
18
Clients meeting the inclusion
criteria
Experimental Group
Intervention
Ballon activity, Walking in different patterns,
Tug of war, Facial expression , Ball games,
Writing activity, Finding objects in a box of
plastic foam beads, Wheelchair activity
Effects of SI in reucing negative
symptoms and improvement in
19
MATERIALS AND METHODOLOGY
RESEARCHAPPROACH:
An experimental approach was adapted to assess the effectiveness of sensory
integration in reducing negatives symptoms and improving functional abilities in schizophrenic patients.
RESEARCH DESIGN:
The present study was two groups pre-test and post-test is a
quasi-experimental study design.
The diagrammatic representation of the design is as follows:
Experimental Group 1 = Q1 ---X1 ---Q2
Control Group 2 = Q1 ---X2 ---Q2
Where, Q1 = pretest Q2 = posttest
X1 = Sensory Integration
X2 = Cognitive remediation therapy
VARIABLES UNDER THE STUDY:
Dependent : Negative symptoms and functional abilities
Independent : Sensory integration and cognitive remediation
20
SETTING AND DURATION OF INTERVENTION:
This study was conducted at KMCH department of occupational therapy,
Naveen Mental Hospital, Krishna Nursing Home and Kongunadu Mananala Arakattalai. The duration of intervention was 2 months.
POPULATION OF THE STUDY:
Clients diagnosed with schizophrenia and showing negative symptoms.
CRITERIA FOR SAMPLE SELECTION:
Following criteria’s were adopted for the selection of samples.
INCLUSION CRITERIA:
Patients with Schizophrenia
- Age group between 20 – 60 years.
- Minimum duration of 2 years
- With negative symptoms.
- With SANS score of 30
EXCLUSION CRITERIA:
Schizophrenic Patients with positive symptoms.
Patients with head injury, deficit with neurocognition.
SAMPLE SIZE:
The sample size was 30.
SUBJECT:
Experimental Group 1(SIT) = 15 subjects
21
SAMPLING TECHIQUES:
The subjects were selected according to the selection criteria and they were randomly assigned to the experimental and control groups.
MEASUREMENT TOOLS:
ADULT SENSORY PROFILE:
It is based on the Dunn’s model of sensory processing and is a self-reporting tool used to find the responses to sensory experiences. The scale has 6 items divided into four quadrants such as Low Registration, Sensation Seeking, Sensory Sensitivity and Sensory Avoiding. Participants indicate how often they respond to the sensory event using a 5-point Likert scale (1-almost never to 5-almost always). The result scores range from 5 to 75 and the results are divided based on age criteria like 11-17years, 18-64years, 65 and older. The questioner has good validity, internal consistency with coefficient alpha values: for sensory seeking-0.81, sensory sensitivity-0.82, for low registration-0.86 and for sensory avoidance 0.85 (18).
SPECIFIC LEVEL OF FUNCTIONING:
It includes 43 items that are divided into six subscales namely Physical Functioning, Personal Care Skills, Social Acceptability, Activities of Community Living and Work Skills. These are scored on a 5-point Likert Scale (1-poorest functioning to 5-best functioning) describing the frequency of
behaviour and /or patient’s level of independence. The study conducted on 895
Italian people with schizophrenia reported that SLOF is reliable and valid instrument for the assessment of social functioning. It also has good construct validity and internal consistency and a well-defined factor structure (19).
SCALE FOR THE ASSESSMENT OF NEGATIVE SYMPTOMS
(SANS)
22
INTERVENTION:
This study was conducted at KMCH Department of Occupational Therapy, Naveen Mental Hospital, Krishna Nursing Home and Kongunadu Mananala
Arakattalai between the periods of October 2017 to December 2017. A total of 24 sessions were conducted for both the experimental and control groups. Sessions were
23
DATA ANALYSIS
[image:40.595.99.534.227.372.2]Paired t test of SANS and SLOF between Experimental and Control
Group
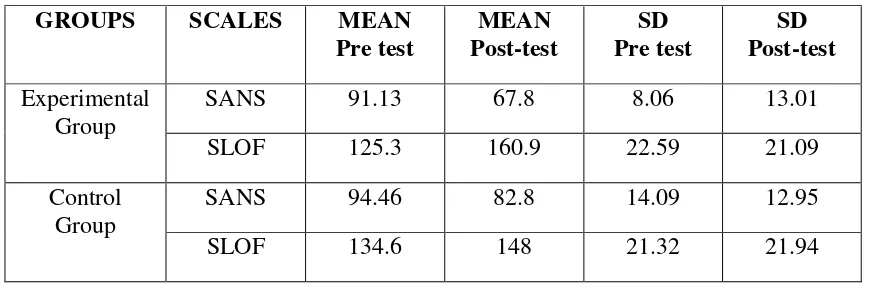
TABLE 1.1 Pre-test and Post-test of SANS and SLOF between Experimental and
Control Group
GROUPS SCALES MEAN
Pre test MEAN Post-test SD Pre test SD Post-test Experimental Group
SANS 91.13 67.8 8.06 13.01
SLOF 125.3 160.9 22.59 21.09
Control Group
SANS 94.46 82.8 14.09 12.95
SLOF 134.6 148 21.32 21.94
TABLE 1.2 Paired t test of SANS and SLOF
GROUP SCALES Paired Difference
MEA N D if fer en ce SD Std. E rr o r Me an t df Sig. (2 -t ai led ) L ow er U pp er Experimental Group
SANS 23.33 7.306 1.886 12.36 14 .000 19.28 27.37
SLOF 35.6 9.708 2.506 14.202 14 .000 40.97 30.22
Control Group SANS 11.66 4.77 1.233 9.461 14 .000 9.02 14.31
SLOF 13.4 9.470 2.445 5.480 14 .000 18.64 8.15
The table 1.2 shows that there is reduction in negative symptoms and increase
in functional abilities within the experimental and control group based on the paired
[image:40.595.82.552.419.628.2]24
GRAPH 1
91.13 94.46
125.3
134.6
67.8
82.8
160.9
148
0 20 40 60 80 100 120 140 160 180
experimental SANS
control SANS experimental
SLOF
control SLOF
Pre and Post Test of SANS and SLOF
25
Independent t test of SANS and SLOF between Experimental and
Control Group
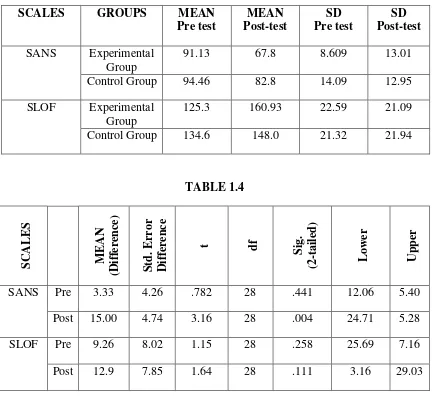
TABLE 1.3
SCALES GROUPS MEAN
Pre test MEAN Post-test SD Pre test SD Post-test
SANS Experimental Group
91.13 67.8 8.609 13.01
Control Group 94.46 82.8 14.09 12.95
SLOF Experimental Group
125.3 160.93 22.59 21.09
Control Group 134.6 148.0 21.32 21.94
TABLE 1.4 S CA L E S M E AN (D iff er en ce ) S td. E rr or Diff er en ce
t df
S ig. (2 -taile d ) L owe r Upp er
SANS Pre 3.33 4.26 .782 28 .441 12.06 5.40
Post 15.00 4.74 3.16 28 .004 24.71 5.28
SLOF Pre 9.26 8.02 1.15 28 .258 25.69 7.16
Post 12.9 7.85 1.64 28 .111 3.16 29.03
[image:42.595.101.535.151.549.2]26
GRAPH 2
91.13
67.8
125.3
160.93
94.46
82.8
134.6
148
0 20 40 60 80 100 120 140 160 180
SANS pretest SANS post-test SLOF pre-test SLOF post-test
Pre and Post Test of Experimental and
Control Group
27
Paired t test of individual components of SANS between
[image:44.595.76.554.172.414.2]Experimental and Control Groups
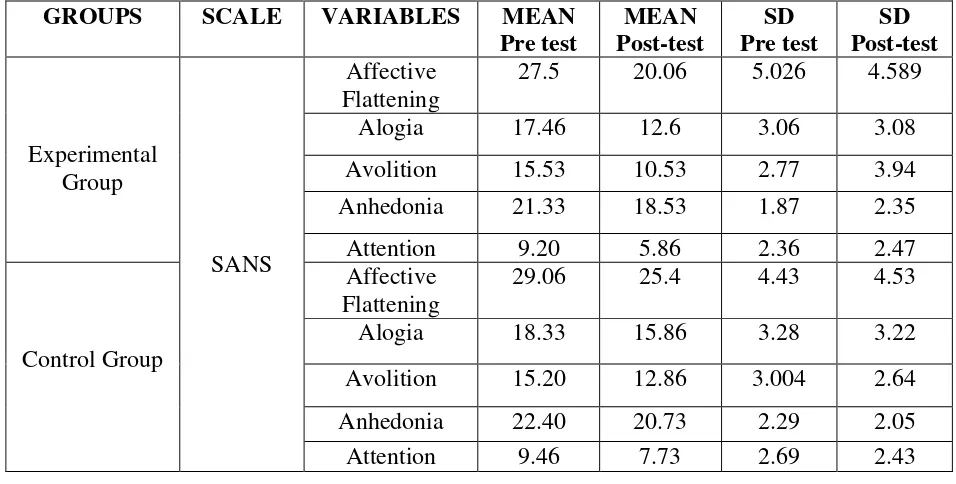
TABLE 2.1
GROUPS SCALE VARIABLES MEAN
Pre test MEAN Post-test SD Pre test SD Post-test Experimental Group SANS Affective Flattening
27.5 20.06 5.026 4.589
Alogia 17.46 12.6 3.06 3.08
Avolition 15.53 10.53 2.77 3.94
Anhedonia 21.33 18.53 1.87 2.35
Attention 9.20 5.86 2.36 2.47
Control Group
Affective Flattening
29.06 25.4 4.43 4.53
Alogia 18.33 15.86 3.28 3.22
Avolition 15.20 12.86 3.004 2.64
Anhedonia 22.40 20.73 2.29 2.05
[image:44.595.62.571.445.697.2]Attention 9.46 7.73 2.69 2.43
TABLE 2.2
Table 2.1 and table 2.2 indicates that there is a reduction in symptoms in all the component of SANS in both experimental and control group but not up to a significant level.
GROUP SCA
L E S VA RIA -BLES Paired Difference M E AN (D iff er e n ce )
SD Std.
E
rr
or
M
ean t df
S
ig. (2- taile
d ) L owe r Upp er Experimental
Group SANS
Affective Flattening
7.466 3.181 .821 9.089 14 .000 5.70 9.22
Alogia 4.866 2.06 .533 9.125 14 .000 3.72 6.01 Avolition 5.0 2.699 .696 7.174 14 .000 3.50 6.49 Anhedonia 2.80 1.97 .508 5.501 14 .000 1.70 3.89 Attention 3.333 2.41 .622 5.356 14 .000 1.99 4.66
Control Group
Affective Flattening
3.666 1.397 .3607 10.163 14 .000 2.89 4.44
28
GRAPH 3
27.5
29.06
17.46 18.33
15.53 15.2
21.33 22.4
9.2 9.4
6
20.6
25.4
12.6
15.86
10.53
12.86
18.53
20.73
5.86
7.73
0 5 10 15 20 25 30 35
Axis Title
Pre and post of SANS
29
Independent t test of individual components of SANS between
experimental and control groups
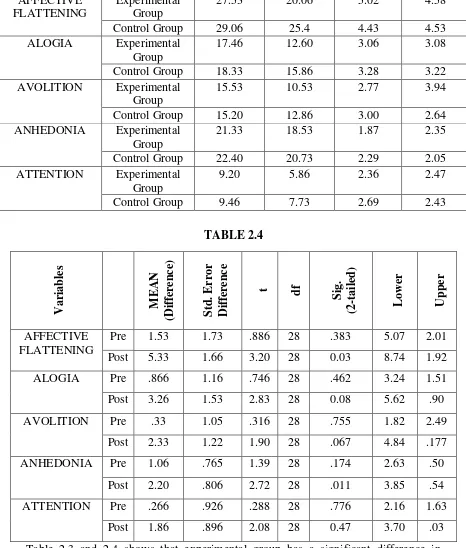
TABLE 2.3
VARIABLES GROUPS MEAN
Pre test MEAN Post-test SD Pre test SD Post-test AFFECTIVE FLATTENING Experimental Group
27.53 20.06 5.02 4.58
Control Group 29.06 25.4 4.43 4.53
ALOGIA Experimental Group
17.46 12.60 3.06 3.08
Control Group 18.33 15.86 3.28 3.22
AVOLITION Experimental Group
15.53 10.53 2.77 3.94
Control Group 15.20 12.86 3.00 2.64
ANHEDONIA Experimental Group
21.33 18.53 1.87 2.35
Control Group 22.40 20.73 2.29 2.05
ATTENTION Experimental Group
9.20 5.86 2.36 2.47
Control Group 9.46 7.73 2.69 2.43
TABLE 2.4 Var iab les M E AN (D iff er en ce ) S td. E rr or Diff er en ce
t df
S ig. (2 -taile d ) L owe r Upp er AFFECTIVE FLATTENING
Pre 1.53 1.73 .886 28 .383 5.07 2.01 Post 5.33 1.66 3.20 28 0.03 8.74 1.92
ALOGIA Pre .866 1.16 .746 28 .462 3.24 1.51
Post 3.26 1.53 2.83 28 0.08 5.62 .90
AVOLITION Pre .33 1.05 .316 28 .755 1.82 2.49
Post 2.33 1.22 1.90 28 .067 4.84 .177
ANHEDONIA Pre 1.06 .765 1.39 28 .174 2.63 .50
Post 2.20 .806 2.72 28 .011 3.85 .54
ATTENTION Pre .266 .926 .288 28 .776 2.16 1.63
Post 1.86 .896 2.08 28 0.47 3.70 .03
[image:46.595.82.548.192.740.2]30
GRAPH 4
27.53
20.06
17.46
12.6
15.53
10.53
21.33
18
.53
9.2
5.86
29.06
25.4
18.33
15.86
15.2
12.86
22.4
20.73
9.46
7.73
0 5 10 15 20 25 30 35
Pre and post of Experimental and Control
31
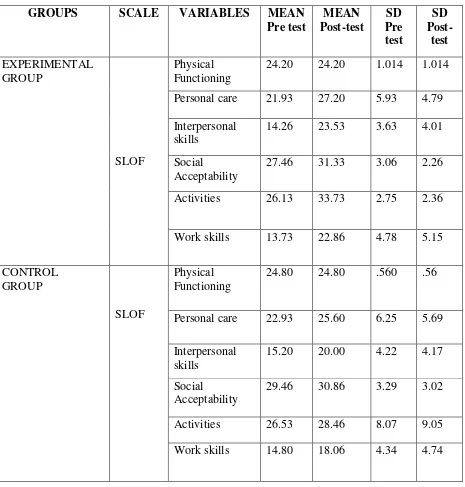
[image:48.595.86.551.144.631.2]Paired t test of individual components of SLOF between experimental and control groups
TABLE 3.1
GROUPS SCALE VARIABLES MEAN
Pre test MEAN Post-test SD Pre test SD Post-test EXPERIMENTAL GROUP SLOF Physical Functioning
24.20 24.20 1.014 1.014
Personal care 21.93 27.20 5.93 4.79
Interpersonal skills
14.26 23.53 3.63 4.01
Social
Acceptability
27.46 31.33 3.06 2.26
Activities 26.13 33.73 2.75 2.36
Work skills 13.73 22.86 4.78 5.15
CONTROL GROUP
SLOF
Physical Functioning
24.80 24.80 .560 .56
Personal care 22.93 25.60 6.25 5.69
Interpersonal skills
15.20 20.00 4.22 4.17
Social
Acceptability
29.46 30.86 3.29 3.02
Activities 26.53 28.46 8.07 9.05
32
TABLE 3.2
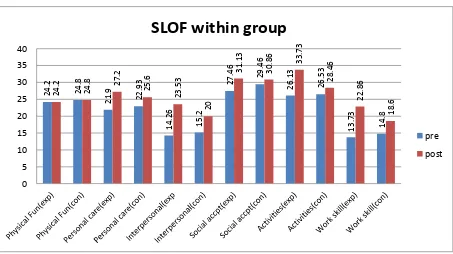
Table 3.1 and 3.2 shows the mean scores of pre and post-test within the experimental and control group. The values indicate the improvement of each component of SLOF in both the groups.
GRAPH 5 G RO UP SCAL E S VARIA B L ES Paired Difference M E A N SD Std. E rr o r M ea n
t df
Sig . (2 -ta iled) L o wer Upper Experi-mental Group SLOF Physical Functioning
- - - - 14 .000 - -
Personal care 5.26 2.631 .679 7.752 14 .000 6.72 3.80 Interpersonal
skills
9.26 4.13 1.06 8.66 14 .000 11.55 6.97
Social
Acceptability
3.66 1.79 .464 7.89 14 .000 4.66 2.67
Activities 7.60 3.52 .909 8.35 14 .000 9.55 5.64 Work skills 9.13 4.01 1.03 8.80 14 .000 11.35 6.90 Control
Group
Physical Functioning
- - - - 14 .000 - -
Personal care 2.66 1.91 .494 5.39 14 .000 3.72 1.60 Interpersonal
skills
4.80 2.27 .587 8.17 14 .000 6.05 3.54
Social
Acceptability
1.40 2.44 .630 2.21 14 .044 2.75 .04
Activities 1.93 4.14 1.07 1.8 14 .093 4.23 .36 Work skills 3.26 2.78 .720 4.53 14 .000 4.81 1.72
24.2 24.8 21.9 22.93 14.26 15.2 27.46 29 .46 26.13 26.53 13.73 14.8 24.2 24.8 27.2 25 .6 23.53 20 31.13 30.86 33.73 28.46 22.86 18.6 0 5 10 15 20 25 30 35 40
SLOF within group
[image:49.595.62.569.99.417.2] [image:49.595.96.549.518.772.2]33
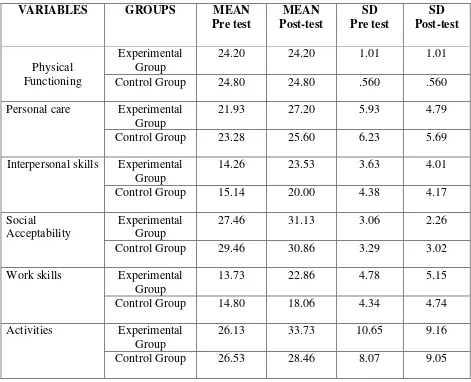
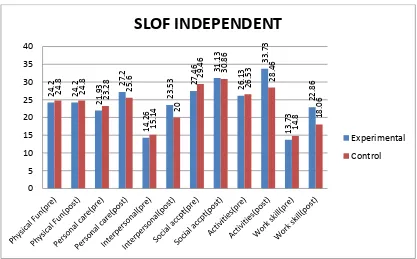
[image:50.595.80.551.179.561.2]Independent t test of individual components of SLOF between
experimental and control groups
TABLE 3.3
VARIABLES GROUPS MEAN
Pre test MEAN Post-test SD Pre test SD Post-test Physical Functioning Experimental Group
24.20 24.20 1.01 1.01
Control Group 24.80 24.80 .560 .560
Personal care Experimental Group
21.93 27.20 5.93 4.79
Control Group 23.28 25.60 6.23 5.69
Interpersonal skills Experimental Group
14.26 23.53 3.63 4.01
Control Group 15.14 20.00 4.38 4.17
Social
Acceptability
Experimental Group
27.46 31.13 3.06 2.26
Control Group 29.46 30.86 3.29 3.02
Work skills Experimental Group
13.73 22.86 4.78 5.15
Control Group 14.80 18.06 4.34 4.74
Activities Experimental Group
26.13 33.73 10.65 9.16
34 TABLE 3.4 Var iab les M E AN (D iff er en c
e) Std.
E rr or Diff er en c
e t df
S ig. (2 -taile d ) L owe r Upp er Physical Functioning
Pre .60 .299 2.005 28 .055 1.21 .01 Post .60 .299 2.005 28 .055 1.21 .01
Personal care
Pre 1.35 2.27 .594 27 .558 6.02 3.31 Post 1.60 1.92 .832 28 .412 2.33 5.53
Interpersonal skills
Pre .876 1.49 .588 27 .562 3.93 2.18 Post 3.53 1.49 2.36 28 .025 .46 6.59
Social Acceptability
Pre 2.00 1.16 1.72 28 .096 4.37 .37 Post .266 .974 .274 28 .786 1.72 2.26
Work skills
Pre 1.06 1.66 .639 28 .639 4.48 2.35 Post 4.80 1.80 2.65 28 .013 1.09 8.50
[image:51.595.93.540.76.395.2]Activities Pre .400 3.45 .116 28 .909 7.47 6.67 Post 5.26 3.32 1.58 28 .125 1.54 12.08
Table 3.3 and 3.4 shows that there is a marked increase in functional abilities of the experimental group and slight increase in the contrl group. This show that experimental group has significant increase in functional abilities.
[image:51.595.107.524.506.765.2]35
[image:52.595.102.535.127.390.2]Paired t test of ASP between Experimental and Control Groups
TABLE 4.1SCALE GROUPS VARIABLES MEAN
Pre test MEAN Post-test SD Pre test SD Post-test ASP EXPERIMENTAL GROUP Low Registration
52.93 39.06 2.74 1.96
Sensory Seeking
34.20 38.00 6.40 1.65
Sensory Sensitivity
36.60 34.06 3.54 3.28
Avoidance 42.8 37.33 5.21 5.61
CONTROL GROUP
Low
Registration
53.33 50.26 13.51 12.57
Sensory Seeking
33.8 34.46 8.37 7.91
Sensory Sensitivity
37.20 34.33 6.38 7.87
Avoidance 41.33 39.13 8.32 6.25
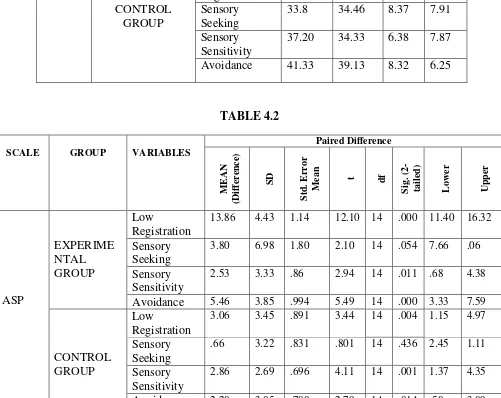
TABLE 4.2
SCALE GROUP VARIABLES
Paired Difference M E A N (Dif fer ence ) SD Std. E rr o r M ea n
t df
Sig . (2 -ta iled) L o wer Upper ASP EXPERIME NTAL GROUP Low Registration
13.86 4.43 1.14 12.10 14 .000 11.40 16.32
Sensory Seeking
3.80 6.98 1.80 2.10 14 .054 7.66 .06
Sensory Sensitivity
2.53 3.33 .86 2.94 14 .011 .68 4.38
Avoidance 5.46 3.85 .994 5.49 14 .000 3.33 7.59
CONTROL GROUP
Low
Registration
3.06 3.45 .891 3.44 14 .004 1.15 4.97
Sensory Seeking
.66 3.22 .831 .801 14 .436 2.45 1.11
Sensory Sensitivity
2.86 2.69 .696 4.11 14 .001 1.37 4.35
Avoidance 2.20 3.05 .788 2.79 14 .014 .50 3.89 The mean value Table 4.1 and 4.2 indicates that both the group has significant
[image:52.595.66.567.302.700.2]36
GRAPH 7
52.93 53.33
34.2 33.8
36.6 37.2
42.8
41.33
39.06
50.28
38
34
.46
34.06 34.3
37.33 39.13
0 10 20 30 40 50 60
Pre and post within Groups
37
Independent t test of ASP between Experimental and Control Groups
TABLE 4.3
VARIABLES GROUPS MEAN
Pre test MEAN Post-test SD Pre test SD Post-test Low Registration Experimental
Group
52.93 39.06 10.64 7.62
Control Group 79.33 50.26 98.72 12.57
Sensory Seeking Experimental Group
34.20 38.00 6.14 6.40
Control Group 33.80 34.46 8.37 7.91
Sensory Sensitivity Experimental Group
36.60 34.06 3.54 3.28
Control Group 37.20 34.33 6.38 7.87
Avoidance Experimental Group
42.80 37.33 5.21 5.61
[image:54.595.71.560.398.629.2]Control Group 41.33 39.13 8.32 6.25
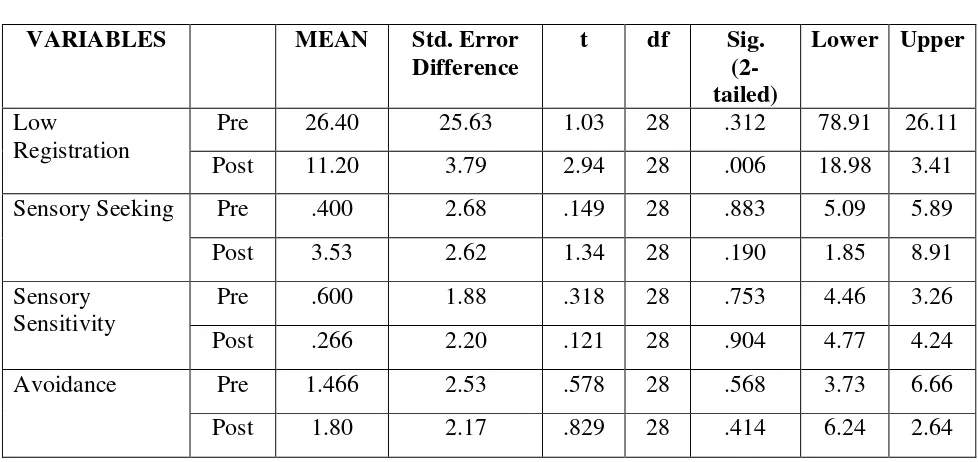
TABLE 4.4
VARIABLES MEAN Std. Error
Difference
t df Sig.
(2-tailed)
Lower Upper
Low
Registration
Pre 26.40 25.63 1.03 28 .312 78.91 26.11
Post 11.20 3.79 2.94 28 .006 18.98 3.41
Sensory Seeking Pre .400 2.68 .149 28 .883 5.09 5.89
Post 3.53 2.62 1.34 28 .190 1.85 8.91
Sensory Sensitivity
Pre .600 1.88 .318 28 .753 4.46 3.26
Post .266 2.20 .121 28 .904 4.77 4.24
Avoidance Pre 1.466 2.53 .578 28 .568 3.73 6.66
Post 1.80 2.17 .829 28 .414 6.24 2.64
The results of the Table 4.3 and 4.4 indicate that experimental group is more effective
38
GRAPH 8
52
.9
39.06
34.2 33.8
36.6
34.06
42.8
37.33
53.3
50.26
33.8 34.46
37.2
34.33
41.33
39
.13
0 10 20 30 40 50 60
Pre and Post Between Groups
39
RESULTS
All participants of the study were selected using SANS as the screening tool. 30 schizophrenic patients with negative symptoms were selected. The experimental group had 15 patients and the control group had 15 patients. SLOF and ASP were administered on them. The results of SANS and SLOF are provided .The results of
post intervention of SANS and SLOF were calculated for experimental and control group using paired t test (Table 1.1) and independent t test (Table 1.2). The results of paired t test showed that there was significant difference in post intervention of
experimental group (mean value of 23.33, SLOF-35.6 and t value of SANS-12.36, SLOF-14.20) and control group also had difference (mean of SANS-11.66, SLOF-13.4 and t value of SANS-9.461, SLOF-5.480) in both negative symptoms and functional abilities. The independent t test showed that experimental group (mean value of SANS-15.00, SLOF-12.9, t value of SANS-3.16, SLOF-1.64) had significant difference than control group in reduction of negative symptoms and improvement of functional abilities in schizophrenic patients (Table 1.3 and Table 1.4).
Results of analysis of Scale for the Assessment of Negative Symptoms (SANS):
Each component of SANS were analysed individually using paired t test (Table 2.2) and independent t test (Table 2.4).
Affective Flattening:
The experimental group showed significant reduction (mean-7.466, t-9.089) in the components of affective flattening. The control group showed slight difference in the post scores (mean-3.66, t-10.16).
At baseline there was a difference between experimental and control group in the component of affective flattening (mean-1.53, t-.886), but on post-test between the experimental and control group there is a significant difference (mean-5.33 t-3.20).
40
Alogia:
The experimental group showed significant reduction (mean-4.86, t-9.12) in the components of alogia. The control group showed slight difference in the post scores (mean-2.46, t-5.40).
At baseline there was a slight difference between experimental and control group in the component of alogia (mean-.866, t-.746), but on post-test between the experimental and control group there is a significant difference (mean-3.26 t-2.83). This reveals that there is marked reduction of alogia in the experimental group when
compared to the control group.
Avolition:
The experimental group showed significant reduction (mean-5.0, t-7.17) in the components of avolition. The control group showed slight difference in the post scores (mean-2.33, t-6.04).
At baseline there was a slight difference between experimental and control group in the component of avolition (mean-.33, t-.316), but on post-test between the experimental and control group there is a significant difference (mean-2.33 t-1.90). This reveals that there is marked reduction of avolition in the experimental group when compared to the control group.
Anhedonia:
The experimental group showed significant reduction (mean-2.80, t-5.50) in the components of anhedonia. The control group showed slight difference in the post scores (mean-1.66, t-6.64).
41
Attention:
The experimental group showed significant reduction (mean-3.33, t-5.35) in the components of attention. The control group showed slight difference in the post scores (mean-1.73, t-4.84).
At baseline there was a slight difference between experimental and control group in the component of attention (mean-.266, t-.288), but on post-test between the experimental and control group there is a significant difference (mean-1.86, t-2.08). This reveals that there is marked improvement of attention in the experimental group
when compared to the control group.
Results of analysis of Specific Level of Functioning Scale (SLOF):
Each components of SLOF were analysed individually. The scores of paired t test (Table3.2) and independent t test(Table3.4) are used for calculating the result.
Physical Functioning:
Analyses within the experimental group revealed that there was no difference in pre-test and post-test scores. This reveals that there is no change in all the components of physical functioning post intervention. Analyses within the control group revealed that there was no difference pre-test to test. The scores of post-test between the experimental and control also had no difference. This reveals that the participants in the experimental group had no change in post intervention.
Personal Care:
Analyses within the experimental group revealed that there was a significant difference in the components of personal care (mean-5.26, t-7.75) between pre-test and post-test scores. This reveals that there is marked improvement in all the components of personal care in post intervention.
Analyses within the control group revealed that there was slight difference (mean-2.66, t-5.39) from pre- to post-test.
42
reveals that the participants in the experimental group improved markedly in their personal care, post intervention.
Interpersonal Relationships:
Analyses within the experimental group revealed that there was a significant difference in the components of interpersonal relationships (mean-9.26, t-8.66) between pre-test and post-test scores. This reveals that there is marked improvement in all the components of personal care in post intervention.
Analyses within the control group revealed that there was significant difference (mean-4.80, t-8.17) from pre- to post-test.
On post-test between the experimental and control group there was a significant difference in the components of interpersonal relationships (mean-3.53, t-2.36). This reveals that the participants in the experimental group improved markedly in their interpersonal relationships, post intervention.
Social Acceptability:
Analyses within the experimental group revealed that there was a significant difference in the components of social acceptability (mean-3.66, t-7.89) between pre-test and post-pre-test scores. This reveals that there is improvement in all the components of social acceptability in post intervention.
Analyses within the control group revealed that there was significant difference (mean-1.40, t-2.21) from pre-test to post-test.
On post-test between the experimental and control group there was a similar difference in the components of social acceptability (mean-.266, t-.274). This reveals that the participants in the experimental group and control group had similar improvement in their social acceptability, post intervention.
Work Skills:
Analyses within the experimental group revealed that there was a significant difference in the components of work skills (mean-9.13, t-8.80) between pre-test and post-test scores. This reveals that there is marked improvement in all the components
43
Analyses within the control group revealed that there was significant difference (mean-3.26, t-4.53) from pre-test to post-test.
On post-test between the experimental and control group there was a similar difference in the components of work skills (mean-.4.80, t-2.65). This reveals that the participants in the experimental group had marked improvement in their work skills, post intervention.
Activities:
Analyses within the experimental group revealed that there was a significant difference in the components of activities (mean-7.60, t-8.35) between pre-test and post-test scores. This reveals that there is marked improvement in all the components of activities in post intervention. Analyses within the control group revealed that there was significant difference (mean-1.93, t-1.8) from pre-test to post-test.
On post-test between the experimental and control group there was a similar difference in the components of activities (mean-5.26, t-1.58). This reveals that the participants in the experimental group had marked improvement in their activities, post intervention.
Results of analysis of Adult Sensory Profile:
The experimental group revealed a significant difference in the component of low registration (mean-13.86, t-12.10), avoidance (mean-5.46, t-2.79) and sensory seeking (mean-3.80, t-2.10) from pre- to post-test. This reveals that there is marked improvement in the three components of ASP (Table 4.2). Whereas control group had more difference in sensation sensitivity (mean-2.86, t-4.11)
There was a significant difference in the components of low registration,
44
DISCUSSION
Sensory impairment as one of the first signs of “preference” of schizophrenia were not investigated because it was thought that sensory functions are not affected by the disorder or seen in patient testimonials relating to sensory or cognitive emotional interpretations. Sensory stimuli are filled in the environment, the process
by which each individual process these stimuli and respond to it appropriately is known as sensory integration (1). As King and others reported in their studies, schizophrenic patients have difficulty in processing these sensory stimuli, either they
don’t recognize these (Low Registration) or they over inhibit (sensory avoidance)
which results in symptoms, in this negative symptoms cause more problems in functioning and are resistant to treatment. SI on all components of SANS had a significant difference in the experimental group when compared with the control group. When broken into individual components, affective flattening and anhedonia had greater effect when compared to alogia, avolition and attention. Control group had effect on all the components of SANS but it was less when compared to experimental group. In SLOF the SI group showed more improvement interpersonal skill, activities and social acceptability and both the control and experimental group had no changes in physical functioning. ASP gave evidence to the previous studies by showing that schizophrenic patients had low registration and avoidance more when compared with sensory sensitivity and sensory seeking. Low registration showed marked improvement in the experimental group followed by avoidance and other components. Control group also showed improvement to a minimal level. This study
also adds evidence to King’s point and also proves that sensory integration is an
effective treatment for negative symptoms in schizophrenic patients and also that
45
CONCLUSION
46
LIMITATIONS AND RECOMMENDATIONS
LIMITATIONS
The study was conducted for a short duration of 8 weeks.
Smaller sample size.
No follow up programs were conducted to find the long term effects.
RECOMMENDATIONS
Larger sample size can be included.
Follow up programs can be conducted to find the long term effects of the
47
REFERENCES
1. Jadidi .J, and Mirshoja .M.S, The Impact of the Sensory Integration Approach on Positive and Negative Symptoms in a Patient With Non-Paranoid Schizophrenia: A case report. Middle East J Rehabil Health, 2016 April;3(2):e33275.
2. Levine .I, Helen O’Connor, Stacey .B, Sensory Integration with Chronic
Schizophrenics: a pilot study. CJOT – VOL. 44 – NO.1.
3. Patel .R, Jayatilleke .N, Broadbent .M, Negative Symptoms in Schizophrenia: a study in a large clinical sample of patients using a novel automated method. BMJ
Open 2015;5;e007619.
4. Rabinowitz .J, Negative Symptoms have greater impact on functioning than positive symptoms in schizophrenia: Analysis of CATIE data. Schizophrenia Research 137(2012) 147-150.
5. Brown .C, Sensory Processing in Schizophrenia: Missing and Avoiding Information. Schizophrenia Research 55 (2002) 187-195.
6. Beatrice .B, Hodiamont, Sensory processing, neurocognition, and social cognition in schizophrenia: Towards a cohesive cognitive model. Schizophrenia Research (Feb 2013).
7. Rocca .P, Montemagni .C, Negative symptoms and everyday functioning in schizophrenia: A cross-sectional study in a real world-setting. Psychiatry Research (April 2014).
8. Frith.C.D., The positive and negative symptoms of schizophrenia reflect impairments in the perception and initiation of action. Psychological Medicine, 1987, 17, 631-648.
9. Hoehn .T.P and Baumeister .A.A, Critique of the Application of Sensory
Integration Therapy to Children with Learning Disabilities. J Learn Disabil 1994 27:338.
10.Bijaeyeh1 .J.S.A, Givi .H.G, Sheykholeslami .H, Comparison of Sensory Processing and Semantic Differentiation in Peoples with Schizophrenia, Multiple
Sclerosis and Alzheimer’s Disease. International Journal of Clinical Medicine, 2017,8,257-264.
48
12.Mcilwain M.E., Harrison .J, Pharmacotherapy for treatment-resistant schizophrenia. Dove Press Journal (March 2011).
13.Millan M.J, Fone .K, Negative symptoms of schizophrenia: Clinical characteristics, pathophysiological substrates, experimental models and prospects for improved treatment. European Neuropsychopharmacology (2014) 24,645-692.
14.Schaaf .R.C, Miller .L.J., Occupational Therapy Using a Sensory Integrative Approach for Children with Developmental Disabilities. Mental Retardation and
Developmental Disabilities Research Reviews 11:143-148 (2005).
15.Olson .L, Sensory Modulation Disorder and Schizophrenia: Linking Behavioral Measures. 2011.
16.Hegde .S, Shobini L. Rao, Addition of home-based cognitive retraining to treatment as usual in first: Episode schizophrenia patients: A randomized controlled study. Indian Journal of psychiatry (2012).
17.Yeger B.E., Levi .D.P and Wiesel .R.L., The Sensory Profile of People with Post- Traumatic Stress Symptoms. Occupational Therapy Journal in Mental Health (Aug 2013).
18.Mucci .A, Rucci .P, The Specific Level of Functioning Scale: Construct validity, internal consistency and factor structure in a large Italian sample of people with schizophrenia living in the community. Schizophrenia Research 159 (2014).
19.Crow .T.J, Brain changes and negative symptoms in schizophrenia.
Psychopatholgy 1995;28:18-21.
20.Cermak S.A, Sensory Integration with Adult: Application and Misapplication. The Israel Journal of Occupational Therapy (June 2016).
21.Hegde .S, A review of Indian research on cognitive remediation for schizophrenia.
Asian Journal of Psychiatry 25(2017).
22.Dennis P. Saccuzzo, David L. Braff, Early Information Processing Deficit in Schizophrenia. Arch Gen Psychiatry 38:175-179, 1981.
23.Judith E. Reisman and Anne B. Blakeney, Exploring Sensory Integrative
Treatment in Chronic Schizophrenia. Journal of Occupational therapy in Mental Health (Oct 2008).
24.Degnen .L.T., Perspectives on the status of Sensory Integration Therapy.
American Journal of Occupational Therapy (July 1988).
49
26.Brocklehurst .J., the use of Tactile and Vestibular Stimulation to Reduce Stereotypic Behaviours in Two Adults with Mental Retardation. AJOT (June 1990).
27.Cermak .S, Sensory Integration with the Adult: Application and Misapplication.
Israel Journal of Occupational Therapy (Aug 1992).
28.Oltmanns .T.F, Robert E, Emery, Abnormal Psychology, 7th edition.
SANS: Scale for the Assessment of Negative Symptoms INFOTECH Soft, Inc.
Identification
First Name Middle Name Last Name
John James Doe
Patient ID Date of Birth Gender Age Initials
123456789 3/23/1980 male 26 JJD
Interview Date
Scale for the Assessment of Negative Symptoms
SANS CODES
0 = None/Not at all 2 = Mild 4 = Marked 9 = Unknown/Cannot be 1 = Questionable 3 = Moderate 5 = Severe assessed/Not assessed
AFFECTIVE FLATTENING OR BLUNTING
1. Unchanging Facial Expression None ---> Severe Unk
0 1 2 3 4 5 9 The patient's face appears wooden-changes less than expected as emotional content of discourse
changes.
2. Decreased Spontaneous Movements
0 1 2 3 4 5 9 The patient shows few or no spontaneous movements, does not shift position, move extremities, etc.
3. Paucity of Expressive Gestures
0 1 2 3 4 5 9 The patient does not use hand gestures or body position as an aid in expressing his ideas.
4. Poor Eye Contact <