1
How models can support
ecosystem-1
based management of coral reefs
2
Weijerman, Mariskaa,b, Elizabeth A Fultonc, Annette B.G. Janssend, Jan J. Kuiperd, Rik 3
Leemansb, Barbara J. Robsone, Ingrid A. van de Leemputf, Wolf M. Mooijd,f 4
aJoint Institute for Marine and Atmospheric Research, University of Hawaii at Manoa, Honolulu, 5
Hawaii 96822, bEnvironmental System Analysis Group, Wageningen University, PO Box 47, 6
6700 AA Wageningen, the Netherlands. [email protected], +1 808 725-5468 7
(corresponding author) 8
cDivision of Marine Research, Commonwealth Scientific and Industrial Research Organisation 9
(CSIRO), Hobart, Tasmania, Australia 10
dDepartment of Aquatic Ecology, Netherlands Institute of Ecology (NIOO-KNAW), PO Box 50, 11
6700 AB Wageningen, the Netherlands 12
eDivision of Land and Water, Commonwealth Scientific and Industrial Research Organisation 13
(CSIRO), Black Mountain, Australia 14
fAquatic Ecology and Water Quality Management Group, Department of Environmental 15
Sciences, Wageningen University, PO Box 47, 6700 AA, Wageningen, the Netherlands 16
Abstract
17
Despite the importance of coral reef ecosystems to the social and economic welfare of coastal 18
communities, the condition of these marine ecosystems have generally degraded over the past 19
decades. With an increased knowledge of coral reef ecosystem processes and a rise in 20
computer power, dynamic models are useful tools in assessing the synergistic effects of local 21
and global stressors on ecosystem functions. We review representative approaches to model 22
coral reef ecosystems and categorize these in minimal, intermediate and complex model 23
applications. The categorization was based on the leading principle for model development 24
and their level of realism and process details. This review aims to improve the knowledge of 25
concurrent approaches in coral reef ecosystem modeling and highlights the importance of 26
choosing an appropriate approach based on the type of question to be answered. We contend 27
that minimal and intermediate models are generally valuable tools to get insight into the 28
response of key states to main stressors and, hence, contribute to understanding ecological 29
surprises. We argue that adaptive resource management requires integrated thinking and 30
2
achieved through complimentary use of models or through integrated models that combine 1
many aspects of the system in one framework. In terms of the later, whole-of-system models 2
can be useful tools for quantitative scenario evaluation. These models allow for a 3
multidimensional view of the interactive effect of multiple stressors on various and 4
potentially conflicting management objectives. All models are simplifications of reality and 5
as such have their weaknesses. While minimal models lack multidimensionality, system 6
models may be difficult to interpret as they require many efforts to decipher the numerous 7
interactions and feedback loops that link input and output. Given the breadth of questions that 8
must be tackled when dealing with coral reefs the best practice approach uses multiple model 9
types and thus benefits from the strength of different model approaches in a given study. 10
11
1.
Introduction
12 13
Coral reefs are extremely important as habitats for a range of marine species, natural buffers 14
to severe wave actions, and sites for recreation and cultural practices. Additionally, they 15
contribute to the national economy of countries with coral reef ecosystems. The economic 16
annual net benefit of the world’s coral reefs are estimated at US $29.8 billion from fisheries, 17
tourism, coastal protection and biodiversity (Cesar et al. 2003). Moreover, coral reefs are 18
important to the social and economic welfare of tropical coastal communities adjacent to 19
reefs (Moberg and Folke 1999). Coral-reef related tourism and recreation account for $9.6 20
billion globally and have also shown to be important contributors to the economy of Pacific 21
islands (Cesar et al. 2003, Van Beukering et al. 2007). However, the functioning of coral reef 22
ecosystems and their biodiversity is deteriorating around the world (Hoegh-Guldberg et al. 23
2007). In recent reviews on the extinction risks of corals, the most important global threats to 24
the survival of corals and coral reefs were human-induced ocean warming and ocean 25
acidification (Brainard et al. 2011, Burke et al. 2011). While local governments are limited in 26
their capacity to reduce greenhouse gas emissions worldwide and so reduce the on-going 27
ocean warming and acidification, they can play a pivotal role in enhancing the corals’ 28
capability to recover from impacts of these global threats by reducing additional local 29
stressors caused by land-based sources of pollution and fishing (Carilli et al. 2009, Hughes et 30
al. 2010, Kennedy et al. 2013, McClanahan et al 2014). 31
The capacity of coral reef organisms and natural systems to ‘bounce back’ from 32
3
physiological stress, and general environmental deterioration (Nyström et al. 2000) and 1
through the reduction of large and diverse herbivorous fish populations (Bellwood et al. 2
2006, Pandolfi et al. 2003). These local stressors affect the coral-macroalgal dynamics and 3
early life history development and survival of corals (Baskett et al. 2009, Gilmour et al. 2013) 4
but these stressors can be mitigated by proper management (Graham et al. 2013, Micheli et 5
al. 2012, Mumby et al. 2007b). Ecosystem models can help managers in system 6
understanding and in visualizing projections of realistic future scenarios to enable decision 7
making (Evans et al. 2013). 8
Large-scale regime or phase-shifts have been identified in pelagic systems (Hare and 9
Mantua 2000, Weijerman et al. 2005) and on coral reefs (Hughes 1994) and have influenced 10
a new understanding in ecosystem dynamics that includes multiple-equilibriums, 11
nonlinearity, and threshold effects (e.g., Nyström et al. 2000, Mumby et al 2007a). As has 12
been shown in the management of freshwater resources, insight in the conceptual relations 13
between key states and their response to stressors can have profound impacts on the way 14
natural resource managers think about their systems and the options they have for ecosystem 15
recovery (Carpenter et al. 1999). The theory of alternative stable states implies, for example, 16
that a stressed reef could not only fail to recover after a disturbance, but could shift into a 17
new alternative stable state (e.g., algal-dominated state) due to destabilizing feedbacks, such 18
as a change in abiotic or biotic conditions (Mumby et al. 2006, 2013). As a result, reversing 19
undesirable states has become difficult for managers (Nyström et al. 2012, Hughes et al 20
2013), even when stressors are being lowered (also called hysteresis (Scheffer et al. 2001)). 21
The complexity of coral reef ecosystems with their myriad of processes acting across 22
a broad range of spatial (e.g., larval connectivity versus benthic community interactions) and 23
temporal (e.g., turnover time of microbes versus maturity of sea turtles) scales makes 24
modeling coral reef ecosystems for predictive assessments very challenging. The modeler’s 25
dilemma is to choose an approach that meets the requirements for simplicity, realism and 26
accuracy, and reaches the overlapping but not identical goals of understanding natural 27
systems and projecting their responses to change (Levins 1966). 28
Leading principles for ecosystem model development vary and include: 29
1) To interpolate and fill data gaps, for instance to provide information regarding 30
what is happening between two observations in time or to fill in the three-31
dimensional picture of a system from two-dimensional data; 32
2) To forecast or hindcast, i.e., to make predictions for operational management 33
4
3) To evaluate scenarios for operational management; 1
4) To enhance systems understanding by quantification of a conceptual model (e.g., 2
to calculate materials budgets) or to quantitatively test the plausibility of that 3
conceptual model; 4
5) To develop ecological theory and generalizable ecological hypotheses; 5
6) Extrapolation and projection, i.e., to generate hypotheses regarding the function 6
and likely responses of a particular system when perturbed beyond its previously 7
observed state. 8
9
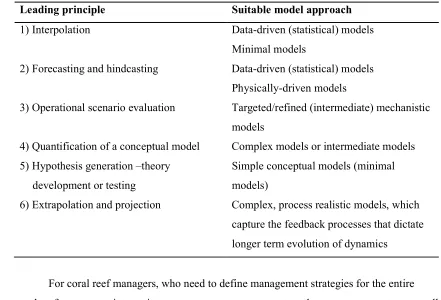
With regards to the identified leading principles, we believe that each circumstance is 10
best suited by a different model approach (Table 1). Other authors who have considered the 11
question of selecting an appropriate modelling approach to suit a particular purpose include 12
Kelly et al. (2013), Fulton and Link (2014) and Robson (2014a). Robson (2014b) has further 13
considered the implications of growing complexity in models of aquatic ecosystems. 14
[image:4.612.79.520.391.691.2]15
Table 1. Leading principles for model development with a model approach suitable to reach the 16
desired goal. 17
Leading principle Suitable model approach
1) Interpolation Data-driven (statistical) models Minimal models
2) Forecasting and hindcasting Data-driven (statistical) models Physically-driven models
3) Operational scenario evaluation Targeted/refined (intermediate) mechanistic models
4) Quantification of a conceptual model Complex models or intermediate models 5) Hypothesis generation –theory
development or testing
Simple conceptual models (minimal models)
6) Extrapolation and projection Complex, process realistic models, which capture the feedback processes that dictate longer term evolution of dynamics
18
For coral reef managers, who need to define management strategies for the entire 19
coral reef ecosystem, interactions among system components and management sectors as well 20
5
Kroeker et al 2013, Rosenberg and McLeod 2005). Ecosystem understanding should include 1
the human component in terms of their social and economic dependencies on these marine 2
resources (Nyström et al. 2012, Plagányi et al. 2013, Lui 2001). Management scenarios that 3
enhance the biological state might be unfavorable for the local economy, especially on short 4
time scales. Responses of slow-reacting systems, such as coral reefs, could diminish 5
community support for effective management. Still, they also give managers an opportunity 6
to act before a new, less favorable, condition has established itself (Hughes et al. 2013). To 7
date, few tools have been available that evaluate the socio-economic and socio-ecological 8
tradeoffs of management scenarios of an ecosystem-based approach to coral reef 9
management. Coral reef ecosystem models that do include the human component are mostly 10
focused on fisheries management with socio-economic impacts presented as changes in 11
catches or landings (Gibble 2003, McClanahan 1995, Tsehaye and Nagelkerke 2008). Few 12
models dynamically couple ecological dynamics to socio-economic drivers and these models 13
also focus on fisheries management (Kramer 2007, Melbourne-Thomas et al. 2011, Schafer 14
2007). 15
The modeling approach most suitable to reach specific goals for ecosystem-based 16
management depends on the type of governance (e.g., existing laws and enforcement), time 17
and space scales under consideration and data availability (e.g., data quantity, quality and 18
accessibility; Tallis et al. 2010) as well as the maturity of scientific understanding of the 19
system under consideration and the time and resources available for model refinement and 20
validation (Kelley et al. 2013). The concepts encompassed by Management Strategy 21
Evaluation (MSE) or Decision Support System (DSS) tools are a useful way of exploring 22
management issues that can be applied to many model types. MSE involves simulation 23
testing of the implications for both the resource and the stakeholders of alternative 24
combinations of monitoring data, analytical procedures and decision rules, and can be used 25
for evaluating the tradeoffs between socioeconomic and biological objectives (Smith et al. 26
2007). In situations when neither data nor time is a limiting factor for model development and 27
one aims to simulate site-specific management scenarios, ‘end-to-end’ or ‘whole-of-system’ 28
models can be developed for the MSE. In more data-poor or time-limited situations or when 29
one aims to simulate less-specific scenarios with processes that are easily traced back, 30
‘minimum realistic’ models can be used as a basis of the MSE (e.g., Plagányi et al 2013). 31
Alternatively simple, even qualitative, models can be used to shed light on ecological (or 32
6
effective management strategies (Tallis et al. 2010) or these simpler models can be used as 1
the logical basis of the MSE in their own right, as per Smith et al (2004). 2
Drawing in all models of reef systems would be intractable, especially given the 3
number of conceptual models that exist in the mainstream and grey literature. Consequently, 4
here we review the strengths and limitations of ‘dynamic’ coral reef ecosystem modeling 5
approaches in their application to management scenario analyses. We define a ‘dynamic’ 6
model of a given system as a set of mathematical formulations of the underlying processes in 7
time and/or space with outputs for each time step over a specified period. With such a model, 8
the development of the system in time and space can be simulated by means of numerical 9
integration of the process formulations. We put particular emphasis on their usefulness to 10
evaluate the ecological implications of model applications for MSE. This review is not an 11
exhaustive comparison of all dynamic coral reef ecosystem models but we have selected 12
studies that employ oft-used or exemplar approaches that represent model types categorized 13
as ‘minimal’, ‘intermediate’, and ‘complex’ models. These classifications were based on a 14
scoring system that combined (1) their level of realism (determined by the conceptualism of 15
space, time and structure) and (2) the process details incorporated into the model (Table 2). 16
Additionally, we looked at the leading principle for development of each model (Mooij et al 17
2010). We contend that the leading principle of minimal dynamic models is understanding 18
the type and shape of the response curve of ecosystems to disturbances. The leading principle 19
of complex dynamic models is to predict the response of ecosystems to disturbances under 20
different management regimes given the many feedbacks in the system. Intermediate 21
dynamic models try to balance between these two objectives. They do so by expanding parts 22
of the system to the full detail while deliberately keeping other components simple. In this 23
way they can capture some key feedbacks while maintaining the tractability of simple 24
models, meaning they can make use of analytical and formal fitting procedures (Plagányi et 25
al. 2014). We highlight the differences between the model approaches, discuss their main 26
goals, and outline the approach to take the strength of the different modeling types to obtain 27
clarity and predictive capabilities in a model. 28
29
2.
Categorization of Three Coral Reef Model Types: Minimal,
30
Intermediate, and Complex
7
The rationale for any model is the desire to capture the essence and to remove or reduce the 1
redundant aspectsof the system under study. What is essential and what is redundant and, 2
thereby, what level of reduction is required, to a large degree depends on the questions being 3
asked, the available information to base conceptualizations on and the way in which 4
abstractions are formulated. The result is a ‘model’ that is realistic to varying degrees. It is 5
not a clear cut recipe book approach as modelers need to make a tradeoff between the levels 6
of resolution of time, space, taxonomy and model structure, as well as model detail, i.e., 7
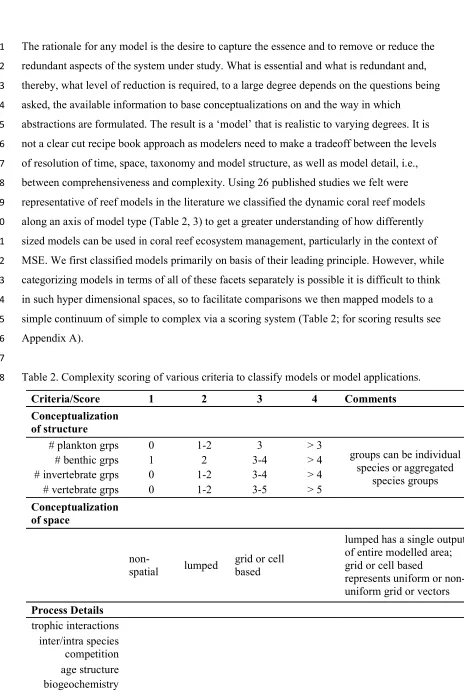
between comprehensiveness and complexity. Using 26 published studies we felt were 8
representative of reef models in the literature we classified the dynamic coral reef models 9
along an axis of model type (Table 2, 3) to get a greater understanding of how differently 10
sized models can be used in coral reef ecosystem management, particularly in the context of 11
MSE. We first classified models primarily on basis of their leading principle. However, while 12
categorizing models in terms of all of these facets separately is possible it is difficult to think 13
in such hyper dimensional spaces, so to facilitate comparisons we then mapped models to a 14
simple continuum of simple to complex via a scoring system (Table 2; for scoring results see 15
Appendix A). 16
[image:7.612.72.536.28.720.2]17
Table 2. Complexity scoring of various criteria to classify models or model applications. 18
Criteria/Score 1 2 3 4 Comments Conceptualization
of structure
# plankton grps 0 1-2 3 > 3
groups can be individual species or aggregated
species groups
# benthic grps 1 2 3-4 > 4
# invertebrate grps 0 1-2 3-4 > 4 # vertebrate grps 0 1-2 3-5 > 5
Conceptualization of space
non-spatial lumped
grid or cell based
lumped has a single output of entire modelled area; grid or cell based
represents uniform or non-uniform grid or vectors
Process Details
8 hydrodynamics
1
2.1 Minimal models
2With few mathematical equations, minimal dynamic models are often used as a 3
toolkit for the development of ecological theory. Minimal models have proven to be a helpful 4
tool in gaining fundamental insight into the complex dynamics of a specific system (i.e., 5
chaos, cycles, regime shifts, etc.). In coral reefs, for example, they have played an important 6
role in conceptualizing and understanding observed regime shifts (Hughes 1994, Mumby et 7
al. 2013). Generally, people do not intuitively consider nonlinear responses, i.e., we often 8
assume that a small change in environmental conditions will lead to a small (or at least 9
consistently proportional) change in the ecosystem. Minimal models have been used to show 10
what kind of surprises could arise when nonlinear interactions between system variables (e.g. 11
feedback mechanisms) are taken into consideration (#1 in Table 3). Using minimal models to 12
simulate coral reef dynamics, one can thus gain fundamental insight into thresholds (#1), 13
primary drivers of system dynamics (#2 and #3), the type of system response to changing 14
conditions, and the effect of hysteresis (#4 and Mumby et al. 2013) Recently, the interaction 15
between ocean acidification and warming, and coral growth/cover has been examined with 16
minimal models (#5). Some minimal models also incorporate local environmental changes 17
(e.g., nutrient input, hurricanes, and fishing) to study coral cover response and are able to 18
forewarn whether current levels are precautionary or whether new challenges are coming 19
(#6). Early minimal models examined the main drivers of reef accretion and erosion 20
processes (#7–9). Gaining insight in these important aspects of a system’s response to current 21
or future perturbations can help managers to understand observed surprising dynamics, focus 22
on the most relevant (sensitive) variables, and to conservatively move away from tipping-23
point thresholds by increasing reef resilience. While there is currently no published MSE 24
using a simple reef model as a basis (to the author’s knowledge), the response curves derived 25
from such models could be used as the basis of a qualitative MSE of the form undertaken in a 26
temperate system by Smith et al (2004). 27
One advantage of minimal models is that one is able to thoroughly explore the 28
behavior of the model in a multidimensional parameter space by using analytical or 29
numerical methods. This way, one can easily trace back the relative importance of specific 30
processes or interactions. However, minimal models ignore other potentially important 31
9
assume spatial homogenous conditions and constant environments. Reefs have patchy 1
distributions of corals and fish, often determined by environmental factors (Franklin et al. 2
2013), so including spatial dimensions explicitly in the model can greatly improve the realism 3
of reef dynamics. However, explicit spatial representation is not automatically required, so 4
long as careful thought is given to how to implicitly represent the spatial influences. Because 5
minimal models lack the link between all trophic groups and the response of multiple 6
stressors, they can be less suitable in a multispecies or multidisciplinary decision-making 7
context. Minimal models have paved the way for the theory on generic early warning signals 8
of tipping points (Scheffer et al. 2009). While minimal models themselves are likely to be too 9
simplistic to precisely predict future behavior in systems that are not already well understood, 10
generic early warning signals may be an important additional tool for ecosystem managers. 11
Based on the leading principle defined for minimal models, 10 models could be 12
classified as minimal models developed to enhance understanding of the type and shape of 13
the response curve of ecosystems to disturbances (#1–9). According to our scoring system, 14
the overall complexity score based on the mean score of model structure, representation of 15
space, and process details varied between 2.3 and 4.4 with a mean score of 3.3 (Appendix A). 16
The box model (#7, 8) had an overall score of 4.4 and could therefore also be placed in the 17
intermediate category, whose overall score was between 3.0 and 5.0 with a mean of 4.1. 18
19
2.2 Intermediate models
20Intermediate models are more focused than typical whole-of-system models; they try to 21
marry the strengths of simple models (in terms of tractability) with a broader system 22
perspective to selectively link the key drivers of the system. These models simulate species-23
specific behavior and age or size structure with a set of mathematical formulas, capturing the 24
population dynamics of key functional groups, and potentially their spatial heterogeneity if 25
spatially explicit (Plagányi 2007). These kinds of models typically include at least one key 26
ecological process (e.g., a link to lower trophic levels, interspecific interactions or habitat 27
use) and potentially some representation of how the modelled components are affected by 28
physical and anthropogenic drivers (Plagányi et al. 2014). 29
The leading principal for this type of model was defined as trying to find a balance 30
between system understanding and predictive capabilities by expanding parts of the system to 31
the full detail while deliberately keeping other components simple. For example, by including 32
10
understanding was reached into the population dynamics and perturbations (fishery [#15] or 1
environmental factors [#18]) of that specific group. This more realistic and heterogeneous 2
system representation provides information about a system that is not available from a 3
minimal model. In pointing to a representative example of an intermediate complexity reef 4
model there are a number of potential candidates. Two clear classes of questions have been 5
tackled with these kinds of models. The first is around using multispecies or trophic models 6
to explore the coral reef ecosystem impacts of fishing (Table 3, #10–16, 19) and the second 7
uses models, often individual or agent-based models (Grimm et al. 2006), to consider how 8
competing habitat defining groups respond to changing conditions (#17, 18, 20, 21). 9
The Ecopath and Ecosim (EwE) modeling platforms (Polovina 1984, Walters et al. 10
1997, Pauly et al 2000) is one of the most commonly used models for exploring trophic 11
connections and responses to fishing pressure. Although the suite of EwE models can be 12
considered complex based on our criteria (Table 2), the application of EwE models in the 13
selected studies has been mostly to look at just one disturbance (fisheries) through expansion 14
of that part of the model components while leaving the rest simple (e.g., few functional 15
groups, no inclusion of Ecospace or life cycle (age structured) processes) and, hence, the 16
leading principle fits with our classification of ‘intermediate’. Similarly while some agent-17
based models can be considered complex in terms of the elaboration of particular ecological 18
mechanisms, in the context of their use in coral reef systems they have often been used as 19
intermediate complexity models. When EwE is used to explore reef dynamics it can give 20
insight into a system’s ‘state’ based on changes in energy flows as a response to perturbation 21
(#10, 12 and 13), and multiple positive or negative feedback loops can be included with this 22
model approach (#17, 21 and 22). The classification of EwE models also illustrates that 23
modelling platforms often do not simply slot into one or other category but can be simple, 24
intermediate or complex depending on the details of a particular application. For example, 25
one application of EwE, for examining fishery scenarios for Indonesian reef systems, 26
included 98 tropic groups and 3 of the 5 selected process dynamics (# 14) and was used for 27
evaluating management scenarios. Thus it was categorized as complex (Table 3) as its overall 28
complexity score of 6.0 sits within the span of scores (5.3 to 6.8, mean 5.9; Appendix A) of 29
complex models. 30
A disadvantage of intermediate models is that the software code often consists of 31
linked models, which complicates the interpretation of results (Lorek and Sonnenschein 32
1999). Additionally, because of the need for more parameters, variables and model 33
11
(Pascual et al. 1997) and validation and sensitivity analyses are more cumbersome (Rykiel Jr 1
1996). Nevertheless these models are still simple enough that good use can be made of formal 2
statistical estimation procedures originally developed for simpler models (Plagányi et al 3
2014). 4
Management applications of intermediate models include the ability to inform 5
managers where a system is on a gradient from ‘pristine’ to degraded/disturbed so that 6
effective action can be identified and implemented (Kramer 2007, McClanahan 1995). 7
Additionally, especially with respect to the suit of EwE models that have been used for 8
fishery management strategy evaluation, this model approach gives valuable insight in 9
ecosystem impacts of alternative fishery scenarios. However, spatial factors, nutrient 10
dynamics, benthic processes and extrinsic forcing functions are not always included in 11
intermediate models but can be important for projecting the effects of some perturbations on 12
ecosystems (Robinson and Frid 2003). 13
14
2.3 Complex models
15What we categorized as complex models are often called end-to-end models or whole-of-16
system models. These models typically include a food web spanning set of trophic groups: 17
detritus, primary producers, zooplankton ranging from small (µm) to large (m) animals, 18
forage fish, invertebrates and apex predators, including humans. They also often explicitly 19
simulate biogeochemical dynamics. For coral reefs that are surrounded by oligotrophic water, 20
nutrients play a key role in ecosystem dynamics. Including biogeochemical processes in a 21
coral reef ecosystem model is, therefore, essential to simulate these processes, especially 22
since land-based sources of pollution have played an important role in the demise of many 23
reef systems in the Caribbean (Lapointe 1997) and on the Great Barrier Reef (De’ath et al. 24
2012). In comparison with the other two model types, additional key ecosystem processes 25
(e.g., trophodynamics and feedback loops) are represented to more comprehensively simulate 26
a system’s behavior. These complex models aim to provide quantitative projections of system 27
changes in response to a set of changing abiotic and biotic conditions taking into account key 28
components and their spatial heterogeneity (in some cases from microbes to whales and 29
humans, and from sediment bioturbation to physical oceanography). Simplicity is sacrificed 30
as these models are simultaneously complex in many dimensions (process details, number of 31
functional groups, nutrients, spatial and temporal dimensions, see Table 3 #23–26). That is 32
12
lead to useful outcomes; tradeoffs between the dimensions are nearly always required so as 1
the scope, or the number of scales extends sacrifices are likely required in other facets (such 2
as using growth terms rather than very finely resolved physiological representations of each 3
ecological process for each modelled group). 4
Representing a system in this way can be advantageous for capturing trophic cascades 5
and synergistic effects of perturbations, as the model implementation explicit includes (1) key 6
functional groups at each trophic level (Mitra and Davis 2010) and (2) model complexity 7
varies with details where needed in terms of number of functional groups and compatibility 8
between lower and upper trophic level formulations (Fulton et al. 2005). These models can 9
represent the myriad of nonlinear, two-way interactions that simple or intermediate models 10
do not represent. Humans are an integral component of most complex models, both as users 11
of ecosystem services and as drivers influencing ecosystem processes (Levin et al. 2009). 12
The major drawback of these model types is similar to that of intermediate models: 13
the addition of complexity does not guarantee an improvement in the simulated output as 14
uncertainty and error associated with the added components will be introduced to the model 15
and can potentially degrade its performance. Uncertainty arises both from assumptions made 16
in the model structure and from uncertainty around the values of parameters, amongst other 17
sources (Draper 1995, Renard et al. 2010). 18
The difficulties of properly understanding the implementation of ecological and socio-19
economic processes in a complex model hamper straightforward validation and could lead to 20
less reliable projections. To improve the performance of complex ecosystem models, studies 21
have looked into the effects of trophic aggregations (Fulton 2001, Gardner et al. 1982), model 22
structure (Sebastián and McClanahan 2013), physiological detail (Fulton et al. 2004, Allen 23
and Pollimene, 2011), spatial representation (Fulton et al. 2004), and predator-prey 24
relationships including age-structure (Botsford et al. 2011) and inter-predator competition 25
(Walters and Christensen 2007). Best practice guidelines for developing complex models 26
have been formulated (Fulton et al. 2004, Flynn 2005, FAO 2007, Travers et al. 2007). Some 27
of these recommendations are (1) the inclusion of functional groups at low trophic levels and 28
species of higher trophic levels with an appropriate spatial dimension to represent organism 29
dynamics more accurately; (2) inclusion of abiotic processes to simulate important drivers in 30
structuring ecosystem communities; (3) the integration of physical and biological processes at 31
different scales (relevant to the scales of key processes) to more realistically simulate those 32
dynamics; (4) evaluating the model in terms of its ability to reproduce expected patterns from 33
13
understanding of the system; and (5) two-way interactions between ecosystem components to 1
allow dynamic feedback and nonlinear dynamics to emerge. 2
Most complex coral reef models are developed to assess the synergistic effects of 3
climate change and fishing on ecosystem dynamics (#25 and 26) and the resilience of coral 4
reefs under simulated management scenarios (model #23 and 24). Through the inclusion of 5
the breadth of the food web and many alternative interaction pathways, non-intuitive (and, 6
therefore, unanticipated) outcomes in community structure can present themselves. It should 7
be noted that unexpected, chaotic and non-linear system dynamics can be exhibited by simple 8
models, again simply including more components does not guarantee revelations outside the 9
purview of other approaches. Not only the number of groups represented, but also the number 10
and types of interactions between them is important (Baird, 2010, Takimoto et al., 2012). The 11
important consideration is the inclusion of mechanisms of achieving alternative outcomes – 12
multiple reaction pathways that can reach alternative stable states. The same logic is behind 13
why the inclusion of humans and their activities in model simulations facilitates further 14
evaluation of tradeoffs between ecosystem services and management goals. This information 15
can then support the identification of policies and methods that have the potential to meet a
16
priori stated objectives (Levin et al. 2009). 17
Table 3. Selected dynamic coral reef ecosystem models and model applications categorized 18
as minimal, intermediate, and complex based on their system conceptualization and process 19
detail (Table 2). BBN is Bayesian belief network. EwE is Ecopath with Ecosim.ODE is 20
ordinary differential equation. CORSET isCoral Reef Scenario Evaluation Tool. CAFFEE is 21
Coral-Algae-Fish-Fisheries Ecosystem Energetics. For overall complexity score calculations, 22
see Appendix A. 23
# Model Source Reef area Leading principal Suitable for MSE
Category based on leading principal
Overall Score
1 Caribbean reef model
Mumby et al. 2007a
Caribbean fore-reef
System
understanding of coral-algae dynamics
Insight in benthic dynamics
Minimal 2.3
2 BBN model Renken and Mumby 2009
Caribbean fore reef
System
understanding of macroalgal dynamics
Insight in benthic dynamics
Minimal 3.3
3 HOME model
Wolanski et al. 2003
Great Barrier Reef & Guam
System
understanding of coral-algal dynamics
Insight in benthic dynamics
14
# Model Source Reef area Leading principal Suitable for MSE
Category based on leading principal Overall Score
4 Community model Żychaluk et al. 2012 Kenya, Caribbean, Great Barrier Reef System understanding of occurrence of alternative ecosystem states
Insight in benthic dynamics
Minimal 2.8
5 Community model
Anthony et al. 2011
Caribbean System understanding in benthic dynamics under climate change
Insight in benthic dynamics
Minimal 3.4
6
Determinis-tic model Blackwood et al. 2011 Caribbean System understanding of coral-algal dynamics including reef complexity
Insight in reef resilience in relation to fishery
Minimal 2.9
7 Box model Eakin 1996 25,308 m2Uva
Island, Panama System understanding of reef accretion/ erosion processes
Insight in reef
complexity Minimal 4.4
8 Box model Eakin 2001 25,308 m2 Uva
Island, Panama System understanding of reef accretion/ erosion processes
Insight in reef
complexity Minimal 4.4
9 ReefHab Kleypas
1997 Generic reef (parameter-rized for Mesobarrier reef Caribbean) System understanding of reef accretion/erosion processes Insight in environmental factors limiting reef habitat
Minimal 2.6
10 Energy-based model McClanaha n 1995 Generic local reef (parameter-ized for Kenyan reef)
System
understanding of effect of fishing on ecosystem structure and fishery yield
Insight in trade-offs of alternative fishery scenarios Minimal/ Intermediate 5.0
11 EwE model Tsehaye and Nagelkerke 2008
6000 km2 Red
Sea Fisheries effects on ecosystem - change in fishery scenarios
Insight in ecosystem impacts of alternative fishery scenarios
Intermediate 4.1
12 EwE model Weijerman et al. 2013
Hawaii Identify indicators for fishery for management - change in fishing intensity
Insight in ecosystem impacts of increased fishing
Intermediate 4.5
13 EwE model Arias-González et al. 2004
Mexico Fisheries effects on ecosystem - change in fishery scenarios
Insight in ecosystem impacts of alternative fishery scenarios
Intermediate 3.9
14 EwE model Ainsworth
et al. 2008 Indonesia Fisheries effects on ecosystem - change in fishery scenarios
Insight in ecosystem impacts of alternative fishery scenarios)
15
# Model Source Reef area Leading principal Suitable for MSE
Category based on leading principal Overall Score
15 ELFSim Little et al. 2007
Great Barrier Reef
Understanding of population dynamics of single species under alternative fishery scenarios
Evaluate trade-offs on population dynamics of 1 species under alternative fishery scenarios
Intermediate 3.0
16 Individual-based model Edwards et al. 2011 Caribbean mid-depth fore-reef System understanding of disturbance impacts under alternative fishery scenarios Insight in resilience of benthic community from disturbances under different fishery scenarios
Intermediate 4.6
17 Individual-based model
Wakeford et al. 2007
32 m2 Lizard
Island, Great Barrier Reef System understanding (coral community dynamics after perturbations) and projected trajectory under future disturbances
Insight in reef resilience in relation to disturbances
Intermediate 3.8
18 SPREAD (individual-based)
Yñiguez et
al. 2008 Florida, 3-D cells of 1x1 cm System understanding (macroalgal growth and morphology) Insight in environmental factors influencing macroalgal dynamics
Intermediate 4.4
19 Lotka-Volterra model ~ adaptive behavior model Kramer 2007 Generic Caribbean reef Understanding in coupling between biological and fishery dynamics
Effects of fishery on ecosystem state and vice versa
Intermediate 5.0
20 Cellular automaton model Langmead and Sheppard 2004
Caribbean System
understanding (coral community restructuring processes after disturbance)
Insight in reef resilience in relation to disturbances
Intermediate 4.1
21 Biogeochem ical ~ hydrodynam ic model
Faure et al.
2010 2066 km
2 lagoon, New Caledonia System understanding (ecosystem variability under environmental disturbances) Insight in biogeochemical response under different scenarios
Intermediate 3.4
22 ODE-based
model Riegl and Purkis 2009 Generic (parameterized for Arabian/Persian Gulf) System understanding of coral community structure and recovery after multiple bleaching events)
Insight in coral community structure after repeated disturbances
16
# Model Source Reef area Leading principal Suitable for MSE
Category based on leading principal Overall Score
23 CORSET (based on Fung 2009)
Melbourne -Thomas et al. 2011
1342 km2 (5-20
m depth) Generic reef
Decision support tool with simulations based on 'what if' scenarios
Projecting reef futures under different scenarios
Complex 6.8
24 ODE-based
model Fung 2009 Generic local reef System understanding (key ecological processes responsible for reef degradation) and scenario testing Projecting reef futures under different scenarios
Complex 5.3
25 Integrated agent-based model (based on Fung 2009) Gao and Hailu 2011
~6000 km2,
Ningaloo Marine Park, Australia
Decision support tool with simulations based on 'what if' scenarios
Site closure strategy analyses
Complex 5.4
26 CAFFEE Sebastián and McClanaha n 2013
Kenya Model structure understanding, calibration methods
Insight in reef resilience in relation to fishery closure and environmental disturbance
Complex 6.1
27 eReefs Schiller et al., 2013; Wild-Allen et al., 2013; Mongin & Baird, 2014
300000 km2,
Great Barrier Reef, Australia
Support tool for both rapid response and slow response management and system understanding Projecting reef futures under different land management scenarios
Complex 6.8
1
Although there is a continuous scale from minimal to complex model approaches, we 2
differentiated between three categories (minimal, intermediate or complex) based on the 3
leading principal for model development and on their overall complexity score related to the 4
model conceptualism and process detail (Table 3). The mean complexity score reflect this 5
continuous scale as model approaches overlap between the three categories. As we go from 6
simple to complex models, a tendency in the leading principle is visible—from understanding 7
towards prediction. The desired balance between these two objectives in a given study could 8
therefore give some indication of the appropriate level of model complexity. 9
10
3.
Multiple Model Strategies in Relation to Coral Reef Management
11 12
Combining models of different complexity
17
Modeling is an art that balances simplicity, realism, and accuracy of various dimensions 1
(Levins 1966): time, space, trophic components, process details, human activities, boundary 2
conditions, and forcings. Considering coral reef management, all model formats have their 3
pros and cons, and need to be applied when they are fit for purpose. However, insights gained 4
by one model can be useful for the application of another (Mooij et al. 2009). Moreover, 5
multiple model types can be applied so that the combined outcomes exceed possible 6
outcomes from using a single model alone. Approaches combining models of different 7
complexities include: 8
The ‘three-stage rocket approach’, in which first mini-models and then 9
intermediate models can be used to identify the relevant variables or processes to 10
steer on. The resulting intermediate model can then provide a basis for the 11
complex model, with the aim of reaching a prediction that is based on 12
understanding. A variant of this approach is to couple models of different forms 13
and origin to piece together a more complete representation of the system. Such 14
approaches are becoming increasingly popular in the research community, but 15
care must be taken to understand how to propagate error and deal with scale 16
differences between the model types. 17
The ‘build then refine approach’, in which a complex model is used to identify 18
key drivers of system responses, which can then be used to develop simpler, faster 19
models (or statistic emulators) whose behavior can be more thoroughly 20
characterized, providing more accurate predictions for a more limited range of 21
scenarios (Robson, in press-a). 22
But, as discussed in the following paragraphs, there are more ways in which we can benefit 23
from combining modeling approaches, including the ‘peeling off complexity approach’, 24
which is the opposite from the ‘three-stage rocket approach’. 25
26
From understanding to projecting
27
Minimal models are important for the development of concepts and theory; they examine 28
how certain phenomena can be reproduced and so reveal general explanations. They are also 29
helpful in identifying and getting insight into processes that cause nonlinear system behavior. 30
As such, minimal models can provide a conceptual framework wherein management 31
scenarios can be explored. They can help managers to address the right questions, i.e., which 32
18
different concepts and test these concepts relative to each other and relative to other factors, 1
such as external forcings (e.g. nutrient input, hurricane damage) and simplistic management 2
scenarios. Improved understanding is still the main aim of this model type, although the 3
increased complexity requires more effort to trace underlying mechanisms. When the 4
understanding of key ecological or socioeconomic processes is sufficiently enhanced one can 5
continue with making projections. However, some of the questions raised by ecosystem 6
managers are beyond intermediate models, as they miss the necessary details in the model 7
conceptualism or the full suite of key ecosystem processes. 8
Model complexity can arise either by increasing the detail at which particular 9
compartments or processes are represented or by broadening the scope of the model, for 10
instance moving from a model of coral biology to a model of coral reef ecosystems to a 11
model that also includes the human behaviors that affect those ecosystems. Many very 12
complex biogeochemical models, for example, are narrowly focused, while broadly focused, 13
integrated economic-ecological-biophysical models often represent their individual 14
components with much less detail. 15
Well-formulated and comprehensive complex models are suitable for evaluating 16
social, economic and ecological tradeoffs of alternative management scenarios but typically 17
lack the straightforward validation needed to fully understand the model’s projection 18
capabilities. Very complex models, on the downside, may be too cumbersome to embed in 19
end-user focused decision-support tools, and may be too computationally intensive to allow 20
large numbers of scenarios or optimization runs to be conducted. They may also lack 21
transparency, which (when these models are used without also employing simpler models) 22
can make it difficult for policy makers to develop confidence in the models and insight into 23
the tradeoffs and processes represented in the models. 24
25
Including socio-economics
26
Intermediate and complex models are difficult to parameterize, analyze, and validate and 27
have a long development time. Because they often contain input from many experts, the 28
model code may be less transparent and harder to maintain and debug, and the performance 29
of these models is rarely thoroughly assessed. However, if these challenges can be overcome, 30
they can include the whole ecosystem and socioeconomic components, and so can be 31
instrumental for management options and strategy evaluations (Plagányi 2007). For coral reef 32
ecosystems such models are rare. From the 26 reviewed model studies, only three model 33
19
coupled biological and Bayesian human behavior model [#18], and an integrated agent-based 1
model [#25]) although in some models, fishing activity is implicit in the model 2
parameterization (e.g., EwE models [#11–14]). The significance of a change in ecosystem 3
state to fisherman or the feedback between fishing pressure and ecosystem state (Cinner et al. 4
2011, Cinner et al. 2009), are important components for successful management (Hughes et 5
al. 2010, Plagányi et al. 2013). 6
7
‘Peeling off’ approach
8
As said above, a major criticism of complex models is the difficulty in understanding the 9
underlying mechanisms of their outcomes. To improve our understanding of the way in 10
which these models generate their results we need to peel off the many layers of complex 11
models to effectively reduce their output to explore the key feedback mechanisms and their 12
response to changes in conditions (Van Minnen et al. 1995, Van Nes and Scheffer 2005). 13
Tools to do this include sensitivity analysis, network analysis of model output, and 14
construction of materials budgets to trace dominants pathways of carbon, energy or nutrients 15
through the system. This approach helps to base complex models upon a proper 16
understanding of the feedback mechanisms explored in minimal models and only those 17
dynamic mechanism and responses that are key to the system’s behavior should be 18
incorporated (Fulton et al. 2005), keeping in mind that synergistic effects may occur. This 19
resulting set of mechanisms and responses should then be augmented by incorporating spatial 20
and environmental parameters that are thought to cause shifts in system states and for which 21
these relationships between state variables were explored (Van Nes and Scheffer 2005). In 22
this approach the results of complex model can be better validated using existing ecological 23
theory and empirical data (Sebastián and McClanahan 2013). 24
25
Stability versus complexity
26
Another recurring criticism of complex models is that community models (e.g., based on 27
Lotka–Volterra equations) become increasingly unstable as complexity increases (May 28
1972). However, field and experimental observations have shown that ecosystem complexity 29
enhances resilience and stability (Burgess et al. 2013, Folke et al. 2004. Friedrichs et al 2007, 30
Hughes et al. 2005, Pasari et al. 2013). Previous work has shown the critical role of space as a 31
resource in marine systems, combating the complexity-stability conflict (Fulton et al. 2004). 32
Findings from food web theory show that to improve a model’s stability, the modelled food 33
20
weak links and mechanisms that weaken the interactions, such as, asymmetric feeding and 1
non-feeding interactions (Fulton et al. 2003, Neutel et al. 2007, Rooney et al. 2006, Travers et 2
al. 2010). When models include sufficient interactions, simulated community stability 3
increases rather than decreases with model complexity (Baird, 2010). 4
Most dynamic ecosystem models include non-linear functional response curves that 5
greatly contribute to system stability, e.g., when predators are capped by a carrying capacity 6
they can no longer drive prey to extinction. Also refugia, migration or dispersal terms and 7
adaptive behavior or plasticity can be built into models to prevent species to die out 8
completely. However, particularly in more complex models, it may be difficult to justify the 9
use of all these stabilizing mechanisms as it is often challenging to obtain realistic parameter 10
values and identify the actual shape of each response curve. The uncertainty of parameters 11
and the complexity of the model makes it difficult to foresee the consequences of model 12
behavior other than bringing stability, i.e., even if the model fit is good, it may be based on 13
the wrong assumptions. Sensitivity analysis and peeling off complexity at the level of these 14
stabilizing mechanisms could provide the required insights. 15
16
Ensemble modeling
17
A way to deal with limits on predictability is to run a complex model with different initial 18
conditions and model formulations and explore the outcomes to assess the likelihood of 19
certain events rather than give a single deterministic or tactical projection (Hannah et al. 20
2010). This approach is called ensemble modeling (another form of ensemble modeling is to 21
compare the results of the application of different model frameworks to the same scenario, 22
see below). Outcomes can then be compared with multiple minimal models for confirmation 23
of results (Fulton et al. 2003), with long term field data (Sebastián and McClanahan 2013) or 24
expert judgment (Mauser et al. 2013). Often, the most interesting and useful results are 25
obtained when the model does not agree with expert judgment, as this indicates either a real, 26
but unforeseen system behavior, which will have implications for management or a fault in 27
the conceptualization of the system as represented by the model, which indicates that further 28
thought or research is needed. 29
Another form of ensemble modeling is when different models are applied to a single 30
system. The resulting bandwidth of outcomes can give insight in the ‘structural uncertainty’ 31
of the inevitable artifacts in the model formulations. This type of uncertainty can only be 32
studied by concurrently applying multiple models and as this approach is rarely taken this 33
21
or even more important than the uncertainty in model output arising from uncertainty in the 1
numerical inputs to the model (e.g., parameters, initial conditions, forcing functions, 2
boundary conditions). Handling and quantification of uncertainty typically focuses on the 3
latter numerical uncertainties (e.g., Hoeke et al 2011, Pandolfi et al 2011, Yara et al 2014 for 4
uncertainties related to climate change and coral reef trajectories). 5
6
4.
Concluding remarks
7 8
From this review of model types, one might conclude that there is something to gain from 9
investing time in appreciating the identity and potential of each of the three model types in its 10
own right and in concert. Each of the discussed model types can be helpful, but each also has 11
limitations, when used in a management-oriented context. Minimal coral reef models are 12
crucial in our understanding of ecosystem feedback loops and their response curves. 13
Understanding the drivers of change in a system’s state will improve effective management 14
responses—to reverse, prevent or mitigate this change. Intermediate models can assist 15
managers with projections of ecosystem responses and indirect outcomes through the 16
inclusion of a broad (but potentially still incomplete) set of key system components. 17
Intermediate coral reef models can be used to answer many questions as they not only include 18
key biological components, but also various environmental or anthropogenic forcings. For 19
some questions (e.g., when there are multiple interacting drivers) more complex models are 20
the most informative decision-support tools, as they include the major dimensions (i.e., 21
spatial, temporal, taxonomic, nutrient, human activities) and, therefore, incorporate the often 22
synergistic effects of various dynamic mechanisms and responses that are beyond what can 23
be represented in minimal or intermediate models that sacrifice on these dimensions in return 24
for an easier way to understand the model outcomes. For example, system-level models are 25
useful for evaluating the economic and ecologic tradeoffs of various management scenarios, 26
as these more complex models contain the extra detail that is required to capture the 27
feedbacks of interest. However, complex models are not suitable in all situations; in other 28
cases managers value the speed and transparency of simple models. 29
30
Literature Cited
22
Ainsworth, C.H., Varkey, D.A., Pitcher, T.J., 2008. Ecosystem simulations supporting 1
ecosystem-based fisheries management in the Coral Triangle, Indonesia. Ecological
2
Modelling, 214, 361–374. 3
Allen, J., Polimene, L., 2011. Linking physiology to ecology: towards a new generation of 4
plankton models. Journal of Plankton Research, 33, 989-997. 5
Anthony, K.R.N., Maynard, J.A., Diaz-Pulido, G., Mumby, P.J., Marshall, P.A., Cao, L., Hoegh-6
Guldberg, O.V.E., 2011. Ocean acidification and warming will lower coral reef resilience. 7
Global Change Biology, 17, 1798–1808. 8
Arias-González, J.E., Nuñez-Lara, E., González-Salas, C., Galzin, R., 2004. Trophic models for 9
investigation of fishing effect on coral reef ecosystems. Ecological Modelling, 172, 197– 10
212. 11
Baird, M.E., 2010. Limits to prediction in a size-resolved pelagic ecosystem model. Journal
12
of Plankton Research, 32, 1131-1146. 13
Ban, S.S., Graham, N.A.J., Connolly, S.R., 2014. Evidence for multiple stressor interactions 14
and effects on coral reefs. Global Change Biology, 20, 681–697. 15
Baskett, M.L., Nisbet, R.M., Kappell, C.V., Mumby, P.J., Gaines, S.D., 2009. Conservation 16
management approaches to protecting the capacity for corals to respond to climate 17
change: a theoretical comparison. Global Change Biology, 16, 1229–1246. 18
Bellwood, D.R., Hughes, T.P., Hoey, A.S., 2006. Sleeping functional group drives coral-reef 19
recovery. Current Biology, 16, 2434–2439. 20
Blackwood, J.C., Hastings, A., Mumby, P.J., 2011. A model-based approach to determine the 21
long-term effects of multiple interacting stressors on coral reefs. Ecological Applications, 22
21, 2722–2733. 23
Botsford, L.W., Holland, M.D., Samhouri, J.F., White, J.W., Hastings, A., 2011. Importance of 24
age structure in models of the response of upper trophic levels to fishing and climate 25
change. ICES Journal of Marine Science: Journal du Conseil, 68, 1270–1283. 26
Brainard, R.E., Birkeland, C., Eakin, C.M., McElhany, P., Miller, M.W., Patterson, M., Piniak, 27
G.A., 2011. Status review report of 82 candidate coral species petitioned under the U.S. 28
Endangered Species Act. U.S. Department of Commerce, NOAA Technical
29
Memorandum, NOAA-TM-NMFS-PIFSC-27 (p. 530). Honolulu, HI.
30
Burgess, M.G., Polasky, S., Tilman, D., 2013. Predicting overfishing and extinction threats in 31
multispecies fisheries. Proceedings of the National Academy of Sciences, 110, 15943– 32
15948. 33
Burke, L., Reytar, K., Spalding, M., Perry, A., 2011. Reefs at risk revisited. Reefs at Risk (p. 34
23
Carilli, J.E., Norris, R.D., Black, B.A., Walsh, S.M., McField, M., 2009. Local stressors reduce 1
coral resilience to bleaching. PLoS ONE, 4, e6324. 2
Carpenter, S.R., Ludwig, D., Brock, W.A., 1999. Management of eutrophication for lakes 3
subject to potentially irreversible change. Ecological Applications, 9, 751-771. 4
Cesar, H., Burke, L., Pet-Soede, L., 2003. The economics of worldwide coral reef 5
degradation. (p. 24). Arnhem: Cesar Environmental Economics Consulting. 6
Cinner, J.E., McClanahan, T.R., Daw, T.M., Graham, N.A.J., Maina, J., Wilson, S.K., Hughes, 7
T.P., 2009. Linking social and ecological systems to sustain coral reef fisheries. Current
8
Biology, 19, 206–212. 9
Cinner, J.E., Folke, C., Daw, T., Hicks, C.C., 2011. Responding to change: Using scenarios to 10
understand how socioeconomic factors may influence amplifying or dampening 11
exploitation feedbacks among Tanzanian fishers. Global Environmental Change, 21, 7– 12
12. 13
De’ath, G., Fabricius, K.E., Sweatman, H., Puotinen, M., 2012. The 27–year decline of coral 14
cover on the Great Barrier Reef and its causes. Proceedings of the National Academy of
15
Sciences, 109, 17995–17999. 16
Draper, D., 1995. Assessment and propagation of model uncertainty. Journal of the Royal
17
Statistical Society. Series B (Methodological), 57, 45–97. 18
Eakin, C.M., 1996. Where have all the carbonates gone? A model comparison of calcium 19
carbonate budgets before and after the 1982–1983 El Nino at Uva Island in the eastern 20
Pacific. Coral Reefs, 15, 109–119. 21
Eakin, C.M., 2001. A tale of two Enso Events: carbonate budgets and the influence of two 22
warming disturbances and intervening variability, Uva Island, Panama. Bulletin of Marine
23
Science, 69, 171–186. 24
Edwards, H.J., Elliott, I.A., Eakin, C.M., Irikawa, A., Madin, J.S., Mcfield, M., Morgan, J.A., 25
Van Woesik, R., Mumby, P.J., 2011. How much time can herbivore protection buy for 26
coral reefs under realistic regimes of hurricanes and coral bleaching? Global Change
27
Biology, 17, 2033–2048. 28
Evans, M.R., Bithell, M., Cornell, S.J., Dall, S.R., Díaz, S., Emmott, S., Ernande, B., Grimm, V., 29
Hodgson, D.J., Lewis, S.L., 2013. Predictive systems ecology. Proceedings of the Royal
30
Society B: Biological Sciences, 280, 20131452. 31
Faure, V., Pinazo, C., Torréton, J.-P., Douillet, P., 2010. Modelling the spatial and temporal 32
variability of the SW lagoon of New Caledonia II: Realistic 3D simulations compared 33
24
FAO, 2007. Best practices in ecosystem modelling: Modelling ecosystem interactions for 1
informing an ecosystem approach to fisheries. FAO Technical Guidelines for Responsible
2
Fisheries: Fisheries Management - The Ecosystem Approach to Fisheries. 44pp. 3
Flynn, K., 2005. Castles built on sand: dysfunctionality in plankton models and the inadequacy of 4
dialogue between biologists and modellers. Journal of Plankton Research, 27, 1205-1210. 5
Folke, C., Carpenter, S., Walker, B., Scheffer, M., Elmqvist, T., Gunderson, L., Holling, C., 6
2004. Regime shifts, resilience, and biodiversity in ecosystem management. Annual
7
Review of Ecology, Evolution, and Systematics, 557–581. 8
Franklin, E.C., Jokiel, P.L., Donahue, M.J., 2013. Predictive modeling of coral distribution and 9
abundance in the Hawaiian Islands. Marine Ecology Progress Series, 481, 121–132. 10
Friedrichs, M.A., Dusenberry, J.A., Anderson, L.A., Armstrong, R.A., Chai, F., Christian, J.R., 11
Doney, S.C., Dunne, J., Fujii, M., Hood, R., 2007. Assessment of skill and portability in 12
regional marine biogeochemical models: Role of multiple planktonic groups. Journal of
13
Geophysical Research: Oceans 112, C08001. 14
Fulton, E.A., 2001. The effects of model structure and complexity on the behaviour and 15
performance of marine ecosystem models. School of Zoology, PhD thesis (p. 428). 16
Hobart: University of Tasmania. 17
Fulton, E., Smith, A., Johnson, C., 2003. Effect of complexity on marine ecosystem models. 18
Marine Ecology Progress Series, 253, 1–16. 19
Fulton, E.A., Smith, A.D.M., Johnson, C.R., 2004. Effects of spatial resolution on the 20
performance and interpretation of marine ecosystem models. Ecological Modelling, 176, 21
27–42. 22
Fulton, E.A., Smith, A.D.M., Punt, A.E., 2005. Which ecological indicators can robustly detect 23
effects of fishing? ICES Journal of Marine Science: Journal du Conseil, 62, 540–551. 24
Fulton, E.A., Link, J.S., 2014. Modeling approaches for marine ecosystem-based management. 25
In: M.J. Fogarty and J.J. McCarthy (Eds) Marine Ecosystem-Based Management. The 26
Sea: Volume 16. Harvard University Press. 27
Fung, T., 2009. Local scale models of coral reef ecosystems for scenario testing and decision 28
support. Faculty of Maths and Physical Sciences, PhD thesis. London: University College 29
London. 30
Gao, L., Hailu, A., 2011. An agent-based integrated model of recreational fishing and coral reef 31
ecosystem dynamics for site closure strategy analysis. 19th International Congress on
32
Modelling and Simulation. Perth, Australia. 33
Gardner, R., Cale, W., O'Neill, R., 1982. Robust analysis of aggregation error. Ecology, 1771– 34
25
Gilmour, J.P., Smith, L.D., Heyward, A.J., Baird, A.H., Pratchett, M.S., 2013. Recovery of an 1
isolated coral reef system following severe disturbance. Science, 340, 69–71. 2
Graham, N.A.J., Bellwood, D.R., Cinner, J.E., Hughes, T.P., Norström, A.V., Nyström, M., 2013. 3
Managing resilience to reverse phase shifts in coral reefs. Frontiers in Ecology and the
4
Environment. 5
Gribble, N., 2003. GBR-prawn: modelling ecosystem impacts of changes in fisheries 6
management of the commercial prawn (shrimp) trawl fishery in the far northern Great 7
Barrier Reef. Fisheries Research, 65, 493-506. 8
Grimm, V., Berger, U., Bastiansen, F., Eliassen, S., Ginot, V., Giske, J., Goss-Custard, J., Grand, 9
T., Heinz, S.K., Huse, G., Huth, A., Jepsen, J.U., Jørgensen, C., Mooij, W.M., Müller, B., 10
Pe'er, G., Piou, C., Railsback, S.F., Robbins, A.M., Robbins, M.M., Rossmanith, E., 11
Rüger, N., Strand, E., Souissi, S., Stillman, R.A., Vabø, R., Visser, U., DeAngelis, D.L., 12
2006. A standard protocol for describing individual-based and agent-based models. 13
Ecological Modelling, 198, 115–126. 14
Hannah, C., Vezina, A., John, M.S., 2010. The case for marine ecosystem models of intermediate 15
complexity. Progress In Oceanography, 84, 121–128. 16
Hare, S.R., Mantua, N.J., 2000. Empirical evidence for North Pacific regime shifts in 1977 and 17
1989. Progress In Oceanography, 47, 103–145. 18
Hoegh-Guldberg, O., Mumby, P.J., Hooten, A.J., Steneck, R.S., Greenfield, P., Gomez, E., 19
Harvell, C.D., Sale, P.F., Edwards, A.J., Caldeira, K., Knowlton, N., Eakin, C.M., 20
Iglesias-Prieto, R., Muthiga, N., Bradbury, R.H., Dubi, A., Hatziolos, M.E., 2007. Coral 21
reefs under rapid climate change and ocean acidification. Science, 318, 1737–1742. 22
Hoeke, R.K., Jokiel, P.L., Buddemeier, R.W., Brainard, R.E., 2011. Projected changes to growth 23
and mortality of Hawaiian corals over the next 100 years. PLoS ONE, 6, e18038. 24
Hughes, T.P., 1994. Catastrophes, phase shifts, and large-scale degradation of a Caribbean coral 25
reef. Science-AAAS-Weekly Paper Edition, 265, 1547–1551. 26
Hughes, T.P., Bellwood, D.R., Folke, C., Steneck, R.S., Wilson, J., 2005. New paradigms for 27
supporting the resilience of marine ecosystems. Trends in Ecology & Evolution, 20, 380– 28
386. 29
Hughes, T.P., Graham, N.A.J., Jackson, J.B.C., Mumby, P.J., Steneck, R.S., 2010. Rising to the 30
challenge of sustaining coral reef resilience. Trends in Ecology & Evolution, 25, 633–642. 31
Hughes, T.P., Linares, C., Dakos, V., van de Leemput, I.A., van Nes, E.H., 2013. Living 32
dangerously on borrowed time during slow, unrecognized regime shifts. Trends in
33
26
Kelly, R.A., Jakeman, A.J., Barreteau, O., Borsuk, M.E., ElSawah, S., Hamilton, S.H., 1
Henriksen, H.J., Kuikka, S., Maier, H.R., Rizzoli, A.E., van Delden, H., Voinov, A.A., 2
2013. Selecting among five common modelling approaches for integrated environmental 3
assessment and management. Environmental Modelling & Software, 47, 159–181. 4
Kennedy, E.V., Perry, C.T., Halloran, P.R., Iglesias-Prieto, R., Schönberg, C.H., Wisshak, M., 5
Form, A.U., Carricart-Ganivet, J.P., Fine, M., Eakin, C.M., 2013. Avoiding coral reef 6
functional collapse requires local and global action. Current Biology. Current Biology. 7
Kleypas, J.A., 1997. Modeled estimates of global reef habitat and carbonate production since the 8
last glacial maximum. Paleoceanography, 12, 533–545. 9
Kramer, D.B., 2007. Adaptive harvesting in a multiple-species coral-reef food web. Ecology and
10
Society, 13, 17 [online]. 11
Kroeker, .KJ., Kordas, R.L., Crim, R., Hendriks, I.E., Ramajo, L., Singh, G.S., Duarte, C.M., 12
Gattuso, J-P., 2013. Impacts of ocean acidification on marine organisms: quantifying 13
sensitivities and interaction with warming. Global Change Biology 19, 1884–1896. 14
Langmead, O., Sheppard, C., 2004. Coral reef community dynamics and disturbance: a 15
simulation model. Ecological Modelling, 175, 271–290. 16
Lapointe, B.E., 1997. Nutrient thresholds for bottom-up control of macroalgal blooms and coral 17
reefs. Limnology and Oceanogaphyr, 44, 1586–1592. 18
Levin, P.S., Fogarty, M.J., Murawski, S.A., Fluharty, D., 2009. Integrated Ecosystem 19
Assessments: Developing the scientific basis for ecosystem-based management of the 20
ocean. PLoS Biol, 7, e1000014. 21
Levins, R., 1966. The strategy of model building in population biology. American Scientist, 54, 22
421–431. 23
Little, L.R., Punt, A.E., Mapstone, B.D., Pantus, F., Smith, A.D.M., Davies, C.R., McDonald, 24
A.D., 2007. ELFSim--A model for evaluating management options for spatially 25
structured reef fish populations: An illustration of the "larval subsidy" effect. Ecological
26
Modelling, 205, 381–396. 27
Liu, J., 2001. Integrating ecology with human demography, behavior, and socioeconomics: 28
Needs and approaches. Ecological Modelling, 140, 1-8. 29
Lorek, H., Sonnenschein, M., 1999. Modelling and simulation software to support individual-30
based ecological modelling. Ecological Modelling, 115, 199–216. 31
Mauser, W., Klepper, G., Rice, M., Schmalzbauer, B.S., Hackmann, H., Leemans, R., Moore, H., 32
2013. Transdisciplinary global change research: the co-creation of knowledge for 33
sustainability. Current Opinion in Environmental Sustainability, 5, 420–431. 34