0022-538X/11/$12.00 doi:10.1128/JVI.00273-11
Copyright © 2011, American Society for Microbiology. All Rights Reserved.
APOBEC3G Complexes Decrease Human Immunodeficiency
Virus Type 1 Production
䌤
Kenneth L. Martin,
1,2Megan Johnson,
1,2and Richard T. D’Aquila
1,2*
Division of Infectious Disease, Department of Medicine,1and Department of Pathology, Microbiology and Immunology,2
Vanderbilt University School of Medicine, AA-2205E Medical Center North, Nashville, Tennessee 37232-2358
Received 6 February 2011/Accepted 29 June 2011
APOBEC3G (A3G) is packaged into human immunodeficiency virus type 1 (HIV-1) virions unless HIV-1 virion infectivity factor (Vif) counteracts it. Virion A3G restricts HIV-1 reverse transcription and integration in target cells. Some A3G in producer cells colocalizes with specific cytoplasmic structures, in what are called “A3G complexes” here. Functional effects of producer cell A3G complexes on HIV-1 replication were studied. HeLa cells were cotransfected with HIV-1 constructs producing pseudoviruses, as well as either wild-type (WT) A3G or a mutant A3G (C97A, Y124A, W127A, or D128K A3G). Pseudovirus particle production was decreased from cells expressing any of the A3Gs that formed complexes by 24 h after transfection, relative to cells with C97A A3G that did not form detectable A3G complexes by 24 h or A3G-negative cells. The intracellular HIV-1 Gag half-life was shorter in cells containing A3G complexes than in those lacking complexes. HIV-1 virion output was decreased in a single round of replication from a T cell line containing A3G complexes (CEM cells) after infection with Vif-negative HIV-1, compared to Vif-positive HIV-1 that depleted A3G. Levels of production of Vif-negative and Vif-positive virus were similar from cells not containing A3G (CEM-SS cells). Knockdown of the mRNA processing body (P-body) component RCK/p54, eliminated A3G complex formation, and in-creased HIV-1 production. We conclude that endogenous A3G complexes in producer cells decrease HIV-1 production if not degraded by Vif.
Members of the APOBEC3 family of cytidine deaminases (APOBEC3B, APOBEC3D/E, APOBEC3F, APOBEC3G [A3G], and some variants of APOBEC3H) can restrict human immu-nodeficiency virus type 1 (HIV-1) replication in human lym-phocytes (4, 7, 9, 27, 41, 57). The most studied and potent of these antiviral enzymes is A3G (29). HIV has a countermea-sure to this host defense, virion infectivity factor (Vif) (34). Vif recruits a cullin-RING ubiquitin ligase complex that marks A3G for proteasomal degradation, thereby precluding its pack-aging into virions (31, 54). In the absence of functional HIV-1 Vif, A3G is packaged into progeny virions via RNA-dependent interactions with the nucleocapsid (NC) domain of HIV Pr55 Gag and then confers antiviral effects in the target cell (22, 56). Although some reports support the assumption that viral coun-termeasures, such as Vif, limit the antiviral effects of the APOBEC3s to blocking vif-defective HIV-1 or retroviruses from other species, severalin vitroandin vivostudies of HIV-1 indicate that there are some antiviral effects of A3G in vif -positive HIV-1 virions and HIV-1 target cells (20, 38, 48, 49). Similarly, murine APOBEC3 has been demonstrated to have activityin vivo against several exogenous mouse retroviruses (1, 17, 28, 35). Therefore, human APOBEC3s likely have phys-iological relevance for human retrovirus infectionsin vivo.
Previous studies using anti-A3G antibody immunofluores-cence observed both diffuse cytoplasmic staining and localiza-tion to large, punctate cytoplasmic foci. Reports suggest that
the cytoplasmic bodies may be associated with RNA granules such as mRNA processing bodies (P-bodies), Staufen granules, and/or stress granules (15, 23, 52). High-performance liquid chromatography (HPLC) has characterized the diffuse T cell A3G as being in a low-molecular-mass (LMM) form and the aggregated form as being in high-molecular-mass (HMM) complexes (8). An alternate method involving ultracentrifuga-tion has also been validated to differentiate these two forms (39). The large HMM complexes have been identified as in-cluding A3G multimers, several polymerase III-transcribed RNAs, and a large number of other associated proteins, many found in more than one of the RNA granules listed above (8, 14, 15, 23). HMM complexes of A3G have also been implicated in restricting endogenous retrotransposons, such as Alu (8, 18). We examined the functional effects of cytoplasmic com-plexes of A3G on HIV-1 replication in HIV-1 producer cells. Although A3G colocalized with P-bodies, we call the cytoplas-mic structures “A3G complexes” because the current flux-based models of these structures posit that some constituents are dynamically exchanged among different RNA granules and our data also suggested dynamism of A3G (2, 21, 24, 45, 50, 55). HIV-1 particle release was enhanced from cells lacking detectable A3G complexes. A p6-deleted HIV-1 Gag that is retained intracellularly decayed more slowly after protein syn-thesis inhibition from cells lacking A3G complexes. A compar-ison of Vif-positive and Vif-negative HIV-1 infection of T-cell lines with endogenous A3G confirmed that this decrease in HIV-1 production is not an artifact of exogenous A3G over-expression. Further, when expression of the P-body protein RCK/p54 was reduced by short hairpin RNAs (shRNAs), im-aging using anti-A3G antibody revealed failure of A3G to localize to complexes and only diffuse staining throughout the * Corresponding author. Mailing address: Division of Infectious
Disease, Department of Medicine, Vanderbilt University School of Medicine, AA-2205E Medical Center North, Nashville, TN 37232-2358. Phone: (615) 322-8972. Fax: (615) 322-3171. E-mail: Richard [email protected].
䌤Published ahead of print on 13 July 2011.
9314
on November 7, 2019 by guest
http://jvi.asm.org/
Downloaded from
on November 7, 2019 by guest
http://jvi.asm.org/
Downloaded from
on November 7, 2019 by guest
http://jvi.asm.org/
cytoplasm, as reported previously (33). HIV-1 production in-creased when the localization of A3G to complexes, but not its expression, was abrogated by RCK/p54 knockdown. This con-firmed that A3G complexes decrease virion production.
MATERIALS AND METHODS
Cells, transfections, and HIV-1 p24 antigen enzyme-linked immunosorbent assay (ELISA).HeLa and HeLa-A3G cells were maintained in Dulbecco’s mod-ified Eagle’s medium (DMEM) supplemented with 10% fetal bovine serum (FBS; HyClone), penicillin (50 IU/ml), and streptomycin (50g/ml). HeLa-A3G cells stably express A3G. CEM and CEM-SS cells were cultured in RPMI 1640 medium supplemented with 10% FBS, penicillin (50 IU/ml), and streptomycin (50g/ml). Transfections into HeLa and HeLa-A3G cells were performed using polyethylenimine (PEI) (40) in six-well plates with 2g of DNA and 10g of PEI diluted in 250l of serum-free media, unless otherwise stated. Complete growth medium was replaced 30 min prior to transfection.
Virus-containing supernatant fluids were collected and filtered through a 0.45-m syringe filter, prior to ultracentrifugation through a 20% sucrose cush-ion (detailed below). Cellular and viral lysates were prepared using ice-cold lysis buffer (50 mM HEPES [pH 7.4], 125 mM NaCl, 0.2% NP-40, 0.1 mM phenyl-methylsulfonyl fluoride [PMSF], and EDTA-free protease inhibitor cocktail [539137; CalBiochem, San Diego, CA]). The HIV-1 p24 antigen ELISA was carried out as previously described (49, 51). The percentage of p24 production was calculated as the culture supernatant ultracentrifugation pellet p24 antigen concentration divided by the total p24 antigen concentration (cell lysate⫹ culture supernatant ultracentrifuge pellet concentration). Others have previously used this method to determine changes in percent p24 antigen production (16, 47). The HIV-1 p24 antibody 183 detects Gag precursor polypeptides Pr55 and Pr41, and processed p24 capsid protein (CA), within the cell, as well as processed p24 CA within the virion (46, 47).
Blood was obtained from an uninfected donor using a protocol approved by the Vanderbilt University Institutional Review Board (IRB). CD4⫹T lympho-cytes were isolated from blood using negative selection (Stem Cell Technolo-gies). CD4⫹T cells were activated by anti-CD3/CD28 beads (Dynal) at a ratio of 1:1 for 3 days. Two million CD4⫹T lymphocytes were washed in cold phosphate-buffered saline (PBS) and lysed in 60l of ice cold lysis buffer (60 mM NaCl, 50 mM HEPES [pH 7.4], 0.2% NP-40, 0.1 mM PMSF, and 1⫻EDTA-free protein inhibitor cocktail) by vortexing. Following 10 min of incubation on ice, lysates were clarified by low-speed spinning at 18,000⫻gfor 10 min and used for immunoblotting for A3G.
APOBEC3G mutant construction.Plasmids expressing human A3G were con-structed by PCR amplification from a construct obtained from Michael Malim (43). Primers containing the NotI and HindIII restriction sites and a single hemagglutinin (HA) tag were used. The PCR product was TA cloned into pGEM T Easy Vector (Promega). The sequence was validated, and the plasmid (named NotI-hA3G-HA-HindIII) was used as a template for all site-directed mutagenesis. A QuikChange II site-directed mutagenesis kit (200523; Strat-agene) was used according to the manufacturer’s protocol. The following for-ward (F) and reverse (R) primers were used for the construction of C-terminal HA-tagged A3G mutants: C97A A3G (F, 5⬘-CATATCCTGCCCCGCCACAA AGTGTACAAGG-3⬘; R, 5⬘-CCTTGTACACTTTGTGGCGGGGCTCCAGG ATATG-3⬘) Y124A A3G (F, 5⬘-CTTTGTTGCCCGCCTCGCCTACTTCTGG GACCCAG-3⬘; R, 5⬘ -CTGGGTCCCAGAAGTAGGCGCGGGCAACAAAG-3⬘) W127A A3G (F, 5⬘ -CGCCTCTACTACTTCGCGGACCCAGATTACCAG-3⬘; R, 5⬘-CTGGTAATCTGGGTCCGCGAAGTAGTAGCG-3⬘), and D128K A3G (F, 5⬘-CTACTACTTCTGGAAACCAGATTACCAGG-3⬘; R, 5⬘-CCTCC TGGTAATCTGGTTTCCAGAAGTAGTAG-3⬘).
Immunostaining and confocal microscopy. A3G expression plasmids (de-scribed above) were transfected into cells without endogenous A3G (using 2g of plasmid DNA and 10g of PEI diluted in 250l of serum-free medium). An HIV-1 Gag construct expressing matrix (MA), spacer peptide 1 (Sp1), capsid (CA), nucleocapsid (NC), Sp2, and p6 open reading frames, with cyan fluores-cent protein (CFP) fused to p6, was used; the construct is competent for pseu-dovirion production (10). Cells were grown on 22-mm coverslips in six-well plates and then fixed with 3.7% formaldehyde for 5 min at room temperature before imaging. Cells were permeabilized with 0.1% Triton X-100 for 5 min and then blocked in 5% bovine serum albumin (BSA) for 1 h at room temperature. Nuclei were stained with a 1:1,000 dilution of To-Pro 3 in PBS for 20 min. For immu-nofluorescence, primary antibodies were diluted in antibody dilution buffer (1% BSA, 0.05% NP-40, and 2% goat serum in PBS at a concentration of 1:500). Primary antibodies were incubated on cells for 1 h, and the cells were washed
three times with wash buffer (1% BSA and 0.05% NP-40) for 5 min. A polyclonal anti-APOBEC3G antibody (9968; NIH AIDS Repository) and HIV-1 anti-p24 mouse monoclonal antibody 183 were obtained from NIH AIDS Repository. Primary anti-goat antibodies directed against GW182, TIA-1, LAMP3 (CD63), RCK/p54, and anti-rabbit HA antibody were obtained from Santa Cruz (Santa Cruz, CA). Staufen antiserum was a gift from Luc DesGroseillers, Universite´ de Montre´al. Secondary antibodies used were anti-mouse Alexa Fluor 546, anti-goat Alexa Fluor 568, and anti-rabbit Alexa Fluor 488 from Molecular Probes (Eu-gene, OR). Secondary antibodies were diluted in antibody dilution buffer at a concentration of 1:1,000. Arsenite treatment of cells to induce stress granules involved incubation in 1 mM NaAsO2for 30 min.
Images were acquired using a Carl Zeiss LSM 510 Meta confocal microscope with detector gain set to 650 and a standardized exposure time. For colocaliza-tion assessment, a region of interest was generated around an individual cell. Next, quantitation of colocalization of A3G and Gag protein was performed by the inclusive thresholding of each channel of each image to eliminate nonspecific background. The colocalization function of Metamorph (Molecular Devices, Sunnyvale, CA) was used to derive percentages of colocalized pixels.
Biochemical separation of APOBEC3G forms.A previously validated method was used to characterize the form of A3G in cell cytoplasm (39). Confluent 100-mm plates of cells were rinsed with cold PBS, lysed with 500l cold lysis buffer, and vortexed for 10 min. Cell lysates were clarified at 17,900⫻gfor 10 min to remove nuclei. Clarified lysates were ultracentrifuged at 45,000⫻gfor 1 h at 4°C. Supernatant fluid was carefully removed, and the pellet was resuspended in lysis buffer at a volume equal to that of the removed supernatant fluid. Equal volumes of resuspended pellet and supernatant fluid were then subjected to Western blot analysis. Proteins were resolved by 10% SDS-PAGE. Proteins were transferred to a nitrocellulose membrane and blocked overnight in 5% milk. The membrane was probed with a polyclonal anti-APOBEC3G antibody (9968; NIH AIDS Repository) and washed with PBS–0.05% Tween 20 (PBST).
Assessment of intracellular HIV-1 protein decay.A Gag expression plasmid that generates a myristoylated MA-CA-Sp1-NC Gag, lacking Sp2 and p6 (called MACANC), was used (27). The p6 late domain is required for virus budding and this p6 deletion mutant retains all expressed Gag within the cell. Eighteen hours posttransfection with this p6-deleted Gag construct, HeLa cells were either treated or not with 10g/ml of cycloheximide. Cells were lysed at 0, 6, 12, and 24 h after cycloheximide addition. Lysates were analyzed by Western blot anal-ysis. Primary and secondary antibodies were incubated with the membrane for 1 h. Nitrocellulose membranes were blocked overnight at 4° in Odyssey blocking buffer. Blots were washed 3 times for 5 min with Odyssey blocking buffer (0.05% Tween 20) before and after primary and secondary antibody incubation. HIV-1 Gag expression was normalized by-tubulin for each time point. Primary anti-body staining for A3G (polyclonal A3G antianti-body, 9968; NIH AIDS repository) and-tubulin (anti--tubulin primary antibody sc-9104; Santa Cruz) (the latter was also used in immunoblots) preceded staining with secondary anti-mouse IRDye 800 and anti-rabbit Alexa Fluor 680 antibodies. HIV-1 Gag and-tubulin protein bands, respectively, were detected using a Li-Cor Odyssey system (Li-Cor, Lincoln, NE).
Viruses and infections.HIV-1 viral stocks were generated by PEI transfection of 3⫻106
cells HeLa cells in a 100-mm culture dish 24 h after cell plating with 15g of one of a number of different HIV-1 expression plasmids. The following infectious (HIV-1 envelope-positive) molecular clones were studied: pNL4.3, pNL4.3⌬vif, or pNL4.3vifnull. Similarly, envelope-negative HIV-1 with repli-cation limited to a single cycle was produced and pseudotyped by cotransfecting a vesicular stomatitis virus envelope glycoprotein G (VSV-G) expression plasmid with either pNL4.3 (envnegative) or pNL4.3⌬vif(envnegative). Both pNL4.3 ⌬vifand pNL4.3⌬vif(envnegative) produce a truncated nonfunctional Vif peptide of 128 amino acids. pNL4.3vifnull contains tandem stop codons at positions 26 and 27 of thevifopen reading frame. Finally, HIV-1 construct⌬8.9 HIV-1, containinggag,pol, andrevgenes, was also used. This construct lacksenv and any accessory genes and produces pseudovirions (58).
Pseudovirus- and virus-containing supernatants were harvested 48 h posttrans-fection. HIV-1 capsid protein content was determined using HIV-1 p24 ELISA. For infections with HIV-1 envelope-positive or -negative virus, 1.5⫻106CEM
(APOBEC3G-positive) or CEM-SS (APOBEC3G-negative) cells were infected with 50 ng of p24-containing virus stock. Four hours later, cells were washed three times (to completely remove the input virus), resuspended in growth medium, and cultured for an additional 24 h. Washing at 30 min after inoculation prevented infection and served as a control for adequacy of extracellular virion removal by identical washing at 4 h after inoculation. In experiments with infec-tious (HIVenv⫹) HIV-1, the nonnucleoside reverse transcriptase inhibitor efa-virenz (EFV) was added at a concentration of 25M at 16 h postinfection to limit a secondary round of infection. Viral supernatants were ultracentrifuged
on November 7, 2019 by guest
http://jvi.asm.org/
through a 20% sucrose cushion (125,000⫻gat 4°C for 45 min.), as previously described, prior to p24 antigen ELISA (11). Cellular and viral lysates were prepared, and p24 antigen was quantified in each by HIV-1 p24 antigen ELISA.
shRNAs.Knockdown of RCK/p54 was performed using a 100 nM concentra-tion of an shRNA-expressing construct, 5⬘-GCAGAAACCCUAUGAGAUUU U-3⬘, as described by others (26) (Dharmacon). HeLa or HeLa-A3G cells were seeded in a six-well plate and grown overnight to 60% confluence. One day after plating, cells were transfected by Lipofectamine 2000 (Invitrogen) with nonspe-cific scrambled or p54-spenonspe-cific shRNA. On day 2, cells were trypsinized, spun down, and washed in PBS 5 times and then replated. Four hours after trypsiniza-tion, cells were transfected a second time with either scrambled or p54-specific shRNA. In experiments using HeLa cells, the wild-type (WT) A3G expression plasmid was cotransfected during the second shRNA transfection. Twenty-four hours after the second cotransfection, HeLa-A3G cells were used for HIV-1 infection experiments. An expression plasmid, CMX-44X, that expresses CD4 lacking a cytoplasmic tail to allow high-level expression, was cotransfected with the shRNA vector at the first transfection into HeLa-A3G cells. Infection with HIV-1 virus stocks (either NL4.3⌬vifor wild-type NL4.3) occurred on day 2 after trypsinization and the second transfection. Four hours after infection, cells were washed three times to completely remove the inoculum. The reverse transcrip-tase inhibitor EFV was added at a concentration of 25M at 16 h postinfection to limit secondary rounds of infection. Virus production was assessed 24 h after infection. Cells were imaged by confocal microscopy after staining with anti-A3G antibody (polyclonal A3G antibody, 9968; NIH AIDS Repository). CD4 protein levels were immunoblotting using rabbit anti-CD4 antibody (Sigma-Aldrich).
RESULTS
APOBEC3G partially colocalizes in HeLa cells with RNA
granules and late endosomes.HeLa cells transfected with
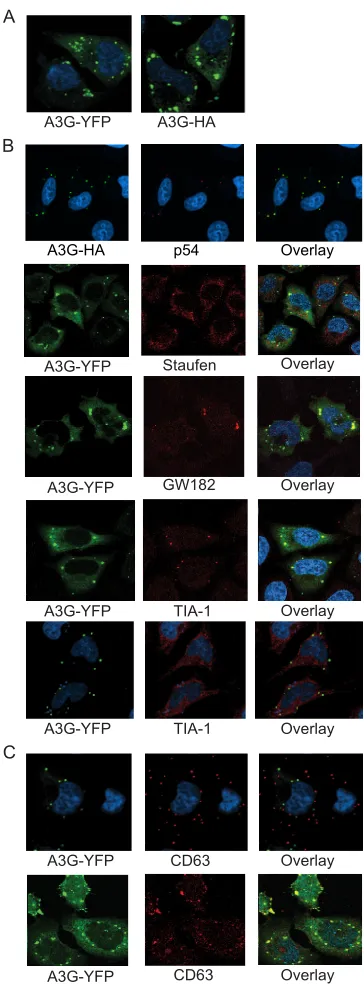
ei-ther A3G-yellow fluorescent protein (YFP) or A3G-HA ex-pression vectors (2 g) displayed both diffuse cytoplasmic staining and localization to large cytoplasmic puncta (Fig. 1A). Cytoplasmic puncta were seen over a wide range of input expression plasmid concentrations, starting as low as 0.15g of DNA, indicating that A3G complex formation was not a result of overexpression (data not shown). A3G-YFP partially colo-calized with protein markers for P-bodies (RCK/p54, GW182, Staufen; Dcp-1 was also imaged, and its colocalization is not shown) (Fig. 1B). The number of P-bodies present in cells did not differ with and without A3G-YFP transfection. Fifty fields were identified from the middle slices of confocal z-sections, and 30 of those fields were randomly selected for quantitation. There were 5⫾2 P-bodies per cell without A3G-YFP trans-fection and 6⫾2 P-bodies per cell with A3G-YFP transfection (not shown). Stress granules were not seen in HeLa cells after A3G transfection; arsenite treatment was necessary to induce stress granules. A3G colocalized with TIA-1 only in arsenite-induced stress granules (Fig. 1B). Potential dynamic transit among structures was also suggested by the lack of colocaliza-tion of A3G with the late endosome marker CD63 at 16 h and the partial colocalization with that marker at 24 h (Fig. 1C). Thus, A3G partially colocalizes at early times with P-bodies and with stress granules (if the latter are present after stress), as well as with late endosomes at later times after transfection.
HIV-1 Gag transiently colocalizes with A3G complexes.To
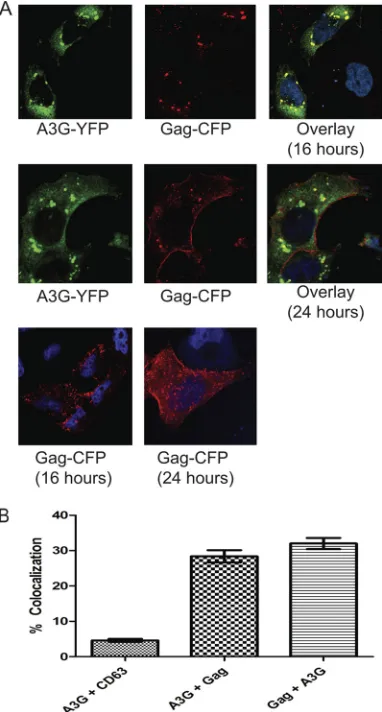
test whether these A3G complexes also colocalize with HIV-1 Gag, HeLa cells were cotransfected with HIV-1 Gag-CFP and A3G-YFP expression constructs. The Gag-CFP vector is com-petent for HIV-1 virus-like particle release (10). Intracellular Gag levels were maximized at 16 h after transfection, and Gag was largely localized at the plasma membrane at 24 h. A3G and Gag colocalized at 16, but not 24, hours after cotransfection (Fig. 2A, top and middle rows). Gag localization was not
af-FIG. 1. APOBEC3G partially colocalizes in HeLa cells with RNA granules and late endosomes. (A) Confocal images of HeLa cells 18 h after transfection with A3G-YFP and A3G-HA (each in green). The two expression constructs show similar localization of A3G to large cytoplasmic complexes (called A3G complexes here) and diffuse stain-ing throughout the cytoplasm. (B) HeLa cells transfected with A3G-HA or A3G-YFP (green) and also stained with antibodies for p54, Staufen, GW182, and TIA-1 (red). Cells stained for TIA-1 were treated with 1 mM arsenite (to induce cellular stress) before fixing (4th row). Cells stained for TIA-1 (5th row) were optimally grown and received no arsenite treatment. (C) HeLa cells transfected with A3G-YFP and stained with antibodies to the late endosome marker, CD63. Top row, cells 16 h posttransfection (showing little to no colocaliza-tion); bottom row, cells at 24 h posttransfection (showing significant colocalization). All nuclei in panels A to C are stained with To-Pro3 (blue), and the right column in panels B and C shows an overlay of images of A3G and another protein (in yellow).
on November 7, 2019 by guest
http://jvi.asm.org/
[image:3.585.329.511.72.564.2]fected by cotransfected A3G (Fig. 2A, compare lower row with Gag transfected alone to top and middle rows with cotrans-fected Gag and A3G). Areas of Gag and A3G colocalization (Fig. 2A, right panel of top and middle rows, in yellow) were quantified in 30 randomly selected images using Metamorph software. Approximately 29% of A3G pixels overlapped with those of Gag, and 31% of Gag pixels overlapped with those of A3G (Fig. 2B). The CD63 late endosome marker that did not colocalize with A3G at 16 h (as seen in Fig. 1C) was a negative control for the quantitation.
C97A A3G is delayed in A3G complex formation, compared
to the wild type and other mutants.We next compared the
subcellular localization of several previously described A3G
mutants. Opi et al. previously characterized the C97A substi-tution that disrupts the N-terminal zinc-finger domain of A3G, abrogates multimerization in biochemical assays, and causes more diffuse localization of A3G throughout the cytoplasm (36, 37). Other mutants studied were D128K, which is pack-aged efficiently into virions and alters species specificity of Vif-mediated degradation (3, 25, 42, 53), and Y124A and W127A A3G, which are each severely deficient in virion pack-aging (19).
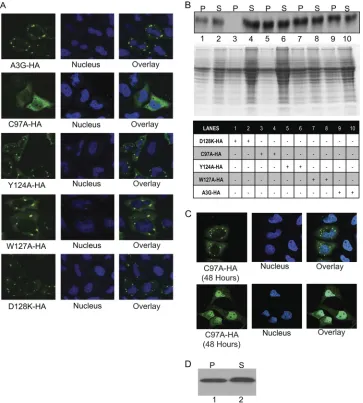
Each C-terminal HA-tagged A3G construct was transfected individually into HeLa cells. Cells were fixed at 24 h posttrans-fection and stained with anti-HA antibodies to detect the var-ious A3Gs. Figure 3A shows that WT A3G-HA formed A3G complexes at 24 h. The C97A A3G-HA remained diffuse throughout the cytoplasm (with no complexes evident in over 50 fields) and also displayed increased nuclear staining at 24 h, as reported earlier (36, 37). However, at 48 h after transfec-tion, (50 out of 50) fields of C97A A3G-transfected cells showed some degree of A3G complex formation along with decreased nuclear staining, relative to results seen with the 24 h images. Two representative images of C97A at 48 h posttransfection that emphasize these differences are shown (Fig. 3C). Although all images taken at 48 h show some for-mation of A3G complexes by C97A A3G, there were various degrees of both complex formation and localization to the nucleus in different images at 48 h that appeared inversely related. Each of the other mutant A3Gs tested (Y124A, W127A, D128K) formed A3G complexes at 24 h with much less diffuse cytoplasmic localization than that seen with C97A A3G and no evident nuclear staining (Fig. 3A). C97A-HA is also packaged into the virus efficiently at 24 h posttransfection, confirming the earlier report that A3G complexes are not necessary for A3G virion packaging (data not shown).
Ultracentrifugation of cytoplasmic lysates following removal of nuclei showed that WT A3G-HA and Y124A, W127A, and D128K A3G-HA proteins each were present in both the pellet and the supernatant at 24 h after transfection (Fig. 3B). In contrast, C97A A3G-HA was detected at that time point only in the supernatant (Fig. 3B, lane 4) and not in the pellet (Fig. 3B, lane 3). This biochemically confirmed the absence of A3G complexes in C97A A3G-HA observed by confocal imaging at 24 h (Fig. 3A). As a control for equivalent protein loading, the Coomassie blue-stained gel of the cytoplasmic lysate pellets shows similar protein amounts in the pellet of each mutant, including C97A A3G-HA (Fig. 3B, middle panel). At 48 h after transfection, C97A A3G-HA was found in both the pellet and ultracentrifuge fraction, confirming at least some complex for-mation by that time (Fig. 3D).
Producer cell A3G complexes decrease HIV-1 pseudovirus
production and intracellular HIV-1 Gag half-life. We next
sought to compare levels of HIV-1 pseudovirus production from cells with and without A3G complexes. HeLa cells were cotransfected with ⌬8.9 HIV-1 and either an empty vector control, WT A3G-HA, C97A A3G-HA, or Y124A A3G-HA. After 24 h, culture supernatant fluid ultracentrifuge pellets and cellular lysates were collected, and HIV-1 p24 antigen ELISA and Western blots were performed. The concentration of p24 antigen in the pellet of the ultracentrifuged culture superna-tant was divided by the sum of the amount of p24 antigen reactivity in the cell lysate and in the pellet of the ultracentri-FIG. 2. HIV-1 Gag transiently colocalizes with A3G complexes.
(A) HeLa cells cotransfected with A3G-YFP (green) and HIV-1 Gag-CFP (red) at 16 h (top row) and 24 h (middle row) after transfection. The bottom row shows HeLa cells transfected with Gag-CFP alone at the same time points and indicates similar subcellular localization of HIV-1 Gag in the absence of A3G as in its presence. (B) Quantitation of the colocalization of A3G-YFP and Gag-CFP at 16 h posttransfec-tion in 30 fields that were randomly selected from 50 fields for quan-titation. As a control, cells transfected with A3G-YFP and stained with anti-CD63 antibody at 16 h (before A3G colocalizes with CD63) (Fig. 1C) were used. A3G⫹CD63 indicates A3G overlapping with CD63, A3G⫹Gag represents A3G overlapping with Gag, and Gag⫹A3G represents the amount of Gag overlapping with A3G. Error bars rep-resent standard deviations.
on November 7, 2019 by guest
http://jvi.asm.org/
[image:4.585.67.258.71.427.2]fuged culture supernatant to yield the percent p24 antigen produced. The percentage of p24 antigen produced from HeLa cells cotransfected with HIV-1 and a control empty (A3G-negative expression) vector was comparable to that in similar experiments reported by others (13, 16, 47).
Cells cotransfected with the control plasmid not expressing A3G, as well as cells cotransfected with the plasmid expressing C97A A3G-HA that did not form detectable A3G complexes at 24 h, each produced significantly more pseudovirions at 24 h than did cells cotransfected with WT A3G-HA or Y124A A3G-HA (Fig. 4A). Cells expressing either WT A3G-HA or Y124A A3G-HA had 28% and 34% of the pseudovirus output, respectively, compared to control cells lacking A3G (for each of these percentages of p24 production,P ⫽ 0.0079,
Mann-Whitney U test) (Fig. 4B). Cells containing the C97A A3G-HA mutant at 24 h after transfection did not differ from the A3G-negative control in virus production (Fig. 4B). The amount of supernatant viral pellet p24 antigen was also significantly lower in wild-type and Y124A A3G than in cells lacking A3G (P⫽
0.0079 in both cases) (Fig. 4B).
A3G levels were assessed by immunoblotting with anti-HA antibody to determine if differences in expression level ac-counted for the observed HIV-1 production differences. Equiv-alent levels of A3G were seen for each variant (Fig. 4C), excluding that possibility. Immunoblotting using anti--tubulin antibody also indicated that similar amounts of each specimen were loaded onto the gel (Fig. 4C).
[image:5.585.111.474.70.473.2]There was no increase in intracellular p24 levels in cells with FIG. 3. C97A A3G is delayed in A3G complex formation, compared to the wild type and other mutants. (A) HeLa cells were transfected with the indicated A3G-HA construct (either wild-type A3G-HA, C97A-HA, Y124A-HA, W127A-HA, or D128K-HA) and then imaged by staining with anti-HA antibody at 24 h. (B) Cell lysates of transfected cells at 24 h from the same experiment as shown in panel A were subjected to ultracentrifugation. The pellet and supernatant were analyzed by Western blotting and stained with an anti-HA antibody. A3G in the pellet (P) and supernatant (S) of transfected cells are shown in the upper panel. The middle panel shows the same samples run on an SDS-PAGE gel and stained with Coomassie blue as a control to assess equivalence of loading in each lane. The lower panel provides a key to indicate which A3G-HA construct is in each lane in the upper panel. (C) HeLa cells were transfected with C97A mutant and imaged at 48 h posttransfection. Two representative images are shown. (D) Western blots of the lysates from panel C show C97A in the pellet and supernatant at 48 h posttransfection.
on November 7, 2019 by guest
http://jvi.asm.org/
FIG. 4. Producer cell A3G complexes decrease HIV-1 pseudovirus production and intracellular HIV-1 Gag half-life. (A) The percentage of HIV-1 p24 antigen production 24 h after HeLa cells were cotransfected with⌬8.9 HIV-1 and the indicated A3G expression plasmid construct (Control, empty A3G expression vector) are shown. Supernatants were harvested at 24 h posttransfection and spun through a 20% sucrose cushion. Cellular lysates were also made. HIV-1 p24 antigen ELISA was performed with both the cell and pelleted supernatant lysates, and the percentage of p24 production was calculated by the amount of p24 in the supernatant divided by the total amount of p24 in the supernatant plus the cell lysate. (B) The table shows average p24 values from cell lysates and supernatants (Sup) of the experiment in Fig. 5A. There is a significant difference in supernatant (P⫽0.001 in both cases, Mann-Whitney U) and total p24 levels (P⬍0.002 in both cases, Mann-Whitney U) between the no-A3G control and the A3G and Y124A conditions. There was no significant difference in HIV-1 p24 antigen production between the no-A3G control and C97A A3G. Significant differences in the percentage of HIV-1 p24 antigen production from the no-A3G control are indicated by an asterisk (P⬍0.0119 in each case, Mann Whitney U). (C) Western blots of the cell lysates from panel A are shown indicating equivalent amounts of A3G for each variant (based on anti-HA staining, upper panel), HIV-1 Gag (middle panel), and protein loading (based on anti--tubulin antibody staining, lower panel). Cells were cotransfected with⌬8.9 HIV-1 and empty-vector control (lane 1), A3G-HA (lane 2), C97A A3G-HA (lane 3), and Y124A A3G-HA (lane 4). (D) Western blot shows relative A3G levels in CEM cells (lane 1), A3G-transfected HeLa cells (lane 2), and activated CD4 T cells (lane 3). A total of 50g of each cell lysate was loaded per lane. A3G was visualized with a polyclonal A3G antibody (9968; NIH AIDS Repository). (E) Experiment showing intracellular half-life of p6-deleted HIV-1 Gag over 24 h following 10g/ml cycloheximide treatment started at 0 h. Degradation of p6-deleted p24 (that is not released from the cell) was assessed by quantitative immunoblotting after protein synthesis inhibition by cycloheximide, in the presence or absence of untagged A3G. Controls were treated similarly, but with no cycloheximide treatment. Cells were lysed at the indicated time point and subjected to Western blot analysis, and bands were quantitated using Li-Cor Odyssey. HIV-1 Gag was normalized to-tubulin, the expression of which changed very little over the time. Multiple linear regression analysis showed that HIV-1 Gag expression decreased more rapidly in cells with wild-type A3G than in cells with no A3G (P⫽0.009). There was no difference in Gag levels between cells with no A3G versus those with C97A (P⫽0.8). There was no statistical difference in Gag expression between cells with A3G and those without at time zero (when cycloheximide was added 16 h after cotransfection;P⫽0.6).
on November 7, 2019 by guest
http://jvi.asm.org/
wild-type or Y124A A3G, relative to the no-A3G control or the C97A A3G at 24 h (Fig. 4B). Increases in intracellular HIV-1 p24 (Gag) in the cells with A3G complexes were also not apparent by immunoblotting of cell lysates (Fig. 4C). This lack of an increase in intracellular HIV-1 p24 antigen in cells containing A3G complexes was not consistent with a block to release from the cell as the mechanism for decreased super-natant pseudovirus. Moreover, total HIV-1 p24 levels (e.g., intracellular plus extracellular levels) were significantly de-creased with either wild-type or Y124A A3G, relative to the no-A3G control and C97A A3G (Fig. 4B). This could be due to either decreased synthesis or increased degradation of HIV-1 p24 in cells with A3G complexes.
Because of the observed colocalization of Gag and A3G complexes (Fig. 2), and of A3G with late endosomes (Fig. 1C), we tested if degradation of p24 was different with the wild type versus C97A A3G or a no-A3G control. A p6 late-domain deletion Gag mutant, which prevents p24 release from cells and retains all HIV-1 p24 antigen intracellularly, was used to avoid possible differences in release from the cell by the A3G variants in measuring total Gag over time. Intracellularly re-tained Gag levels were compared over time in cells expressing p6-deleted Gag alone, p6-deleted Gag with wild-type A3G (competent for forming complexes at 24 h), and p6-deleted Gag with C97A A3G (not forming detectable A3G complexes at 24 h). Gag levels were monitored after protein synthesis was blocked by cycloheximide, as well as in controls lacking cyclo-heximide treatment (Fig. 4E). Cells were treated with 10g/ml of cycloheximide starting 18 h posttransfection (Fig. 4E, time zero). Cells were collected and lysed at 0, 6, 12, and 24 h following the start of cycloheximide treatment to measure total HIV-1 p24. Cycloheximide treatment did not alter wild-type A3G complex formation (data not shown). Gag protein level was normalized by -tubulin immunoreactivity at each time point. There was no difference in Gag expression between cells with and without A3G at time zero, and-tubulin expression did not change over time (not shown).
Multiple linear regression showed that Gag levels increased similarly over time in all cells not treated with cycloheximide as a control (Fig. 4E). HIV-1 Gag levels decreased more rapidly after cycloheximide addition in cells with A3G complexes at 24 h (WT A3G-transfected cells) than in cells with either no A3G or C97A A3G that does not form A3G complexes by 24 h (P⫽0.009) (Fig. 4E). There was no difference between cyc-loheximide-treated cells with C97A A3G and those with no A3G. These data support the hypothesis that A3G complexes shorten HIV-1 intracellular Gag protein half-life as a proxi-mate cause of decreased HIV-1 production.
To determine whether the levels of A3G in transfected HeLa cells were within the range of endogenous A3G expres-sion in T cells, cell lysates of CEM cells (which express endog-enous A3G), WT A3G-HA-transfected HeLa cells (from the experiments depicted in Fig. 4A and B), and activated primary CD4⫹ T cells (derived from peripheral blood mononuclear cells of a donor not infected with HIV-1) were immunoblotted using an anti-A3G antibody (Fig. 4D). The level of exogenous A3G in the transfected HeLa cells was not higher than that of endogenous A3G in CEM cells and activated primary CD4⫹T cells (Fig. 4D, normalized for-tubulin), indicating that there was not supraphysiological overexpression of A3G.
Vif-mediated depletion of A3G complexes in CEM cells
in-creases HIV-1 production.We next sought to confirm that this
effect of A3G complexes to decrease HIV-1 production was not an artifact of overexpression of exogenous A3G, or pseu-dovirus construct transfection, by studying HIV-1 infection of a T cell line, CEM, which expresses physiological levels of endogenous A3G (Fig. 4D). Vif expressed from wild-type NL4.3 HIV-1 degraded A3G both within and outside A3G complexes, while cells infected with Vif-negative NL4.3 had unaltered levels of A3G complexes (not shown). This allowed a comparison of relative virus output from the same HIV-1-infected producer T cell type in the presence and absence of endogenous A3G, including A3G complexes. We limited virus replication to a single round to avoid possible confounding effects of multiple rounds of replication.
We first studied CEM cells infected with VSV-G envelope-pseudotyped HIV-1 that could not cause a spreading infection. HIV-1 NL4.3env-deleted strains, with either a wild-type or a deleted (⌬vif)vifgene, were pseudotyped with VSV-G. NL4.3 ⌬vifhas an in-frame deletion invif, resulting in a 128-amino-acid truncated protein that is inactive for A3G degradation. Input virus inoculum was removed by extensive washing 4 h after addition to allow virus production to be measured 24 h after infection. A control to ensure complete removal of inoc-ulum used identical washing of CEM cells at 30 min after the VSV-G-pseudotyped, Vif-positive NL4.3 inoculum was added (Fig. 5A, left-most bar, control). HIV-1 production was in-creased from CEM cells infected with a Vif-positive, VSV-G-pseudotyped NL4.3, compared to infection with an otherwise isogenic Vif-negative virus (Fig. 5A) (P⫽0.0048, Mann-Whit-ney U). Immunoblots confirmed that A3G was present only in the CEM cells infected with Vif-negative virus and that intra-cellular HIV-1 Gag and protein loading (anti--tubulin immu-noreactivity) were equivalent across all infected cells (Fig. 5A, below graph). VSV-G-pseudotyped NL4.3⌬vif-infected CEM cells produced 44% as much virus as VSV-G-pseudotyped wild-type, Vif-positive NL4-3-infected CEM cells (Fig. 5C, up-per left portion of table).
We next assessed fully replication-competent viruses with CXCR4-tropic HIV-1 envelopes and limited infection to a single round of replication by adding EFV at 16 h after infec-tion. A control experiment in which 25M EFV was added at the time of infection confirmed that this concentration pre-vented viral replication with no toxic effect on cell numbers or viability (data not shown). In addition to wild-type Vif-positive NL4.3, two different Vif-negative HIV-1 strains were used: NL4.3⌬vif(described above) and NL4.3vifnull. The latter is an isogenic clone of pNL4.3 that contains tandem stop codons at residues 26 and 27 of thevifopen reading frame, rendering it inactive for A3G degradation. HIV-1 production was de-creased from CEM cells infected with either of the Vif-nega-tive viruses (⌬vifandvifnull), relative to that seen with Vif-positive HIV-1 infection of CEM cells (Fig. 5B) (P⫽0.0022 and 0.005, respectively). A3G was detected by immunoblotting only in the two Vif-negative virus infections (Fig. 5B, panel below graph), and intracellular HIV-1 Gag and protein loading (anti--tubulin immunoreactivity) were equivalent across all infected cells (Fig. 5B, below graph). A3G was present in the cell lysate ultracentrifugation pellet, as well as in the superna-tant, fractions only in the two Vif-negative virus-infected CEM
on November 7, 2019 by guest
http://jvi.asm.org/
cells (Fig. 5D). This indicates the presence of A3G complexes in CEM cell lysates infected with NL4.3⌬vifand NL4.3 vifnull and not in CEM cells infected with Vif-positive NL4-3. Figure 5C summarizes results of infections of CEM cells with both HIV-1env-negative and HIV-1env-positive viruses.
[image:8.585.122.471.70.476.2]CEM-SS cells that do not express A3G were also infected as another control (43). HIV-1 production levels from CEM-SS cells lacking any A3G did not differ at 24 h after infection with Vif-positive versus Vif-negative virus with either VSV-G or HIV-1 envelopes (data not shown).
FIG. 5. Vif-mediated depletion of A3G complexes in CEM cells increases HIV-1 production. (A) The graph in the upper portion shows percent virus production at 24 h postinfection from single-round infections of cells by HIV-1 Env-negative, VSV-G-pseudotyped viruses. To ensure that the input virus inoculum was entirely removed by washing 4 h after infection, VSV-G-pseudotyped,vif-positive NL4.3-infected CEM cells underwent identical washing at 30 min after infection (control). Means for six replicates are presented; error bars represent standard deviations. The decrease in percent p24 production from thevif-deleted virus, relative to thevif-positive virus, in CEM cells was significant (P⫽0.0022, Mann-Whitney U). Below the graph are immunoblots of infected cell lysates stained with anti-A3G, anti--tubulin, and anti-p24 antibodies, respectively, in the upper, middle, and lower panels. Lanes 1, lysates from NL4.3-infected CEM cells. Lanes 2, lysates from⌬vifNL4.3-infected CEM cells. Lane 3, lysates fromvif-null NL4.3 infected CEM cells. (B) The graph in the upper portion shows percent virus production at 24 h postinfection from single-round infections of cells with replication-competent, CXCR4-tropic HIV-1 Env⫹viruses. Three different HIV-1env⫹ viruses were compared using CEM cells:vif-positive NL4.3,⌬vifNL4.3, andvif-null NL4.3 (see text). Means from six replicates are presented; error bars represent standard deviations. The decrease in percent p24 release from thevif-deleted viruses, relative to thevif-positive virus, was significant (P⫽0.005 in both cases, Mann-Whitney U). (C) The table shows that the amount of HIV-1 p24 antigen in cell lysates and pelleted supernatant fluids as well as the total p24 production from Vif-negative NL4.3-infected cells as a percentage of that from Vif-positive NL4.3 infected cells. Significant decreases were seen in supernatant p24 antigen amounts and the percentage of total p24 production from CEM cells infected with⌬vifNL4.3, relative to NL4.3. Asterisks indicate significant differences in the percentage of total HIV-1 p24 antigen production (Mann Whitney U, values given in panels A and B). There is a significant difference in absolute supernatant p24 levels between Vif-positive control and Env⫺⌬vifNL4.3 (P⫽0.005, Mann-Whitney U) and also between the Env⫹Vif-positive control and the Env⫹viruses⌬vifNL4.3 andvif-null NL4.3 (P⫽0.002 and 0.003, respectively, Mann-Whitney U). (D) Ultracentrifugation fractions of CEM cell lysates from the experiment in panel B are shown. Thevif-positive virus (lanes 1 and 2) depleted A3G in the pellet (P, where A3G complexes fractionate) as well as the supernatant (S) fractions. Lanes 3 and 4 are⌬vifNL4.3, and lanes 5 and 6 arevif-null NL4.3. A Coomassie blue-stained gel showed equivalent protein loading in all lanes (not shown).
on November 7, 2019 by guest
http://jvi.asm.org/
shRNA knockdown of RCK/p54 abrogates formation of
P-bodies and A3G complexes.Others have shown that
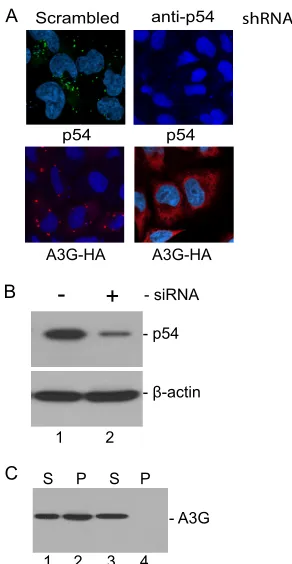
knock-down of RCK/p54, Lsm1, or Ago2 in 293T cells disrupts P-bodies and prevents A3G complex formation with subsequent transfection of an A3G expression vector (33). We sought to confirm that this also occurred with RCK/p54 knockdown in HeLa cells. Figure 6A shows confocal microscopy images of HeLa cells transfected on 2 subsequent days with scrambled control shRNA (Fig. 6A, left column) or with an RCK/p54-specific shRNA (Fig. 6A, right column). An A3G-HA expres-sion plasmid was cotransfected with the second shRNA (Fig. 6A, both columns). Anti-RCK/p54 antibody staining shows the presence of the P-body structural component RCK/p54 after
scrambled control shRNA (Fig. 6A, upper panel, left column), but not after RCK/p54-specific shRNA (Fig. 6A, upper panel, right column). The lower row shows that A3G complexes were also not detected after A3G-HA was cotransfected during the second RCK/p54-specific shRNA transfection; only diffuse cy-toplasmic A3G-HA is seen (Fig. 6A, lower panel, right col-umn). Immunoblotting confirmed p54 knockdown (Fig. 6B) and lack of A3G-HA in the cell lysate ultracentrifuge pellet fraction after RCK/p54-specific shRNA transfection (Fig. 6C, lane 4). A3G-HA was present only in the supernatant fraction in ultracentrifuged cell lysates after RCK/p54-specific shRNA treatment (Fig. 6C, lane 3) and in both fractions after scram-bled shRNA treatment (Fig. 6C, lanes 1 and 2).
Lack of A3G complex formation reverses the decrease in
HIV-1 production.We tested whether loss of A3G complex
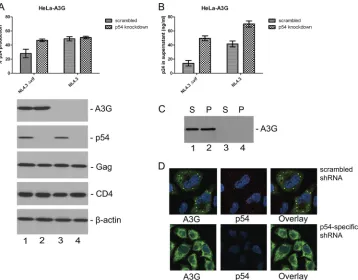
formation by knockdown of RCK/p54 would reverse the de-creased HIV-1 production associated with A3G complexes. We infected HeLa-A3G cells (HeLa cells that constitutively express A3G) with HIV-1 NL4.3⌬vifafter transfection with CD4 and either scrambled or RCK/p54-specific shRNAs. HeLa-A3G cells infected with NL4.3 ⌬vif after RCK/p54 knockdown produced about 50% more virus than was pro-duced from control scrambled shRNA-treated HeLa-A3G cells infected with NL4.3⌬vif(Fig. 7A, two bars on the left) (Mann-Whitney U,P⫽ 0.0004). There was no difference in Vif-positive, HIV-1 NL4.3 virus production from HeLa-A3G cells transfected with the control versus RCK/p54-specific shRNAs (Fig. 7A, two bars on the right). The nonnucleoside reverse transcriptase inhibitor efavirenz (EFV) was used in all infections to limit infection to a single round.
Immunoblots of cell lysates showed that the HeLa-A3G cells infected with NL4.3⌬vifand either transfected with scrambled (lane 1) or RCK/p54-specific (lane 2) shRNAs both contained A3G (Fig. 7A, upper panel below graph, lanes 1 and 2). How-ever, A3G was not detected in Vif-positive, HIV-1 NL4.3 virus-infected cells transfected with either shRNA (Fig. 7A, upper panel below graph, lanes 3 and 4). RCK/p54 was decreased by the RCK/p54-specific, and not the scrambled, shRNA in cells infected with either virus (Fig. 7A, second panel below graph). Gag immunoreactivity was equivalent in each infection (Fig. 7A, third panel below graph). Anti-CD4 staining showed equivalent HIV-1 receptor protein levels in cells (Fig. 7A, fourth panel below graph). Anti--actin staining indicated equivalent amounts of protein loading (Fig. 7A, bottom panel below graph). HIV-1 NL4.3⌬vif-infected HeLa-A3G cells con-tained A3G in both pellet and supernatant ultracentrifuge fractions; the pellet fraction indicates the presence of A3G complexes (Fig. 7C, lane 1, supernatant, and lane 2, pellet). No endogenous A3G was detected in either the ultracentrifuge pellet or supernatant fraction of HeLa-A3G cells infected by Vif-positive, wild-type NL4.3 (Fig. 7C, lane 3, supernatant, and lane 4, pellet). In addition, transfection of RCK/p54-specific shRNA, and not scrambled shRNA, again led to diffuse stain-ing of endogenous A3G throughout the cytoplasm in HeLa-A3G cells and no evidence of HeLa-A3G complexes by confocal microscopy (Fig. 7D).
[image:9.585.88.234.67.349.2]Others have reported that A3G decreased absolute super-natant p24 levels whether RCK/p54 or Lsm-1 were knocked down or not (6). Similar results, and the finding that RCK/p54 FIG. 6. shRNA knockdown of RCK/p54 abrogates formation of
P-bodies and A3G complexes. (A) HeLa cells were transfected with either scrambled (left column) or p54-specific (right column) shRNA-expressing vectors on days 1 and 2 after plating. Upper row shows antibody staining for endogenous p54 on day 1 after second transfec-tion. Lower panel shows that anti-HA staining detected only diffuse cytoplasmic staining, and no evidence of A3G complexes, 1 day after A3G-HA was cotransfected during the second p54-specific shRNA transfection. (B) Cells used in panel A, upper row, were lysed on day 1 after second transfection and subjected to Western blot analysis to show the degree of p54 knockdown. Cells transfected with scrambled shRNA are in lane 1 and cells transfected with p54-specific shRNA in lane 2.-actin staining is depicted in the lower panel as a loading control. (C) Lysates from cells used in lower panel A, were subjected to ultracentrifugation to separate the A3G complex-containing frac-tion (pellet; P) from the fracfrac-tion not containing complexes (superna-tant; S). Fractions were immunoblotted with an anti-HA antibody. Ultracentrifuge fractions from cells cotransfected on day 2 with scram-bled shRNA and A3G-HA are in lanes 1 and 2, and those from cells cotransfected on day 2 with p54-specific shRNA and A3G-HA are in lanes 3 and 4. A3G is absent from the pellet fraction in lane 4 and is present only in the supernatant fraction in lane 3, in which cells were transfected with p54-specific shRNAs.
on November 7, 2019 by guest
http://jvi.asm.org/
knockdown increased supernatant p24 levels in the presence and absence of A3G, are noted here (Fig. 7B).
HeLa cells that contain no endogenous A3G were also trans-fected with CD4 and either of the two shRNAs prior to infec-tion with NL4.3 or NL4.3⌬vifto serve as an additional control. Production of Vif-positive and Vif-negative HIV-1 did not differ with RCK/p54 knockdown that causes loss of P-bodies in these cells that lack A3G expression (data not shown). This corroborates Vif-positive HIV-1 infection of HeLa-A3G cells (Fig. 7A, right panel) as evidence that reversal of the decrease in HIV-1 NL4.3 ⌬vifproduction by RCK/p54 knockdown is specific for the loss of A3G complexes.
DISCUSSION
Much of the cytoplasmic A3G in HIV-1 host T cell lines and activated primary T-lymphocytes is present in cytoplasmic
A3G complexes. A3G complexes have been implicated in A3G’s inhibitory effects against retrotransposons (8, 18). A3G and RNA granules have also been reported to play a role in retrotransposon assembly (2, 12). This led us to explore whether there was a functional effect of A3G complexes on HIV-1 replication. Our results demonstrate that cytoplasmic A3G complexes can decrease HIV-1 virion production in a physiological system.
We found, as other have reported, that A3G complexes partially colocalized with different markers for RNA granules. This included partially associating with stress granules when the latter were present (8, 14, 15, 23, 30). We also identified colocalization of A3G complexes with the CD63 marker of late endosomes (Fig. 1C) and with HIV-1 p24 antigen (Fig. 2). These findings lead us to conclude that A3G complexes are dynamic and may not be exclusively localized to a single RNA granule/cytoplasmic compartment. Earlier reports also indi-FIG. 7. Lack of A3G complex formation reverses the decrease in HIV-1 production. (A) The graph shows percent p24 production from HeLa-A3G cells (that stably express A3G) that were transfected with CD4 and either scrambled or RCK/p54-specific shRNAs. These transfected cells were then infected with either NL4.3⌬vifthat cannot degrade A3G (left bars) or wild-type NL4.3 HIV that degrades A3G (right bars). There was a significant difference in NL4.3⌬vifvirus production between cells transfected with scrambled versus RCK/p54-specific shRNA vectors (Mann-Whitney,P⬍0.0004); the RCK/p54-specific shRNA reversed the decreased HIV-1 NL4.3⌬vifproduction associated with A3G complexes. There was no significant difference in wild-type NL4.3 production (which degrades A3G) from cells with scrambled versus p54-specific shRNAs. In the panels below the graph, cell lysates were analyzed by Western blotting to detect A3G (top), RCK/p54 (second from top), Gag (p24) (third from top), CD4 (second from bottom), and-actin (bottom; control for equivalent protein loading). A3G was present in NL4.3⌬vif-infected cells (lanes 1 and 2) and not in cells infected with wild-type NL4.3 (vifpositive) (lanes 3 and 4). RCK/p54 was detected in cells receiving scrambled shRNAs (lanes 1 and 3) and not in cells transfected with p54-specific shRNAs (lanes 2 and 4). Gag, CD4, and actin were detected equivalently in all four lanes, indicating similar infection levels and protein loading across the different cell/virus combinations. Each condition showed similar cell viability (not shown). (B) Levels of p24 from the pelleted supernatants from the experiment in panel A. (C) Cell lysates from CD4-expressing HeLa-A3G cells infected with either NL4.3⌬vifor wild-type NL4.3 were subjected to ultracentrifugation to separate the fraction containing A3G complexes (pellet; P) from the fraction containing noncomplexed A3G (supernatant; S). Lanes 1 and 2 are cells infected with NL4.3⌬vif, and lanes 3 and 4 are cells infected with wild-type NL4.3 that contains an intactvifgene that is capable of degrading A3G. A3G was completely depleted from cells by Vif. A3G complexes were present in pellet in NL4.3⌬vif-infected cells. (D) Images of HeLa-A3G cells transfected with either scrambled shRNA control (top row) or p54-specific shRNA (bottom row). Cells were fixed and stained for endogenous A3G and RCK/p54.
on November 7, 2019 by guest
http://jvi.asm.org/
[image:10.585.113.471.68.348.2]cated that A3G’s cytoplasmic location changes over time and that it may traffic between compartments/RNA granules (5, 7, 12, 14, 21, 23, 30, 49). There is also consensus that there is dynamism among RNA granules and that they may exchange many of their components (32, 45).
The C97A mutation in the amino-terminal zinc coordination site of A3G had been shown previously to reduce homomulti-merization and to cause more diffuse localization throughout the cytoplasm at 24 h after transfection (36). However, some high-molecular-mass complexes were seen on fast-perfor-mance liquid chromatography (FPLC), albeit relatively less of the highest-mass complexes than were seen with wild-type A3G (36). We extended knowledge about the C97A A3G mutant by characterizing two time points (24 and 48 h after transfection). C97A A3G did not form complexes at 24 h, based on microscopy or ultracentrifugation analysis (Fig. 3) here or in earlier work by others (36). However, there was at least some complex formation by both measures at 48 h noted here (not shown). These results indicate that C97A complex formation is delayed and/or less complete than that seen for the other A3G variants studied here (wild type, Y124A, Y127A, and D128K), which is consistent with the earlier report (36).
We compared HIV-1 pseudovirus production from cells lacking A3G complexes (cells lacking A3G and cells expressing C97A A3G at 24 h after transfection) versus cells containing A3Gs that formed complexes at 24 h (wild-type and Y124A A3G). The presence of complexes was associated with de-creased pseudovirus production. The lack of increase in intra-cellular p24 levels in cells with wild-type or Y124A A3G, rel-ative to that in the no-A3G control or the C97A A3G (Fig. 4B), was not consistent with an effect of A3G complexes only on release of virions from the cell. In addition, the decreased total p24 levels (e.g., the sum of intracellular and extracellular lev-els) seen with either wild-type or Y124A A3G, relative to those for the no-A3G control and C97A A3G, suggested increased degradation of p24 in the presence of complexes. Since cyclo-heximide did not affect A3G complex formation, we evaluated the levels of intracellularly retained Gag over time after pro-tein synthesis was inhibited by cycloheximide. Intracellularly retained Gag was turned over more rapidly in cells with A3G complexes than in cells without A3G complexes.
The levels of wild-type A3G in transfected cells studied here were not higher than seen in a T cell line (CEM) or activated primary CD4⫹ T lymphocytes (Fig. 4D). However, we also studied enveloped virus infection of cells physiologically ex-pressing endogenous A3G to confirm that A3G complexes decreased HIV-1 production. It has been clearly established that Vif degrades A3G, and we confirmed that the CEM cells infected with Vif-negative viruses contained A3G, while those infected with Vif-positive virus did not. Therefore, we com-pared negative virus production from CEM cells with Vif-positive virus production from those same cells. Figure 5 shows that CEM cells, containing physiological levels of endogenous A3G, produced significantly less negative virus than Vif-positive virus (2- to 3-fold less).
In contrast to the results from CEM cells, there was no difference in production of the same negative versus Vif-positive viruses from CEM-SS cells that lack endogenous A3G. It is important to note that we do not directly compare
Vif-negative virus replication levels in CEM versus CEM-SS cells. This comparison may not be valid, because these cells have had many passages in different laboratories and may differ in un-characterized ways other than just the lack of A3G.
Vif may deplete other APOBEC3 protein family members as well as A3G, if they are present. Therefore, this approach is not as specific for A3G as would be RNA silencing of only A3G. However, our laboratory has had technical difficulties with A3G knockdown in some cell types. We have seen poor viability of primary human Th1 lymphocytes transfected with either A3G-specific shRNA or small interfering RNA (siRNA) constructs. Nucleofection also reduced cell viability in our hands. Decreased cell viability would confound evaluation of effects on virus production and was therefore not undertaken here.
RNA silencing of other relevant proteins does not have these technical problems in our hands. RCK/p54 knockdown abrogates both P-body and A3G complex formation and leads to A3G being diffusely present throughout the cytoplasm. This allows specific study of the effect of A3G complexes on HIV-1 production, as A3G becomes only diffusely localized in the cytoplasm. This is an advantage to A3G knockdown, which would deplete all A3G from the cell and not differentiate the effect of A3G complexes from an effect of other forms of A3G. Cells containing A3G complexes produced less Vif-negative virus than the same cells lacking A3G complexes and still containing diffuse cytoplasmic A3G because of RCK/p54 knockdown. In the latter approach, the effect of RCK/p54 knockdown to increase HIV-1 production, defined as the per-centage of total p24 in the supernatant fluid pellet, was seen only in cells containing A3G. Vif-positive virus production from HeLA-A3G cells, and both Vif-negative and Vif-positive virus production from HeLa cells (lacking A3G), did not differ with RCK/p54 knockdown. This indicates that in the absence of A3G, loss of RNA granules did not cause decreased p24 production. Production of p24 from Vif-negative infection was decreased only from HeLa-A3G cells and not from HeLa cells. Moreover, and consistent with an earlier report that first pre-sented evidence that P-bodies and A3G had separate effects on HIV-1 release from cells, RCK/p54 knockdown did increase absolute supernatant HIV-1 p24 antigen levels whether or not A3G was present in the cell (Fig. 7B and Fig. 6 in reference 6). In addition, A3G decreased absolute supernatant p24 levels in the presence of both scrambled and RCK/p54-specific shRNA (Fig. 7B).
These data suggest the hypothesis that enhanced translation of HIV-1 RNA caused by loss of RNA granules in the absence of A3G increases Gag p24 protein synthesis and that there is a separate, independent effect of removal of A3G complexes. Perhaps this A3G effect differs because it is operative at the protein level rather than the RNA level. We hypothesize that A3G complexes may divert some intracellular p24 protein into a compartment in the cell from which it cannot be released and may be eventually degraded. Removal of A3G complexes from the cell is hypothesized to restore the ability of this additional component of still-detectable intracellular p24 protein to be released in virions, thereby increasing p24 levels in the super-natant (and the percentage of total p24 produced from the cell) above and beyond that caused by the increased translation
on November 7, 2019 by guest
http://jvi.asm.org/
seen with abrogation of P-bodies. This hypothesis requires critical testing in future work.
This work reveals a novel anti-HIV activity of A3G com-plexes within the producer cell and extends its characteriza-tion beyond what others noted earlier (6). The magnitude of this anti-HIV activity appears modest in these single-round replication experiments needed to isolate an effect in the producer cell from those of virion-packaged (and possibly target cell) A3G. However, multiple rounds of infection that occur in vivo may enhance the effect. Other APOBEC3s, such as APOBEC3F (14), may have similar activity as that characterized here for A3G. Some HIV-1 host cellsin vivo
may contain higher levels of APOBEC3s (48, 49). In addi-tion, NL4.3 Vif is relatively active in A3G degradation in
vitro, compared to some Vifs foundin vivo(44). Our results
raise the possibility of increasing cellular A3G expression to reduce virion output from producer cells, as well as the previously described antiviral mechanisms that diminish vi-rion infectivity and target cell infection. Further character-ization of the mechanisms of this effect of A3G in producer cells will illuminate both cellular and HIV-1 biology, partic-ularly mechanisms of posttranscriptional control of HIV-1 expression.
ACKNOWLEDGMENTS
The polyclonal anti-APOBEC3G antibody (NIH AIDS repository no. 9968), the p24 monoclonal antibody (NIH AIDS repository no. 3537), and HeLa-A3G cells (NIH AIDS repository no. 9907) were obtained through the AIDS Research and Reference Reagent Pro-gram, Division of AIDS, NIAID, NIH. Antisera against human Staufen was a kind gift from Luc DesGroseillers, Universite´ de Mon-tre´al. A3G-HA and A3G-YFP expression plasmids, the Gag-CFP ex-pression plasmid, and the MACANC Gag exex-pression plasmid were generously provided by Paul Spearman. Christopher Aiken provided some HIV-1 plasmids. We also appreciate the assistance and advice of Christopher Aiken, James Crowe, Terence Dermody, James Hildreth, Xinhong Dong, and Vasundhara Varthakavi.
This work was supported by NIH grants R01 AI29193 and T32 AI060571. Confocal microscopy was performed through the use of the VUMC Cell Imaging Shared Resource (supported by NIH grants CA68485, DK20593, DK58404, HD15052, DK59637, and EY08126).
We acknowledge the Vanderbilt University CFAR (P30 AI 54999) for providing biostatistical services, biosafety level 3 (BSL3) facilities, and the p24 antigen ELISA.
We thank John Donahue and Chisu Song for their critical reviews of the manuscript. We also appreciate Bryan Shepherd’s expert help with statistical analysis.
REFERENCES
1.Abudu, A., et al.2006. Murine retrovirus escapes from murine APOBEC3 via two distinct novel mechanisms. Curr. Biol.16:1565–1570.
2.Anderson, P., and N. Kedersha.2008. Stress granules: the Tao of RNA triage. Trends Biochem. Sci.33:141–150.
3.Bogerd, H. P., B. P. Doehle, H. L. Wiegand, and B. R. Cullen.2004. A single amino acid difference in the host APOBEC3G protein controls the primate species specificity of HIV type 1 virion infectivity factor. Proc. Natl. Acad. Sci. U. S. A.101:3770–3774.
4.Bogerd, H. P., H. L. Wiegand, B. P. Doehle, and B. R. Cullen.2007. The intrinsic antiretroviral factor APOBEC3B contains two enzymatically active cytidine deaminase domains. Virology364:486–493.
5.Burnett, A., and P. Spearman.2007. APOBEC3G multimers are recruited to the plasma membrane for packaging into human immunodeficiency virus type 1 virus-like particles in an RNA-dependent process requiring the NC basic linker. J. Virol.81:5000–5013.
6.Chable-Bessia, C., et al.2009. Suppression of HIV-1 replication by mi-croRNA effectors. Retrovirology6:26.
7.Chiu, Y. L., and W. C. Greene.2008. The APOBEC3 cytidine deaminases: an innate defensive network opposing exogenous retroviruses and endogenous retroelements. Annu. Rev. Immunol.26:317–353.
8.Chiu, Y. L., et al.2006. High-molecular-mass APOBEC3G complexes re-strict Alu retrotransposition. Proc. Natl. Acad. Sci. U. S. A. 103:15588– 15593.
9.Dang, Y., X. Wang, W. J. Esselman, and Y. H. Zheng.2006. Identification of APOBEC3DE as another antiretroviral factor from the human APOBEC family. J. Virol.80:10522–10533.
10.Derdowski, A., L. Ding, and P. Spearman.2004. A novel fluorescence res-onance energy transfer assay demonstrates that the human immunodefi-ciency virus type 1 Pr55Gag I domain mediates Gag-Gag interactions. J. Vi-rol.78:1230–1242.
11.Donahue, J. P., M. L. Vetter, N. A. Mukhtar, and R. T. D’Aquila.2008. The HIV-1 Vif PPLP motif is necessary for human APOBEC3G binding and degradation. Virology377:49–53.
12.Dutko, J. A., A. E. Kenny, E. R. Gamache, and M. J. Curcio.2010. 5⬘to 3⬘ mRNA decay factors colocalize with Ty1 gag and human APOBEC3G and promote Ty1 retrotransposition. J. Virol.84:5052–5066.
13.Fitzpatrick, K., et al.2010. Direct restriction of virus release and incorpo-ration of the interferon-induced protein BST-2 into HIV-1 particles. PLoS Pathog.6:e1000701.
14.Gallois-Montbrun, S., et al.2008. Comparison of cellular ribonucleoprotein complexes associated with the APOBEC3F and APOBEC3G antiviral pro-teins. J. Virol.82:5636–5642.
15.Gallois-Montbrun, S., et al.2007. Antiviral protein APOBEC3G localizes to ribonucleoprotein complexes found in P bodies and stress granules. J. Virol.
81:2165–2178.
16.Goffinet, C., S. Schmidt, C. Kern, L. Oberbremer, and O. T. Keppler.2010. Endogenous CD317/tetherin limits replication of HIV-1 and murine leuke-mia virus in rodent cells and is resistant to antagonists from primate viruses. J. Virol.84:11374–11384.
17.Groom, H. C., M. W. Yap, R. P. Galao, S. J. Neil, and K. N. Bishop.2010. Susceptibility of xenotropic murine leukemia virus-related virus (XMRV) to retroviral restriction factors. Proc. Natl. Acad. Sci. U. S. A.107:5166–5171. 18.Hulme, A. E., H. P. Bogerd, B. R. Cullen, and J. V. Moran.2007. Selective
inhibition of Alu retrotransposition by APOBEC3G. Gene390:199–205. 19.Huthoff, H., and M. H. Malim.2007. Identification of amino acid residues in
APOBEC3G required for regulation by human immunodeficiency virus type 1 Vif and virion encapsidation. J. Virol.81:3807–3815.
20.Jin, X., et al.2005. APOBEC3G/CEM15 (hA3G) mRNA levels associate inversely with human immunodeficiency virus viremia. J. Virol.79:11513– 11516.
21.Kedersha, N., et al.2005. Stress granules and processing bodies are dynam-ically linked sites of mRNP remodeling. J. Cell Biol.169:871–884. 22.Khan, M. A., et al.2005. Viral RNA is required for the association of
APOBEC3G with human immunodeficiency virus type 1 nucleoprotein com-plexes. J. Virol.79:5870–5874.
23.Kozak, S. L., M. Marin, K. M. Rose, C. Bystrom, and D. Kabat.2006. The anti-HIV-1 editing enzyme APOBEC3G binds HIV-1 RNA and messenger RNAs that shuttle between polysomes and stress granules. J. Biol. Chem.
281:29105–29119.
24.Kulkarni, M., S. Ozgur, and G. Stoecklin.2010. On track with P-bodies. Biochem. Soc. Trans.38:242–251.
25.Kuroishi, A., K. Bozek, T. Shioda, and E. E. Nakayama.2010. A single amino acid substitution of the human immunodeficiency virus type 1 capsid protein affects viral sensitivity to TRIM5 alpha. Retrovirology7:58.
26.Lian, S., et al. 2007. Small interfering RNA-mediated silencing induces target-dependent assembly of GW/P bodies. Mol. Biol. Cell18:3375–3387. 27.Liddament, M. T., W. L. Brown, A. J. Schumacher, and R. S. Harris.2004.
APOBEC3F properties and hypermutation preferences indicate activity against HIV-1 in vivo. Curr. Biol.14:1385–1391.
28.Low, A., C. M. Okeoma, N. Lovsin, M. de las Heras, T. H. Taylor, B. M. Peterlin, S. R. Ross, and H. Fan.2009. Enhanced replication and pathogen-esis of Moloney murine leukemia virus in mice defective in the murine APOBEC3 gene. Virology385:455–463.
29.Luo, K., et al.2007. Cytidine deaminases APOBEC3G and APOBEC3F interact with human immunodeficiency virus type 1 integrase and inhibit proviral DNA formation. J. Virol.81:7238–7248.
30.Marin, M., S. Golem, K. M. Rose, S. L. Kozak, and D. Kabat.2008. Human immunodeficiency virus type 1 Vif functionally interacts with diverse APOBEC3 cytidine deaminases and moves with them between cytoplasmic sites of mRNA metabolism. J. Virol.82:987–998. 31.Mehle, A., et al. 2004. Vif overcomes the innate antiviral activity of
APOBEC3G by promoting its degradation in the ubiquitin-proteasome pathway. J. Biol. Chem.279:7792–7798.
32.Moser, J. J., and M. J. Fritzler.2010. Cytoplasmic ribonucleoprotein (RNP) bodies and their relationship to GW/P bodies. Int. J. Biochem. Cell Biol.
42:828–843.
33.Nathans, R., et al.2009. Cellular microRNA and P bodies modulate host-HIV-1 interactions. Mol. Cell34:696–709.
34.Niewiadomska, A. M., and X. F. Yu.2009. Host restriction of HIV-1 by APOBEC3 and viral evasion through Vif. Curr. Top. Microbiol. Immunol.
339:1–25.
35.Okeoma, C. M., J. Petersen, and S. R. Ross.2009. Expression of murine
on November 7, 2019 by guest
http://jvi.asm.org/
APOBEC3 alleles in different mouse strains and their effect on mouse mammary tumor virus infection. J. Virol.83:3029–3038.
36.Opi, S., et al. 2007. Human immunodeficiency virus type 1 Vif inhibits packaging and antiviral activity of a degradation-resistant APOBEC3G vari-ant. J. Virol.81:8236–8246.
37.Opi, S., et al.2006. Monomeric APOBEC3G is catalytically active and has antiviral activity. J. Virol.80:4673–4682.
38.Pace, C., et al.2006. Population level analysis of human immunodeficiency virus type 1 hypermutation and its relationship with APOBEC3G andvif genetic variation. J. Virol.80:9259–9269.
39.Pion, M., et al.2006. APOBEC3G/3F mediates intrinsic resistance of mono-cyte-derived dendritic cells to HIV-1 infection. J. Exp. Med.203:2887–2893. 40.Reed, S. E., E. M. Staley, J. P. Mayginnes, D. J. Pintel, and G. E. Tullis.2006. Transfection of mammalian cells using linear polyethylenimine is a simple and effective means of producing recombinant adeno-associated virus vec-tors. J. Virol. Methods138:85–98.
41.Refsland, E. W., et al.2010. Quantitative profiling of the full APOBEC3 mRNA repertoire in lymphocytes and tissues: implications for HIV-1 re-striction. Nucleic Acids Res.38:4274–4284.
42.Schrofelbauer, B., D. Chen, and N. R. Landau.2004. A single amino acid of APOBEC3G controls its species-specific interaction with virion infectivity factor (Vif). Proc. Natl. Acad. Sci. U. S. A.101:3927–3932.
43.Sheehy, A. M., N. C. Gaddis, J. D. Choi, and M. H. Malim.2002. Isolation of a human gene that inhibits HIV-1 infection and is suppressed by the viral Vif protein. Nature418:646–650.
44.Simon, V., et al. 2005. Natural variation in Vif: differential impact on APOBEC3G/3F and a potential role in HIV-1 diversification. PLoS Pathog.
1:e6.
45.Thomas, M. G., M. Loschi, M. A. Desbats, and G. L. Boccaccio.2011. RNA granules: the good, the bad and the ugly. Cell. Signal.23:324–334. 46.Varthakavi, V., R. M. Smith, S. P. Bour, K. Strebel, and P. Spearman.2003.
Viral protein U counteracts a human host cell restriction that inhibits HIV-1 particle production. Proc. Natl. Acad. Sci. U. S. A.100:15154–15159. 47.Varthakavi, V., et al.2006. The pericentriolar recycling endosome plays a key
role in Vpu-mediated enhancement of HIV-1 particle release. Traffic7:298– 307.
48.Vetter, M. L., and R. T. D’Aquila.2009. Cytoplasmic APOBEC3G restricts incoming Vif-positive human immunodeficiency virus type 1 and increases two-long terminal repeat circle formation in activated T-helper-subtype cells. J. Virol.83:8646–8654.
49.Vetter, M. L., M. E. Johnson, A. K. Antons, D. Unutmaz, and R. T. D’Aquila.
2009. Differences in APOBEC3G expression in CD4⫹T helper lymphocyte subtypes modulate HIV-1 infectivity. PLoS Pathog.5:e1000292.
50.Wasserman, T., et al.2010. A novel c-Jun N-terminal kinase (JNK)-binding protein WDR62 is recruited to stress granules and mediates a nonclassical JNK activation. Mol. Biol. Cell21:117–130.
51.Wehrly, K., and B. Chesebro.1997. p24 antigen capture assay for quantifi-cation of human immunodeficiency virus using readily available inexpensive reagents. Methods12:288–293.
52.Wichroski, M. J., K. Ichiyama, and T. M. Rana.2005. Analysis of HIV-1 viral infectivity factor-mediated proteasome-dependent depletion of APOBEC3G: correlating function and subcellular localization. J. Biol. Chem.280:8387–8396.
53.Xu, H., et al.2004. A single amino acid substitution in human APOBEC3G antiretroviral enzyme confers resistance to HIV-1 virion infectivity factor-induced depletion. Proc. Natl. Acad. Sci. U. S. A.101:5652–5657. 54.Yu, Y., Z. Xiao, E. S. Ehrlich, X. Yu, and X. F. Yu.2004. Selective assembly
of HIV-1 Vif-Cul5-ElonginB-ElonginC E3 ubiquitin ligase complex through a novel SOCS box and upstream cysteines. Genes Dev.18:2867–2872. 55.Zeitelhofer, M., P. Macchi, and R. Dahm.2008. Perplexing bodies: the
putative roles of P-bodies in neurons. RNA Biol.5:244–248.
56.Zennou, V., D. Perez-Caballero, H. Gottlinger, and P. D. Bieniasz.2004. APOBEC3G incorporation into human immunodeficiency virus type 1 par-ticles. J. Virol.78:12058–12061.
57.Zheng, Y. H., et al.2004. Human APOBEC3F is another host factor that blocks human immunodeficiency virus type 1 replication. J. Virol.78:6073– 6076.
58.Zufferey, R., D. Nagy, R. J. Mandel, L. Naldini, and D. Trono.1997. Multiply attenuated lentiviral vector achieves efficient gene delivery in vivo. Nat. Biotechnol.15:871–875.