“EVALUATION OF MAXIMUM BITE FORCE IN PATIENTS
REHABILITATED WITH COMPLETE DENTURE PROSTHESIS
- AN IN VIVO STUDY”
A Dissertation submitted to
THE TAMILNADU DR. MGR MEDICAL UNIVERSITY
In partial fulfillment of the requirements for the degree of
MASTER OF DENTAL SURGERY
(BRANCH – I)
(PROSTHODONTICS AND CROWN & BRIDGE)
Certificate
This is to certify that Dr. S.SRIVIDHYA, Post Graduate student (2014 - 2017) in the Department of Prosthodontics and Crown and Bridge, has done this
dissertation titled “EVALUATION OF MAXIMUM BITE FORCE IN
PATIENTS REHABILITATED WITH COMPLETE DENTURE
PROSTHESIS - AN IN VIVO STUDY” under my direct guidance and supervision
in partial fulfillment of the regulations laid down by The Tamil Nadu Dr. M.G.R.
Medical University, Guindy, Chennai – 32 for M.D.S. in Prosthodontics and
Crown & Bridge (Branch I) Degree Examination.
Guided by Head of the institution
Prof.Dr.C.SABARIGIRINATHAN. M.D.S., Prof.Dr. B.SARAVANAN. M.D.S.,Ph.D
Head of the Department PRINCIPAL
Department of Prosthodontics, Tamil Nadu Govt Dental College
Tamilnadu Govt Dental College and Hospital, Chennai - 600 003.
DECLARATION
I, Dr.S.SRIVIDHYA do hereby declare that the dissertation titled “EVALUATION
OF MAXIMUM BITE FORCE IN PATIENTS REHABILITATED WITH
COMPLETE DENTURE PROSTHESIS - AN IN VIVO STUDY” was done in the
Department Of Prosthodontics, Tamil Nadu Government Dental College & Hospital,
Chennai 600 003. I have utilized the facilities provided in the Government Dental
College for the study in partial fulfilment of the requirements for the degree of
Master of Dental Surgery in the speciality of Prosthodontics and Crown & Bridge
(Branch I) during the course period 2014-2017 under the conceptualization and
guidance of my dissertation guide, Prof. Dr. C. SABARIGIRINATHAN.M.D.S.
I declare that no part of the dissertation will be utilized for gaining financial
assistance for research or other promotions without obtaining prior permission from
the Tamil Nadu Government Dental College & Hospital.
I also declare that no part of this work will be published either in the print or
electronic media except with those who have been actively involved in this
dissertation work and I firmly affirm that the right to preserve or publish this work
rests solely with the prior permission of the Principal, Tamil Nadu Government
Dental College & Hospital, Chennai 600 003, but with the vested right that I shall be
cited as the author(s).
Signature of the PG student Signature of the HOD
TRIPARTITE AGREEMENT
This agreement herein after the “Agreement” is entered into on this day,
December 23, 2016 between the Tamil Nadu Government Dental College and
Hospital represented by its Principal having address at Tamil Nadu Government
Dental College and Hospital, Chennai-3, (hereafter referred to as, ‘the College’)
And
Prof. Dr. C. SABARIGIRINATHAN.M.D.S., aged 50 years working as
Professor and Head of Department of Prosthodontics and Crown and Bridge at Tamil
Nadu Government Dental College and Hospital, Chennai-3 having residence address
at E/32, Anna Nagar (East), Chennai- 102 (herein after referred to as the ‘Researcher
and Principal investigator’)
And
Dr. S. SRIVIDHYA aged 28 years currently studying as Post Graduate
student in the Department of Prosthodontics and Crown & Bridge, Tamil Nadu
Government Dental College and Hospital, Chennai-3 (herein after referred to as the
‘PG/Research student and Co- investigator’).
Whereas the ‘PG/Research student as part of her curriculum undertakes to
research on the study titled “EVALUATION OF MAXIMUM BITE FORCE IN
PATIENTS REHABILITATED WITH COMPLETE DENTURE PROSTHESIS
- AN IN VIVO STUDY” for which purpose the Researcher and Principal investigator
shall act as Principal investigator and the College shall provide the requisite
infrastructure based on availability and also provide facility to the PG/Research
student as to the extent possible as a Co-investigator
Whereas the parties, by this agreement have mutually agreed to the various
issues including in particular the copyright and confidentiality issues that arise in this
regard. Now this agreement witnesseth as follows:
1. The parties agree that all the research material and ownership therein shall
become the vested right of the college, including in particular all the copyright
in the literature including the study, research and all other related papers.
2. To the extent that the College has legal right to do go, shall grant to licence or
assign the copyright do vested with it for medical and/or commercial usage of
interested persons/entities subject to a reasonable terms/conditions including
royalty as deemed by the college.
3. The royalty so received by the college shall be equally by all the parties.
4. The PG/Research student and PG/Principal Investigator shall under no
circumstances deal with the copyright, confidential information and know how
generated during the course of research/study in any manner whatsoever,
while shall sole vest with the manner whatsoever and for any purpose without
the express written consent of the college.
5. All expenses pertaining to the research shall be decided upon by the Principal
investigator/Co-investigator or borne sole by the PG/Research student
(Co-investigator).
6. The College shall provide all infrastructure and access facilities within and in
other institutes to the extent possible. This includes patient interactions,
introductory letters, recommendation letters and such other acts required in
this regard.
7. The principal investigator shall suitably guide the student research right from
selection and conduct of research, topic and area research by the student
researcher under guidance from the principal investigator shall be subject to
the prior approval, recommendations and comments of the Ethical Committee
of the college constituted for this purpose.
8. It is agreed that as regards other aspects not covered under this agreement, but
which pertain to the research undertaken by the Student Researcher, under
guidance from the Principal Investigator, the decision of the college shall be
binding and final.
9. If any dispute arises as to the matters related or connected to this agreement
herein, it shall be referred to arbitration in accordance with the provisions of
the Arbitration and Conciliation Act, 1996.
In witness whereof the parties herein above mentioned have on this the
day month and year herein above mentioned set their hands to this agreement
in the presence of the following two witnesses.
College represented by its Principal Student Guide
Witnesses PG Student
1.
2.
ACKNOWLEDGEMENT
I am extremely thankful to my chief Dr. C. SABARIGIRINATHAN, M.D.S.,
Professor and Head of the Department and my Guide, Department of Prosthodontics,
Tamil Nadu Government Dental College and Hospital, Chennai. I consider it my
utmost privilege and honor to express my most sincere and heartfelt gratitude to my
esteemed chief and guide for his wholehearted support, constant guidance, help,
encouragement, valuable suggestions and support he has rendered at various stages of
the dissertation. I also thank him for the valuable guidance; he has given throughout
my post graduation. Without his immense help this dissertation would not have come
out in a befitting manner.
My sincere thanks to Prof. Dr. B. SARAVANAN, M.D.S., PhD, Principal,
Tamil Nadu Government Dental College and Hospital for his kind help, valuable
suggestions in this study and permitting me to use all the facilities in the institution. I
also thank him for the valuable guidance he has given throughout the period of my
post graduate course.
My sincere thanks to Dr. A. MEENAKSHI, M.D.S., Professor, Department of
Prosthodontics, Tamilnadu Government Dental College and Hospital for her valuable
guidance throughout my study.
My sincere thanks to Dr. K. VINAYAGAVEL, M.D.S., Professor, Department
of Prosthodontics, Tamilnadu Government Dental College and Hospital for his
valuable guidance throughout my study.
My sincere thanks to Dr.P.RUPKUMAR M.D.S., Associate Professor, for
I am thankful to Dr.G.Sriramaprabu, M.D.S., Dr.M.Rajakumar, M.D.S.,
Associate Professors, for guiding and helping me at different stages of this study.
I am thankful to Senior Assistant Professor Dr.T.Jeyanthikumari,M.D.S.,
Assistant Professors, Dr.S.Vinayagam,M.D.S., Dr.J.Gandhimathi,M.D.S.,
Dr.V.Parimala,M.D.S., Dr.M.Kanmani,M.D.S., Dr.V.Harishnath,M.D.S.,
Dr.Preethi Chandran,M.D.S., and Dr.SivaSakthiKumar,M.D.S., for helping me at
different stages of this study.
I thank Dr.Mohammed Junaith.M.D.S., for helping me to carry out the statistical
analysis of the various test results.
A special thanks to my husband Dr.S.Sathish M.D.S., my in-laws , my parents and
my brother for their constant support and motivation.
I owe my sincere thanks to all my Colleagues, Senior and Junior postgraduates
in the department for their constant encouragement and timely help.
Above all I thank the LORD GOD ALMIGHTY for giving me the strength and
LIST OF CONTENTS
SL NO. TITLE PAGE
NO.
1. INTRODUCTION 1
2. AIM AND OBJECTIVES 4
3. REVIEW OF LITERATURE 5
4. MATERIALS AND
METHODS
14
5. RESULTS 24
6. DISCUSSION 54
7. SUMMARY & CONCLUSION 67
LIST OF ABBREVIATIONS
SL.NO ABBREVIATIONS
1 MBF- Maximum Bite Force
2 EMG- Electromography
3 lbs-Pounds
4 BMI-Body Mass Index
LIST OF PHOTOGRAPHS
SL.NO PHOTOGRAPHS
1 Armamentarium for clinical examination
2 Armamentarium for study models and complete
denture fabrication
3 Square Facial Form
4 Square tapered Facial Form
5 Tapered Facial Form
6 Ovoid Facial Form
7 Square Arch Form
8 Tapered Arch Form
9 Ovoid Arch Form
10 Bite Force Sensor
LIST OF TABLES
S.NO TABLES PAGE
NO
1 Comparison of mean bite force between different facial forms in the subgroups by Descriptive statistics
24
2 Comparison of mean bite force in different facial forms
between and within the subgroups by One way ANOVA test 25
3 Multiple comparison of mean bite force between different
facial forms in dentulous male using Tukey HSD-post hoc test 26
4
Multiple comparison of mean bite force between different facial forms in dentulous female using Tukey HSD-post hoc test
27
5
Multiple comparison of mean bite force between different facial forms in edentulous male using Tukey HSD-post hoc test
28
6
Multiple comparison of mean bite force between different facial forms in edentulous female using Tukey HSD -post hoc test
29
7
Comparison of mean bite force between different arch forms for the respective facial forms in edentulous male by Descriptive statistics
30
8 Comparison of mean bite force between and within facial
forms in edentulous male by One way ANOVA test 31
9
Multiple comparison of mean bite force between different arch forms for the respective facial forms in edentulous male
by Tukey HSD -post hoc test 32
10
Comparison of mean bite force between different arch forms for the respective facial forms in edentulous female by
Descriptive statistics 33
11 Comparison of mean bite force between and within facial
forms in edentulous female by One way ANOVA test 34
12
Multiple comparison of mean bite force between different arch forms for the respective facial forms in edentulous
13
Comparison of mean bite force between different arch forms for the respective facial forms in dentulous male by Descriptive statistics
36
14
Comparison of mean bite force between and within facial forms in dentulous male by One way ANOVA test
37
15
Multiple comparison of mean bite force between different arch forms for the respective facial forms in dentulous male
by Tukey HSD-post hoc test 38
16
Comparison of mean bite force between different arch forms for the respective facial forms in dentulous female by
Descriptive statistics 39
17
Comparison of mean bite force between and within facial
forms in dentulous female by One way ANOVA test 40
18
Multiple comparison of mean bite force between different arch forms for the respective facial forms in dentulous female by Tukey HSD-post hoc test
41
19
Gender comparison of mean bite force for edentulous subjects
by Group statistics and Independent samples t Test 42
20
Gender comparison of bite force for dentulous subjects by
Group statistics and Independent samples t Test 43
21
Bite force comparison between dentulous and edentulous
male by Group statistics and Independent samples t Test 44
22
Bite force comparison between dentulous and edentulous
LIST OF BAR DIAGRAMS
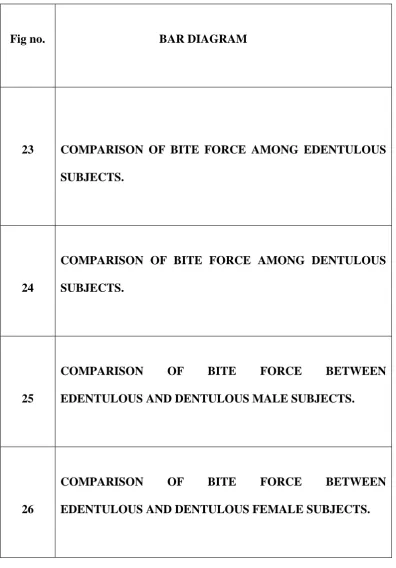
Fig no. BAR DIAGRAM
23 COMPARISON OF BITE FORCE AMONG EDENTULOUS
SUBJECTS.
24
COMPARISON OF BITE FORCE AMONG DENTULOUS
SUBJECTS.
25
COMPARISON OF BITE FORCE BETWEEN
EDENTULOUS AND DENTULOUS MALE SUBJECTS.
26
COMPARISON OF BITE FORCE BETWEEN
[image:14.595.125.522.150.719.2]ABSTRACT
Introduction: Bite force is an important variable used to assess the masticatory
ability and performance of an individual. Among various factors that affect bite force,
gender, facial form and arch form have been assessed in this study.
Keywords: Arch form, Bite Force, Completely edentulous, Facial form.
Aim: This clinical study aims at evaluating the maximum bite force of completely
edentulous patients rehabilitated with complete dentures.
Materials and methods: 288 samples were divided into two groups (completely
edentulous patients and dentulous subjects-144 each); each group into two subgroups
(male and female-72 each) and each subgroup into subdivisions based on their facial
form (Square, Square tapered, Tapered and Ovoid- 18 each) and arch forms (Square,
Tapered and Ovoid- 6 each). The bite force was measured using Bite Force Sensor for
both the groups and the mean values were statistically analyzed.
Results: ANOVA and Tukey’s post-hoc Test revealed that the Square facial form
showed the greatest bite force among other facial forms in all the subgroups and
Square arch form showed the greatest bite force among other arch forms in most of
the subgroups. Independent sample t-Test revealed a significant difference in most of
the bite force values between males and females in both the groups and between all
the edentulous and dentulous subjects.
Conclusion: Gender, facial form and arch form were found to be related to the bite
force in both completely edentulous and dentulous subjects. Assessing these
parameters in a patient could gain us an insight into their bite force and help us in
better treatment planning, material selection, prosthesis design and evaluation and as
Introduction
1
INTRODUCTION:
Mastication is an important process for the stomatognathic system as it
comprises the first step in food digestion. It is a cumulative phenomenon that
comminutes food by increasing its surface area and exposing it to digestive juices1.
Inefficient mastication leads to a change in the choice of an individual’s diet that
negatively influences his health and consequently leads to malnutrition2. Hence, a
thorough knowledge of the masticatory system determines the success of any
prosthodontic treatment.
It has become increasingly important to preserve the masticatory functions
in elderly people for a better quality of life. It’s traumatic for the patient, both
physically and psychologically to experience the transition from having natural teeth
to becoming edentulous and wear complete dentures. Functional performance of the
complete dentures in contributing to the oral health and the quality of edentate
people’s life is thus a major concern in the geriatric dentistry3
.
Various factors such as the bite force, malocclusion, areas of occlusal contacts,
loss of teeth, restorations, facial forms and other motor activities contribute to this
masticatory performance. Among these, biting force is one of the key factors 4,5. The
number of bites taken to process and swallow food or the ability to break the food is a
measure of the mastication process2.
“Bite force is defined as the force of mandibular muscles that determines the
amount of energy available to cut or grind food”2
. Bite force is one of the indicators
of the functional status of the masticatory system which results from jaw elevator
muscle action and the craniomandibular biomechanics6. It has been used in
Introduction
2
prosthetic devices and in providing reference values for future studies7. It has also
been considered quite important in diagnosing stomatognathic disturbances8.
Complete denture wearers have shown to have a lower chewing efficiency
when compared with dentate controls. This functional impairment applies to the
maximum bite force (MBF) as well, which has been described to be almost five to six
times lesser than in dentate subjects. Strength of the muscle and its cross-sectional
area are affected by ageing and by the loss of teeth. Sensitivity and ageing properties
of the load bearing mucosa over the alveolar ridge also limit an individual’s MBF3.
Intraoral force measurement has a long history and dates back to the 17th
century. Borelli in 1681 designed a gnathodynamometer and did the first
experimental study on the intra-oral forces. Black in 1893 designed a new type of
gnathodynamometer, to measure intraoral forces due to vertical jaw movements9.
From simple springs to complex electronic devices, a wide range of methods and
devices have been utilized for the determination of bite forces. More precise and
accurate measurements can now be made with the advancements in various electronic
equipments.
The bite force can be measured directly using a transducer or by indirect
evaluation by employing other physiologic variables (eg. EMG activity of the
muscles) those are functionally associated to the force production10.
Of various devices, strain gauge is a simple yet effective device. Strain-gauge
metal force tranducers have been used in bite force studies by Manly and Vinton 11
and many others. Linderholm and Wennström12 described one of the earliest designs
Introduction
3
plates at one end, and joined at the other end. Strain-gauges were connected in a
Wheatstone Bridge circuit.
Several factors influence the direct measurements of the bite force.
Investigators have found a great variation in bite force values, due to the difference in
the anatomical and physiologic characteristics of each individual such as age, gender
and craniofacial morphology.The mechanical properties of the bite force recording
system also affect the accuracy and precision of the bite force levels.
Relationship of facial form to maximum bite force has been evaluated in
dentulous and edentulous subjects 10.
Symmetry, convexity, roundness and elongation of the dental arches together
make up the arch form which contributes considerably to the diagnosis and treatment
planning, space availability, prosthesis stability and esthetics due to the difference in
its size and shape in each individual13. There is only one study14 relating the arch form
to the bite force in dentulous subjects.
Facial form has been found to be related to the arch form of the individual15
and it has been stated that the arch form could be determined by the facial form16,17.
If a valid relationship could be established between the patient’s facial form,
arch form and his bite force it could help in prognosis of the treatment and better
education of the patient.
As there is no study relating the arch form to bite force in edentulous subjects,
this study was formulated to determine the maximum bite force of edentulous subjects
taking their facial form and arch form as the related factors using a strain gauge based
AIM
&
Aim and Objectives
4
AIM:
The aim of this study was to determine the maximum bite force in patients
rehabilitated with complete denture prosthesis with a strain gauge based Bite
Force Sensor.
OBJECTIVES:
To evaluate the influence of factors such as gender, facial form (Square,
Square-tapering, Tapering and Ovoid) and arch form (Square, Tapering,
Ovoid) on maximum bite force in patients rehabilitated with complete
dentures.
To evaluate the influence of factors such as gender, facial form (Square,
Square-tapering, Tapering and Ovoid) and arch form (Square, Tapering,
Ovoid) on maximum bite force in dentulous subjects taken as control group.
To compare the maximum bite force of completely edentulous subjects and
Review of Literature
5
REVIEW OF LITERATURE:
Dr. G. E. Black (1895)18, the President of Chicago Dental University devised the
gnathodynamometer to measure the average strength of the jaws. When tested in
thousand persons (men and women of all classes), an average of 171 pounds for
the molar teeth was determined and a much lesser value for bicuspids and incisors.
Sargentini et al (1949)19 showed that generally the magnitude of the maximum
bite force are greater in men than in women and has been shown to decrease with
age.
Bojanov (1969)20 concluded that the higher bite force value in the molar region in
the natural dentition is because of the greater periodontal area of the teeth distal in
the arch.
Linderholm and Wennström (1970)13 designed one of the earliest transducers.
Their device consisted of two steel bars made into bite plates at one end, and were
joined at the other end. Steel bars were applied with Strain-gauges and was further
connected in Wheatstone bridge circuit. When the transducer was connected to a
potentiometer writer, it was possible to record the load on the bite plates. The
theory behind the operation is that any bending (loading) changes the resistance
and results in a voltage change (electric potential). The voltage change can be
calibrated with a known weight in order to indicate the applied load.
Wennstrom (1972)21 reported that the maximum bite forces voluntarily generated
by denture-wearers were only one fifth of those subjects with healthy natural
dentition. Moreover, the “preference level” of bite force for denture wearers was
about one eighth that of dentate subjects
Helkimo et al (1976)22 analyzed the relationship between the type of dentition
Review of Literature
6
between 10 and 73 kg. The authors highlighted that the decline in bite force values
was in line with increasing age (especially in females) and also that a variation
could be linked with dental status differences amongst participants. It was
concluded that bite force magnitude may be five times greater in young
individuals with natural dentition when compared to denture wearers.
Ralph W J(1979)23 suggested that the bite force measurement device can be of
adjunct value in assessing the performance of dentures.
Tarbet et a1 (1981)24 concluded that denture wearers with good maxillary
support , retention and stability were capable of biting with twice more than the
force of denture wearers with unsatisfactory tissue support.
Ricketts (1982)25 and Graber (1966)26 showed that facial type and dental arch
could be correlated. Dolichofacial patients were seen to have long, narrow faces,
whereas brachyfacial patients were found to have short faces and broad arches.
Heath M.R. (1982)27 reported that complete denture wearers have a masticatory
efficiency of 16% to 50% as that of dentate subjects.
Proffit et al (1983)28 quoted that a link exists between vertical facial morphology
and bite force magnitude, in addition to weaker mandibular elevator muscles in
studies with adults.
McWhirter (1985)29measured the greatest bite strength of 443 kg (975 lbs) in a
37-year-old man. It was found that the man had extraordinarily large, hypertrophied
masseter and temporal muscles. The second greatest bite strength of 234 Kg
(514lbs) was registered in a 43-year-old man. He was found to have hypertrophied
masseter muscles along with tooth abrasion and heavy bone support from lingual
Review of Literature
7
like (1) bench press- 1300 Kg (660 lbs), (2) dead lift- 402 Kg (884 lbs) and (3)
squat lift-545 Kg (1200 lbs).
Williams et al (1985)30 studied the difference in bite force between complete
dentures wearers and dentate individuals. The discrimination in bite force was
analyzed at three standards - 500, 1000, and 3000 gm. Results revealed that the
difference in bite force was not significant between the two groups. However, at
500 gm, the dentate group showed significantly better performance than the
complete denture wearers.
Williams et al (1988)31 studied if different extents of mouth opening had an effect
on normal subjects' ability in discriminating differences in the inter incisor bite
force. It was concluded that 50 to 90% of maximum opening does not alter the
sensorimotor function for discrimination of bite-force by normal young adults.
Coffery et al (1989)32 analysed the differences in discrimination ability in
self-generated bite force using mandibular and maxillary first molars, premolars,
canines and central incisors. Discrimination performance was seen to be better
when the central incisors were used when compared to the first molars, which
might be explained by the presence of different receptors within the periodontal
ligament.
Bakke et al (1990)33 investigatedsamples of 8-68 year old and said that larger bite
force in males may be due to greater muscular potential.
Cecile G. Michael et al (1990)34 found that the masticatory forces and bite
strength in denture wearers fell below the range of natural dentition. The occlusal
form of the posterior teeth in dentures did not increase the masticatory force
Review of Literature
8
Kikuchi M. et al (1992)35 said that the total maximum bite force generated with
unilateral support was larger than with bilateral support and also there was an
antero-posterior gradient of force with higher force being recorded at the posterior
second molar region followed by the canine region based on the lever theory.
Kiliaridis et al (1993)36 assessed the link between bite force and facial
morphology in the 136 individuals aged 7- 24. Subject's facial morphology was
determined by assessing different parameters from standardized photographs.
Maximum bite force with incisors and upper /lower facial height ratio showed
only slight positive links.
Osborne (1993)37 recorded about190 N and 50 N as the maximum bite force
values in the frontal area in men and women respectively.
Okeson (1993)38 assumed that “ideal” occlusion of the teeth specifies even,
simultaneous and bilateral tooth contacts in the intercuspal position that provide a
balanced distribution of occlusal force. Maximum voluntary bite force is an
important variable for assessing the functional state of the masticatory system in
relation with occulsal factors, dentition, dental prostheses, implant treatment,
orthognathic surgery, oral surgery, temporomandibular disorders and
neuromuscular disease.
Braun et al (1995)39 said that magnitude of maximum bite force varies with
changes in the cranio facial growth, which complements the growth of masticatory
muscles and also the normal growth process
Lyons et al (1996)40 quoted that even though strain-gauge transducers have been
proven to be an accurate method for maximum bite force measurement, recording
a true maximum bite force would still be difficult. This is mainly because biting
Review of Literature
9
breaking of edges and of teeth and restorations. He also concluded that although
the protective covers have decreased the discomfort to some extent the fear and
the discomfort associated with biting on the hard surfaces has not been overcome
totally.
Tortopidis et al(1998)41 said that the position of the recording device within the
oral cavity differs. Generally, stronger bite forces are found in the posterior region
of the dental arch as acknowledged by two different theories. First is the
mechanical lever system of the jaw. Secondly, premolars and molars (posterior
teeth) withstand greater forces than the anteriors.
Patterson (1998)42 said that, bite force has been used to assess prosthetic devices
and to provide reference values for researches in the field of biomechanics of
prosthetic device.
Ow et al (1998)43 found that bite force is one of the important elements involved
in chewing action and is regulated by the "dental, muscular, nervous and skeletal
systems and exerted by the jaw elevator muscle".
Tsuga K. et al (1998)44 assessed the masticatory ability, dental state and bites
force in 160 eighty year old persons and found that the edentulous persons (about
one-fifth of all) reported more problems related to mastication than the other
definition groups. The maximal bite force varied much based on the number of
remaining teeth and dental state. The self-assessed masticatory ability was weakly
correlated with dental state and bite force and many subjects showed a good
adaptation to an impaired dental status and small maximal bite force.
Tortopidis et al (1999)45 attempted to reduce the discomfort occurring on biting
Review of Literature
10
gutta percha, polyvinyl chloride and acrylic resin have been used to cover the
transducers.
Kanashiro et al (2000)46 contrasted arch widths with facial types and showed that
the width of posterior segment increased from dolichofacial to brachyfacial type
and the mathematical arch depth increased from mesofacial to brachyfacial type.
Sonneson et al (2001)47 analysed maximum bite forces to examine the connection
between craniofacial morphology, temporomandibular joint dysfunction and head
position. Study sample included children who were about to receive orthodontic
treatment.
Hatch et al (2001)48 studied the biting force in patients of age range between 45
to 60 years to avoid variation in masticatory performance and reported that the age
factor might directly affect the biting force.
Ortug(2002)1quoted that Borelli was one of the first to assess intraoral forces, by
designing the gnathodynamometer. Weights attached to a cord were passed over
the molar teeth when mandible was open, and with the closing of the jaw it was
raised up to 440 lbs (200 kg). In 1893, Black redesigned and modified the tool.
Fernandes et al (2003)5 said that most of the modern devices utilize electrical
resistance strain gauges and that the majority of the recording instruments have
the ability to record forces between 0 N and 800 N at 80% precision and accuracy.
Sonnesen and Bakke (2005)49 and Usui et al (2007)50 stated that bite force
increases with age until 20 years of age at which point bite force will be stabilized.
However, at 40 years of age, bite force starts decreasing.
Sonnesen and Bakke (2005)49 highlight the presence of a relationship between
Review of Literature
11
fundamental considerations with regards to craniofacial morphology’s impact on
boys’ bite force. It was stated that males with a shorter and lower facial height
were found to have a greater degree of bite force.
Toru et al (2006)51analysed and said that the mandibular dental arch forms were
not found to be correlated with all coefficients and facial types. Due to the
anteroposterior rotation of mandible in malocclusion, the prevalence of
mandibular arch form might be extremely low.
Usui et al (2007)50quoted that repeated recording can result in reduced bite force
due to muscle fatigue. While investigating bite force, the number of recordings
required must be determined by considering the reliability and also by avoiding
fatigue that will cause reduced bite force magnitude.
Olthoft et al (2007)52 said that increasing in the vertical dimension results in
variations in the orofacial morphology. Subsequently, this affects the masticatory
system and bite force values.
Koc et al (2010)2stated that in clinical practice, bite force is measured to assess
dental prosthesis and accordingly to determine the success of rehabilitation in
adults. Such calculations were also pointed towards obtaining bite force reference
ranges to guide prosthetic device and implant designing.
The cranio-facial morphology includes the anterior and posterior facial height
ratio, mandible inclination, and gonial angle. The maximum bite force suggested
the geometry of the mandible's lever system. He said that bite force evaluations
were aimed at determining muscular activity and movements of jaw during the
chewing function. Measurements are also indispensible in terms of evaluation of
Review of Literature
12
Healso reported that the degree of jaw separation had an influence on the bite
force and 14-20 mm was found to be the range of mean jaw separation for
recording bite forces.
Duygu et al (2011)53 concluded that in individuals with normal occlusion, the
mean maximum bite force was higher in men than in women; transverse facial
dimensions had an influence on bite force only in men, suggesting that men with
long faces tended to have a lower bite force than those with normal face. It was
also found that the type of functional occlusion and interferences on balancing
side did not have any influence on maximum bite force.
Sarah et al(2014)7 assessed the maximum bite force in individuals with Angle’s
malocclusions and in those with normal occlusion and found that the type of
occlusion had an influence on bite force, with greater force being seen in
individuals with normal occlusion, followed by Angle’s malocclusion classes I, II
and III respectively. There was an increase in mean bite force measured between
the first and third attempt. There was no significant difference in force
measurements between the right and left sides.
Nickolay (2014)54 analysed and found that the maximum bite force in female
subjects is lesser than that in male subjects. The force in the left and right molar
regions was almost equal, whereas they are about 3 times the values in the frontal
region.
Veena Jain et al (2014)14 analysed the mean maximum bite force in 358 Indian
subjects considering the influence of various factors namely gender, BMI, facial
form, facial profile, arch form and palatal contour. They recorded the bite force
using a customized instrument with a quartz force sensor. The mean maximum
Review of Literature
13
Bite force was significantly higher in: males than in females; in subjects with
concave profile, as compared to straight and convex profile and in square facial
form when compared to ovoid, square tapered and tapered facial form.
Relationship was not found between BMI and bite force.
Gaurav T et al (2014)10 studied the mean maximum bite force in 80 dentulous
and 80 edentulous individuals with different facial forms and concluded that the
dentulous as well as edentulous individuals with square face had higher maximum
bite force. He quoted that the vertical ramus and acute gonial angle could have
provided greater mechanical advantage to the elevator muscles.
Sanjna et al (2015)15 analysed the association between arch form and facial form
in dentulous patients. In the upper arch of leptoprosophic faces, square arch
(63.63%) was predominant whereas in mesoprosophic faces ovoid arches were
MATERIALS
&
Materials and Methods
14
MATERIALS AND METHODOLOGY:
The present study was conducted to evaluate the maximum bite force in
patients rehabilitated with complete dentures and compare it with that of the dentulous
control subjects.
The study was conducted in the Department of Prosthodontics and Crown and
Bridge, Tamilnadu Government Dental College and Hospital, Chennai.
ETHICAL COMMITTEE APPROVAL:
This study was conducted with the approval of the Institutional Ethical
Committee.
The following materials and equipments were used to conduct the study:
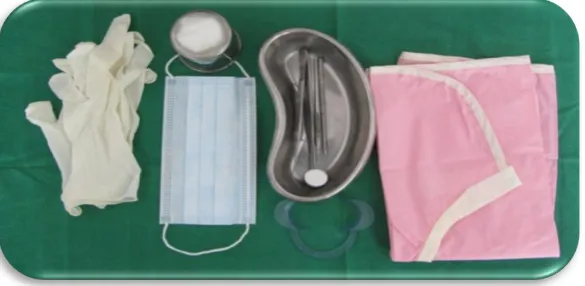
ARMAMENTARIUM FOR CLINICAL EXAMINATION: (Fig.1)
1. Kidney tray
2. Mouth mirror
3. Williams Periodontal probe
4. Check retractor
5. Disposable glove and mask
ARMAMENTARIUM FOR STUDY MODELS AND FABRICATION OF
COMPLETE DENTURE: (Fig.2)
1. Maxillary and mandibular stock trays- edentulous and dentulous
2. Alginate –Algitex (DPI)
3. Medium fusing impression compound (DPI)
4. Type III dental stone
5. Type II dental plaster
6. Autopolmerizing acrylic resin (DPI)
Materials and Methods
15
8. Light body addition silicon impression material (Aquasil LV, DENTSPLY)
9. Tray adhesive (Virtual, ivoclar vivadent)
10. Modelling wax (HIFLEX)
11. Hard wax (Cavex)
12. Dentatus face bow and articulator
13. Acryrock ruthenium teeth set
14. Heat cure acrylic resin (DPI)
ARMAMENTARIUM FOR EVALUATING THE BITE FORCE
1. Bite Force Sensor HE6210 (HariOm Electronics, Gujarat)
2. Digital display box (HariOm Electronics, Gujarat).
3. 2mm thick thermoplastic sheet.
4. Disposable sleeves
5. Surgical gloves
6. Surgical spirit
METHODOLOGY:
STUDY POPULATION:
Completely edentulous patients (age group: 50 to 70 years) who were
scheduled for complete denture fabrication were selected for the study. Dentulous
control group comprised of subjects of age 20-30 years.
SAMPLE SIZE AND DESIGN:
A total of 288 samples were included in the study. The samples were
divided into two groups- Completely edentulous (144) and Dentulous subjects
(control group-144). Each group was divided into two subgroups- Male (72) and
Materials and Methods
16
Each subgroup was further classified into subdivisions based on their facial
form and arch form into:
i. Square facial form (n=18):
Square arch form (n=6), Tapered arch form (n=6), Ovoid arch form (n=6)
ii. Square tapered facial form (n=18):
Square arch form (n=6), Tapered arch form (n=6), Ovoid arch form (n=6)
iii. Tapered facial form (n=18):
Square arch form (n=6), Tapered arch form (n=6), Ovoid arch form (n=6)
iv. Ovoid facial form (n=18):
Square arch form (n=6), Tapered (n=6), Ovoid arch form (n=6)
EXAMINATION:
All participants were examined clinically and radiograpically to ensure absence
of pathology of residual alveolar ridge, mucosa or bone.
CRITERIA FOR SELECTION:
INCLUSION CRITERIA:
EDENTULOUS SUBJECTS:
1. Patients willing for voluntary participation and have signed informed consent.
2. Completely edentulous patients, with well contoured ridge covered by healthy
mucosa.
3. Age group 50-70 years.
4. Patients without prior complete denture experience.
5. Systemically healthy individuals.
6. Absence of any pathology around the area of interest.
DENTULOUS SUBJECTS:
Materials and Methods
17
2. Presence of complete permanent dentition with Angle’s class I molar
relationship (excluding third molars).
EXCLUSION CRITERIA:
EDENTULOUS SUBJECTS:
1. Patients with facial asymmetry.
2. Acute infection.
3. Medically compromised individuals.
4. Patients on radiotherapy.
5. Patients who have had trauma in craniofacial structures.
6. Patients who have undergone any surgery in craniofacial structures.
7. Patients with temporomandibular disorders.
8. Patient with poor neuromuscular control.
9. Debilitated individuals.
10. Flat /spiny/flabby ridge.
11. Mentally challenged persons.
12. Any form of tobacco users.
DENTULOUS SUBJECTS:
Criteria in addition to those of the edentulous patients:
1. History of parafunctional habits.
2. Occlusal rehabilitation by splint or muscle relaxant.
3. Orthodontic treatment or dental prosthesis.
4. Any type of restoration.
Materials and Methods
18
FLOW CHART- STUDY DESIGN:
PHASE I – CLINICAL EXAMINATION AND IMPRESSION PROCEDURES FOR STUDY MODELS
PHASE II – ESTABLISHMENT OF FACIAL FORM AND ARCH FORM
FOR COMPLETELY EDENTULOUS AND DENTULOUS SUBJECTS.
PHASE III – COMPLETE DENTURE FABRICATION FOR COMPLETELY EDENTULOUS SUBJECTS
PHASE IV– BITE FORCE EVALUATION IN COMPLETELY
EDENTULOUS PATIENTS REHABILITATED WITH COMPLETE
DENTURES (ONE MONTH POST-INSERTION) AND CONTROL
Materials and Methods 19 STUDY SAMPLE: SAMPLE SIZE (N=288) MALE (N=72) GROUP )
FEMALE (N =72) MALE (N= 72) FEMALE (N=72) COMPLETELY
EDENTULOUS (N=144)
n
DENTULOUS (N=144)
Each subgroup is further classified based on their facial form and arch form. SUBGROUP GROUP SUBGROUP (N=72) SUBDIVISIONS FACIAL FORMS SQUARE TAPERED
(N=18) WITH ARCH FORMS (N=6 IN EACH)
Materials and Methods
20
EXPERIMENTAL PROTOCOL:
PHASE I – Clinical examination and impression procedures for study model
fabrication.
PHASE II – Establishment of facial form and arch form for completely edentulous
and dentulous control subjects.
PHASE III – Complete denture fabrication for completely edentulous patients.
PHASE IV– Bite force evaluation in completely edentulous patients rehabilitated
with compete dentures (one month post-insertion) and in the control group.
CLINICAL PROCEDURES:
PHASE I
1. Medical and dental history was obtained. Clinical examination was done.
2. For completely edentulous patients, primary impressions of maxillary and
mandibular ridges were recorded with medium fusing impression compound and casts
were poured with type II dental plaster.
3. For dentulous subjects, alginate impressions were made for the maxillary and
mandibular arches and casts were poured with type III dental stone.
PHASE II-
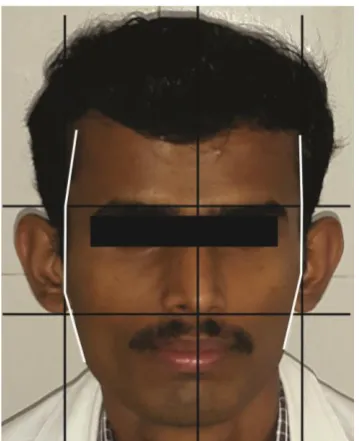
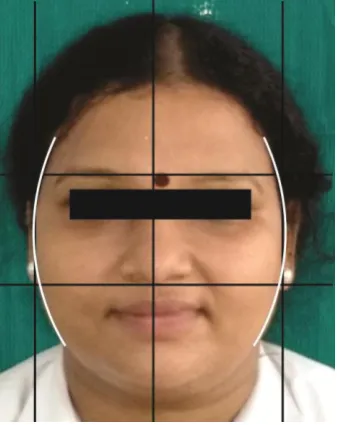
ESTABLISHMENT OF FACIAL FORM:
Facial dimensions were determined by measurements made on standardized
digital photographs. The camera (Cyber-shot DSC W110; Sony, Japan) was
positioned at 1m distance from subjects and adjusted to the same level of the subject’s
eyes. Frontal photographs were taken with the Frankfort plane approximately parallel
to the floor. The obtained digital images were 2048x1536 pixels in size and 5.1
megapixels in resolution. The images were analyzed using Adobe Photoshop CS3.
Materials and Methods
21
marked. Horizontal lines were placed in supraorbital ridge and at the base of nose
perpendicular to facial midline dividing the face into three parts. Then the facial form
was evaluated based on the relation between facial outline and vertical line in both the
groups as follows:
Square - facial outline almost parallel to the vertical guide lines. (Fig.3, 7).
Square-tapered - facial outline tapering inward from middle third of face (Fig.4, 8).
Tapered - facial outline tapering inward from upper third of the face (Fig.5, 9).
Ovoid - a curved facial outline against the vertical guide lines (Fig.6, 10).
ESTABLISHMENT OF ARCH FORM:
Edentulous upper arch forms were classified as Square, Tapered and Ovoid.
(Fig. 11, 13, 15).
For the dentulous subjects, the distance between the intercanine line to incisal
surface of maxillary central incisor was measured on the maxillary study model and
the arch form was divided into:
Square -The arch form with central incisors nearly in line with the canines (Fig.12).
Tapered -The arch form with central incisors at a greater distance forward from the
canines (Fig.14).
Ovoid -The arch form with central incisors forward of canines in positions between
that of square and tapered arch (Fig.16).
PHASE III
1. Custom trays were fabricated using auto-polymerizing resin on the primary
edentulous casts and peripheral tracing was performed by putty material and wash
impression was made with light body impression material and master casts were made
with dental stone.
Materials and Methods
22
transfer was made to record the maxillomandibular relationship and casts were
articulated.
3. Semi-anatomic teeth were set according to the principles of teeth arrangement.
4. The try in of the waxed denture was done and dentures were processed using
heat cure acrylic material.
5. Dentures were inserted; occlusal discrepancies were checked and addressed
followed by post-insertion instructions for denture use.
6. Follow up appointments were planned after 24 hr, 1 week and1 month.
PHASE IV
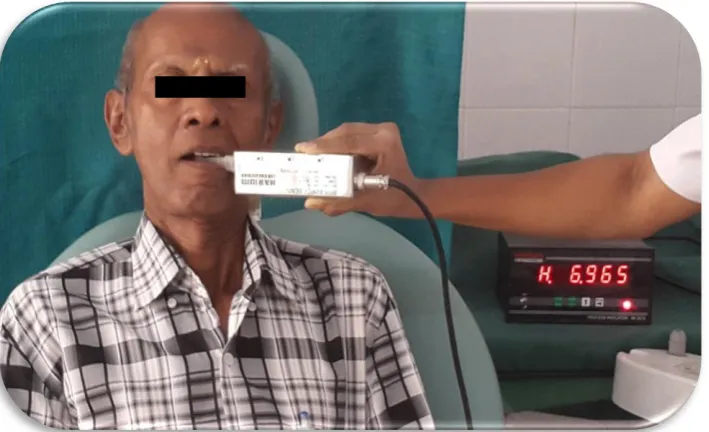
1. The Bite Force Sensor device (Fig.17) was calibrated by applying known
weights of 1 kg, 2kg and 5 kg before recording any values.
2. A 2mm thick thermoplastic sheet was used (Fig.18) to protect the teeth from
getting damaged while applying bite pressure and it was further covered by disposable
sleeves to protect it from cross contamination.
3. The patient was seated in an upright position in dental chair, keeping the
maxillary plane approximately parallel to the floor. The strain gauge was also
maintained parallel to the maxillary denture and evaluated intraorally for proper
position and comfort.
4. The device was placed unilaterally, positioned between the most distal
maxillary and mandibular molars for dentulous subject and between the second
premolars and first molar for completely edentulous subjects with complete dentures.
5. Bite force was recorded for 2-3 times till the subjects got familiar with the
device. After each recording, one minute was allowed to pass before the next
Materials and Methods
23
left side of each subject (Fig.19-22) and their mean value was taken for the statistical
analysis.
STATISTICAL ANALYSIS:
The scores attributed to each group were recorded. The comparisons between
averages were performed using SPSS -16 software. Quantitative data obtained in the
present study was assessed for normality using Shapiro Wilk’s test and was found to
be parametric in nature. Inter-group analysis of bite force between different facial
forms and arch forms was carried out using one-way ANOVA followed by Tukey’s
post-hoc test. Bite force comparisons between dentulous and edentulous arches and
gender respectively was carried out using independent sample t-test. P<0.05 was
Fig.1 ARMAMENTARIUM FOR CLINICAL EXAMINATION
Fig.2 ARMAMENTARIUM FOR STUDY MODELS AND
[image:43.595.176.469.191.334.2][image:44.595.246.417.175.386.2]
Fig.3 SQUARE FACIAL FORM- EDENTULOUS PATIENT
[image:44.595.248.419.503.717.2][image:45.595.219.388.177.385.2]
Fig.5 TAPERED FACIAL FORM- EDENTULOUS PATIENT
[image:45.595.222.386.499.708.2]
Fig.7 SQUARE FACIAL FORM- DENTULOUS SUBECT
[image:47.595.248.417.512.725.2]
Fig. 9 TAPERED FACIAL FORM- DENTULOUS SUBECT
Fig.11 Edentulous Square Arch Fig.12 Dentulous Square Arch
Fig.13 Edentulous Tapered Arch Fig.14 Dentulous Tapered Arch
Fig.15 Edentulous Ovoid Arch Fig.16 Dentulous Ovoid Arch
SQUARE ARCH FORM
TAPERED ARCH FORM
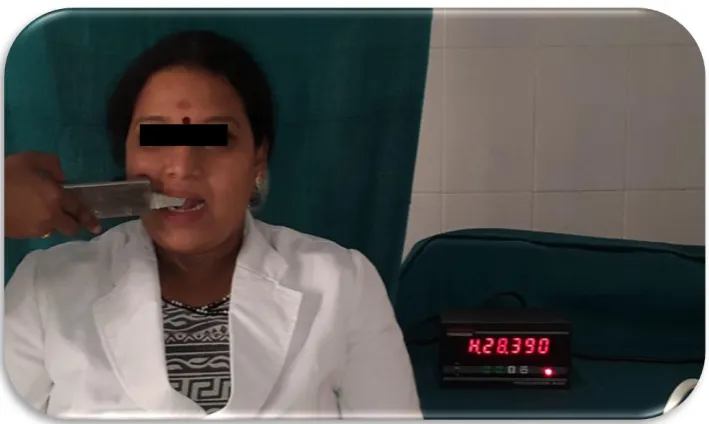
Fig.17 BITE FORCE SENSOR HE 6210 AND DIGITAL DISPLAY BOX
Fig.19 BITE FORCE MEASUREMENT IN DENTULOUS SUBECT-LEFT SIDE
[image:50.595.152.507.511.723.2]Fig.21 BITE FORCE MEASUREMENT IN EDENTULOUS SUBJECT- RIGHT SIDE
[image:51.595.153.508.520.736.2]Results [image:53.595.151.482.188.700.2]
24
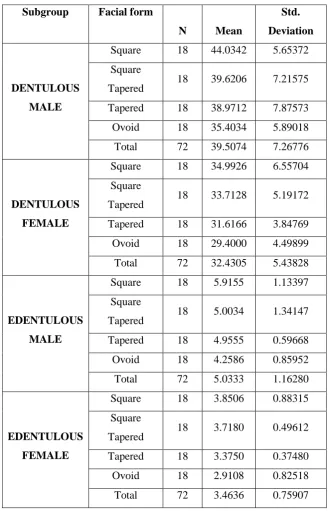
TABLE 1:
COMPARISON OF MEAN BITE FORCE BETWEEN DIFFERENT FACIAL
FORMS IN THE SUBGROUPS BY DESCRIPTIVE STATISTICS:
Subgroup Facial form
N Mean
Std.
Deviation
DENTULOUS
MALE
Square 18 44.0342 5.65372
Square
Tapered 18 39.6206 7.21575
Tapered 18 38.9712 7.87573
Ovoid 18 35.4034 5.89018
Total 72 39.5074 7.26776
DENTULOUS
FEMALE
Square 18 34.9926 6.55704
Square
Tapered 18 33.7128 5.19172
Tapered 18 31.6166 3.84769
Ovoid 18 29.4000 4.49899
Total 72 32.4305 5.43828
EDENTULOUS
MALE
Square 18 5.9155 1.13397
Square
Tapered 18 5.0034 1.34147
Tapered 18 4.9555 0.59668
Ovoid 18 4.2586 0.85952
Total 72 5.0333 1.16280
EDENTULOUS
FEMALE
Square 18 3.8506 0.88315
Square
Tapered 18 3.7180 0.49612
Tapered 18 3.3750 0.37480
Ovoid 18 2.9108 0.82518
Results [image:54.595.108.529.198.521.2]
25
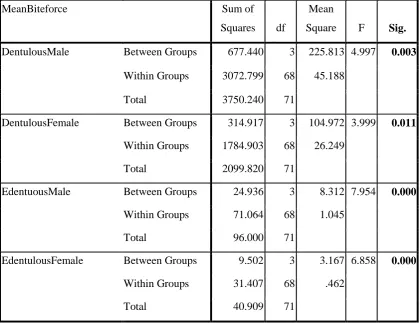
TABLE 2:
COMPARISON OF MEAN BITE FORCE IN DIFFERENT FACIAL FORMS
BETWEEN AND WITHIN THE SUBGROUPS BY ONE WAY ANOVA TEST:
MeanBiteforce Sum of
Squares df
Mean
Square F Sig.
DentulousMale Between Groups 677.440 3 225.813 4.997 0.003
Within Groups 3072.799 68 45.188
Total 3750.240 71
DentulousFemale Between Groups 314.917 3 104.972 3.999 0.011
Within Groups 1784.903 68 26.249
Total 2099.820 71
EdentuousMale Between Groups 24.936 3 8.312 7.954 0.000
Within Groups 71.064 68 1.045
Total 96.000 71
EdentulousFemale Between Groups 9.502 3 3.167 6.858 0.000
Within Groups 31.407 68 .462
Results [image:55.595.102.440.201.560.2]
26
TABLE 3:
MULTIPLE COMPARISON OF MEAN BITE FORCE BETWEEN
DIFFERENT FACIAL FORMS IN DENTULOUS MALE USING TUKEY
HSD-POST HOC TEST
Subgroup Facial form
(I)
Groups
(J)
Mean
Difference
(I-J)
Sig.
DENTULOUS
MALE
Square Square
Tapered 4.41358 0.210
Tapered 5.06300 0.118
Ovoid 8.63086* 0.001
Square
Tapered
Square -4.41358 0.210
Tapered 0.64942 0.991
Ovoid 4.21728 0.245
Tapered Square -5.06300 0.118
Square
Tapered -0.64942 0.991
Ovoid 3.56786 0.390
Ovoid Square -8.63086* 0.001
Square
Tapered -4.21728 0.245
Tapered -3.56786 0.390
Results [image:56.595.102.440.201.556.2]
27
TABLE 4:
MULTIPLE COMPARISON OF MEAN BITE FORCE BETWEEN
DIFFERENT FACIAL FORMS IN DENTULOUS FEMALE USING TUKEY
HSD-POST HOC TEST
Subgroup Facial form
(I)
Groups
(J)
Mean
Difference
(I-J)
Sig.
DENTULOUS
FEMALE
Square Square
Tapered -0.72014 0.975
Tapered 2.37600 0.509
Ovoid 4.59264* 0.044
Square
Tapered
Square 0.72014 0.975
Tapered 3.09614 0.276
Ovoid 5.31278* 0.014
Tapered Square -2.37600 0.509
Square
Tapered -3.09614 0.276
Ovoid 2.21664 0.567
Ovoid Square -4.59264* 0.044
Square
Tapered -5.31278
*
0.014
Tapered -2.21664 0.567
Results [image:57.595.102.446.201.563.2]
28
TABLE 5:
MULTIPLE COMPARISON OF MEAN BITE FORCE BETWEEN
DIFFERENT FACIAL FORMS IN EDENTULOUS MALE USING TUKEY
HSD-POST HOC TEST
Subgroup Facial form
(I)
Groups
(J)
Mean
Difference
(I-J)
Sig.
EDENTULOUS
MALE
Square Square
Tapered 0.91211
*
0.045
Tapered 0.95997* 0.031
Ovoid 1.65686* 0.000
Square
Tapered
Square -0.91211*
0.045
Tapered 0.04786 0.999
Ovoid 0.74475 0.138
Tapered Square -0.95997* 0.031
Square
Tapered -0.04786 0.999
Ovoid 0.69689 0.182
Ovoid Square -1.65686* 0.000
Square
Tapered -0.74475 0.138
Tapered -0.69689 0.182
Results [image:58.595.102.446.224.582.2]
29
TABLE 6:
MULTIPLE COMPARISON OF MEAN BITE FORCE BETWEEN
DIFFERENT FACIAL FORMS IN EDENTULOUS FEMALE USING TUKEY
HSD-POST HOC TEST
Subgroup Facial form
(I)
Groups
(J)
Mean
Difference
(I-J)
Sig.
EDENTULOUS
FEMALE
Square Square
Tapered 0.13256 0.936
Tapered 0.47558 0.164
Ovoid 0.93975* 0.001
Square
Tapered
Square -0.13256 0.936
Tapered 0.34303 0.435
Ovoid 0.80719*
0.004
Tapered Square -0.47558 0.164
Square
Tapered -0.34303 0.435
Ovoid 0.46417 0.181
Ovoid Square -0.93975* 0.001
Square
Tapered -0.80719
*
0.004
Tapered -0.46417 0.181
Results [image:59.595.103.475.238.593.2]
30
TABLE 7:
COMPARISON OF MEAN BITE FORCE BETWEEN DIFFERENT ARCH
FORMS FOR THE RESPECTIVE FACIAL FORMS IN EDENTULOUS
MALE BY DESCRIPTIVE STATISTICS
Facial
Form
Arch
form N Mean
Std.
Deviation Minimum Maximum
Square
Square 6 6.9178 0.75797 5.57 7.69
Tapered 6 6.1484 0.67230 5.37 7.39
Ovoid 6 4.6802 0.49376 4.03 5.45
Total 18 5.9155 1.13397 4.03 7.69
Square
Tapered
Square 6 6.0512 0.91495 4.80 6.97
Tapered 6 5.3335 0.78644 4.50 6.37
Ovoid 6 3.6255 0.96766 2.88 5.55
Total 18 5.0034 1.34147 2.88 6.97
Tapered
Square 6 5.3982 0.36782 4.79 5.84
Tapered 6 4.9228 0.43440 4.43 5.41
Ovoid 6 4.5457 0.66969 3.94 5.30
Total 18 4.9555 0.59668 3.94 5.84
Ovoid
Square 6 4.5062 0.98372 3.37 5.48
Tapered 6 4.5157 0.94937 3.39 5.54
Ovoid 6 3.7541 0.42954 3.32 4.33
Results [image:60.595.108.533.196.521.2]
31
TABLE 8:
COMPARISON OF MEAN BITE FORCE BETWEEN AND WITHIN FACIAL
FORMS IN EDENTULOUS MALE BY ONE WAY ANOVA TEST
Facial form-mean bite
force
Sum of
Squares df Mean Square F Sig.
Square Between Groups 15.509 2 7.754 18.313 0.000
Within Groups 6.352 15 .423
Total 21.860 17
SquareTapered Between Groups 18.632 2 9.316 11.684 0.001
Within Groups 11.960 15 .797
Total 30.592 17
Tapered Between Groups 2.190 2 1.095 4.252 0.034
Within Groups 3.862 15 .257
Total 6.052 17
Ovoid Between Groups 2.291 2 1.146 1.674 0.221
Within Groups 10.268 15 .685
Results
32
TABLE 9:
MULTIPLE COMPARISON OF MEAN BITE FORCE BETWEEN
DIFFERENT ARCH FORMS FOR THE RESPECTIVE FACIAL FORMS IN
EDENTULOUS MALE BY TUKEY HSD-POST HOC TEST
Facial form (I)
Groups (J) Groups Mean Difference (I-J) Sig.
Square Square Tapered
Ovoid
0.76942
2.23758
0.135
0.000
Tapered Square
Ovoid
-0.76942
1.46817
0.135
0.004
Ovoid Square
Tapered -2.23758 -1.46817* 0.000 0.004 Square Tapered
Square Tapered
Ovoid
0.71767
2.42567*
0.370
0.001
Tapered Square
Ovoid
-0.71767
1.70800
0.370
0.012
Ovoid Square
Tapered
-2.42567
-1.70800*
0.001
0.012
Tapered Square Tapered
Ovoid
0.47542
0.85250
0.267
0.027
Tapered Square
Ovoid
-0.47542
0.37708
0.267
0.424
Ovoid Square
Tapered
-0.85250*
-0.37708
0.027
0.424
Ovoid Square Tapered
Ovoid
-0.00950
0.75208
1.000
0.287
Tapered Square
Ovoid
0.00950
0.76158
1.000
0.278
Ovoid Square
Tapered
-0.75208
-0.76158
0.287
0.278
Results
33
TABLE 10:
COMPARISON OF MEAN BITE FORCE BETWEEN DIFFERENT ARCH
FORMS FOR THE RESPECTIVE FACIAL FORMS IN EDENTULOUS
FEMALE BY DESCRIPTIVE STATISTICS:
Facial
form
Arch
form N Mean
Std.
Deviation Minimum Maximum Sig.
Square
Square 6 4.3925 0.55882 3.53 5.00
0.000
Tapered 6 4.3113 0.16675 4.11 4.52
Ovoid 6 2.8478 0.70568 2.12 4.02
Total 18 3.8506 0.88315 2.12 5.00
Square
Tapered
Square 6 3.9071 0.37015 3.43 4.33
0.014
Tapered 6 3.9763 0.26550 3.63 4.34
Ovoid 6 3.2706 0.51589 2.59 4.08
Total 18 3.7180 0.49612 2.59 4.34
Tapered
Square 6 3.3917 0.25984 3.14 3.90
0.152
Tapered 6 3.5765 0.49631 2.89 4.17
Ovoid 6 3.1568 0.23989 2.82 3.56
Total 18 3.3750 0.37480 2.82 4.17
Ovoid
Square 6 3.0139 0.32496 2.45 3.29 0.744
Tapered 6 2.6878 0.50512 1.96 3.29
Ovoid 6 3.0307 1.36555 1.78 5.02
Results [image:63.595.110.546.196.520.2]
34
TABLE 11:
COMPARISON OF MEAN BITE FORCE BETWEEN AND WITHIN FACIAL
FORMS IN EDENTULOUS FEMALE BY ONE WAY ANOVA TEST
Facial form- mean bite
force
Sum of
Squares df Mean Square F Sig.
Square Between Groups 9.069 2 4.534 16.232 0.000
Within Groups 4.190 15 .279
Total 13.259 17
SquareTapered Between Groups 1.816 2 .908 5.751 0.014
Within Groups 2.368 15 .158
Total 4.184 17
Tapered Between Groups .531 2 .266 2.145 0.152
Within Groups 1.857 15 .124
Total 2.388 17
Ovoid Between Groups .448 2 .224 .302 0.744
Within Groups 11.127 15 .742
Results
35
TABLE 12:
MULTIPLE COMPARISON OF MEAN BITE FORCE BETWEEN
DIFFERENT ARCH FORMS FOR THE RESPECTIVE FACIAL FORMS IN
EDENTULOUS FEMALE BY TUKEY HSD-POST HOC TEST
Facial form (I) Groups (J) Groups Mean Difference
(I-J)
Sig.
Square Square Tapered
Ovoid
0.08117 1.54467*
0.962
0.000
Tapered Square
Ovoid
-0.08117 1.46350*
0.962
0.001
Ovoid Square
Tapered -1.54467* -1.46350* 0.000 0.001 Square Tapered
Square Tapered
Ovoid
-0.06925 0.63650*
0.951
0.036
Tapered Square
Ovoid
0.06925 .070575*
0.951
0.020
Ovoid Square
Tapered
-0.63650* -0.70575*
0.036
0.020
Tapered Square Tapered
Ovoid
-0.18483 0.23492
0.643 0.496
Tapered Square
Ovoid
0.18483 0.41975
0.643 0.131
Ovoid Square
Tapered
-0.23492 -0.41975
0.496 0.131
Ovoid Square Tapered
Ovoid
0.32608 -0.01675
0.792 0.999
Tapered Square
Ovoid
-0.32608 -0.34283
0.792 0.773
Ovoid Square
Tapered
0.01675 0.34283
0.999 0.773
Results [image:65.595.102.485.201.567.2]
36
TABLE 13:
COMPARISON OF MEAN BITE FORCE BETWEEN DIFFERENT ARCH
FORMS FOR THE RESPECTIVE FACIAL FORMS IN DENTULOUS MALE
BY DESCRIPTIVE STATISTICS:
Facial
form
Arch
form N Mean
Std.
Deviation Minimum Maximum
Square
Square 6 47.9300 6.68790 35.89 53.80
Tapered 6 43.3971 4.94530 38.69 52.09
Ovoid 6 40.7756 2.83783 36.27 44.88
Total
18 44.0342 5.65372 35.89 53.80
Square
Tapered
Square 6 43.1938 7.07779 35.73 53.86
Tapered 6 37.8915 7.69631 28.00 50.89
Ovoid 6 37.7767 6.68662 26.57 43.51
Total 18 39.6206 7.21575