A microarray approach to understanding stress in a coral reef fish
176
0
0
Full text
(2) A microarray approach to understanding stress in a coral reef fish. Thesis submitted by Karin Sonja KASSAHN B.Sc.(Hons), The University of Adelaide in November 2006. for the degree of Doctor of Philosophy in Zoology within the School of Marine and Tropical Biology James Cook University.
(3) Statement of Access. I, the undersigned, the author of this thesis, understand that James Cook University will make this thesis available for use within the University Library and, via the Australian Digital Theses network, for use elsewhere. I understand that, as an unpublished work, a thesis has significant protection under the Copyright Act and; I wish this work to be embargoed until 22nd of February 2008.. (Karin Sonja Kassahn). (Date). i.
(4) Statement of Sources. DECLARATION. I declare that this thesis is my own work and has not been submitted in any form for another degree or diploma at any university or other institution of tertiary education. Information derived from the published or unpublished work of others has been acknowledged in the text and a list of references is given.. (Karin Sonja Kassahn). (Date). ii.
(5) Electronic Copy. I, the undersigned, the author of this work, declare that the electronic copy of this thesis provided to James Cook University, is an accurate copy of the print thesis submitted, within the limits of the technology available.. (Karin Sonja Kassahn). (Date). iii.
(6) Statement of the contribution of others. All chapters of this thesis include collaborative work with my supervisors Prof. Ross H. Crozier and Dr. M. Julian Caley. The thesis chapters two, three, and four also include collaborative work with Dr. Alister C. Ward, Dr. Glenn Stone and Dr. Ashley R. Connolly. While undertaking these collaborations I was responsible for the project concept and design, the collection of the majority of the samples, the laboratory work, the statistical analyses, synthesis, and the preparation of manuscripts and this thesis. Funding for this project was provided by James Cook University and the Great Barrier Reef Marine Park Authority under the Science for Management Award program. My supervisors assisted with funds obtained from James Cook University (RHC), The Australian Research Council (RHC, MJC), The Estate of W. V. Scott (RHC), and the Hermon Slade Foundation (MJC). In-kind support was provided by Dr. Alister C. Ward (microarray slides), and the Adelaide Microarray Facility (use of laboratory facilities). I received stipend support from an International Postgraduate Research Scholarship (Australian Government) and School of Tropical Biology (James Cook University) as well as a completion scholarship from James Cook University. Lewis Anderson and Dr. Line Bay provided assistance with the collection of Pomacentrus moluccensis and the performance of stress experiments. Zebrafish genomic DNA samples were kindly provided by the Zebrafish Facility, The University of Adelaide. Dr. Glenn Stone provided support with the experimental design of the microarray experiments and the statistical analyses of the microarray data. Dr. Ashley R. Connolly provided support with the design and performance of the microarray experiments. Ching Crozier provided assistance with the laboratory work.. iv.
(7) Dr. Andrew Perkins, Milena Gongora, Simon Wilkins and The ARC Special Research Centre in Function and Applied Genomics at The Institute for Molecular Bioscience, University of Queensland, provided assistance with the annotation of the zebrafish microarray features. Lauryne Grant, Caroline Chong, Zoe Baker, and Dr. Matthew Symonds provided help with proof-reading and editing of this thesis.. This work conforms to ethical requirements at relevant authorities and collection of animals was authorised from the Great Barrier Reef Marine Park Authority, permit number G04/12331.1.. v.
(8) Acknowledgements Many people have helped me conduct and complete the research in this thesis. I would like to thank: • My supervisors and mentors, Prof. Ross Crozier and Dr. Julian Caley, for their continuous support and guidance. It has been great working with you. Thank you for all your support. • My collaborators Dr. Ashley Connolly, Dr. Alister Ward and Dr. Glenn Stone for their many contributions to this work. It has been very enjoyable working with you. • Ching Crozier for her help with the laboratory work and being such a kind and accommodating lab manager. • Prof. David Miller for his advice with the microarray experiments and many interesting discussions. • The organisations that provided financial assistance: James Cook University, GBRMPA and grants awarded to my supervisors. • Staff at The Lizard Island Research Station, especially Lyle and Anne, for providing assistance during field collections and stress experiments. • The Zebrafish Facility, The University of Adelaide for providing the zebrafish samples. • Dr. Andrew Perkins, Milena Gongora, and Simon Wilkins at the Institute for Molecular Bioscience, University of Queensland, for help with the annotation of the zebrafish array features. • The members of the Crozierlab and fellow postgraduate students and post-docs at JCU, in particular Lewis Anderson, Zoe Baker, Michelle Boyle, Sara Ceccarelli, Caroline Chong, Faye Christidis, Jane DeGabriel, Kirsten Evertz, Michelle Guzik, Kylie Gorringe, Ben Moore, Thomas Rayner, Familie Schlüns, Angela Shuetrim, Matthew Symonds for many discussions, encouragement throughout this project and, above all, your friendship. • My officemates Lauryne Grant and Rodrigo Esparza-Salas for many discussions, hours of entertainment, and your fabulous officemateship.. vi.
(9) General Abstract Coral reef fishes are expected to experience a rise in sea surface temperatures due to climate change. How well tropical reef fishes will respond to these increased temperatures and which genes are important in the response to elevated temperatures is not known. Microarray technology provides a powerful tool for gene discovery studies, but the development of microarrays for individual species can be expensive and time-consuming. There often are, however, microarrays available for related species. I show that inter-species genomic hybridisation experiments can be used to assess which genes are conserved enough for microarray analysis across species, and thus introduce a novel application of microarray technology. I performed a series of tests to determine whether a microarray developed for the zebrafish Danio rerio is useful for measuring gene regulation in the coral reef fish Pomacentrus moluccensis. I hybridised genomic DNA from both taxa onto the D. rerio microarray, and based on significant cross-hybridisation, inferred that most genes share significant sequence similarity between the two taxa. I also sequenced eight nuclear genes. These genes showed an average sequence similarity of 81%. Finally, I used quantitative real-time PCR to validate the microarray data for differential expression. The results of the genomic hybridisation experiments, direct sequence comparisons, and quantitative real-time PCR indicate that the D. rerio microarray is useful for measuring gene regulation in P. moluccensis. I then used the D. rerio microarray to characterise the transcriptional responses of P. moluccensis to elevated temperatures over five days. Heat stress elicited differential expression of 324 genes. The functions of heat-responsive genes indicated that prolonged heat exposure leads to oxidative stress and protein damage, challenges the immune system, and causes reallocation of energy sources. I have shown that a temperature increase of three degrees above normal can lead to significant gene regulation in a coral reef fish suggesting that climate change will have measurable impacts upon coral reef fish physiology. In order to identify upstream regulators of the transcriptional responses observed and test for the presence of a general stress response, I measured the early gene responses of P. moluccensis to hypoxic, hyposmotic, cold and heat shock. Early stress responses three hours after exposure were generally associated with a vii.
(10) suppression of transcription, but the responses of individual genes varied depending on the type of stressor applied. Only a few genes showed consistent regulation across stress treatments. However, a series of gene functions showed consistent responses across stress treatments, suggesting that there are common effects of stress on biological function. I present a conceptual model of the interactions between stress responses at different levels of biological organisation. I propose that stress commonly leads to a reduction in cellular oxygen levels and oxidative stress. Reduced cellular oxygen levels initiate endocrine, cardio-respiratory, and cellular responses many of which are aimed at restoring cellular oxygen balance. Oxidative stress in turn activates certain signal transduction pathways, immediate early genes, and transcription factors. The transcriptional stress profiles measured in environmental genomic studies are likely the result of the activation of these redoxsensitive signalling pathways and transcription factors. Further, I tested whether genes with stress-related functions evolve at accelerated rates. To do this, I competitively hybridised genomic DNA from D. rerio and P. moluccensis to a D. rerio microarray. 985 genes showed evidence of accelerated rates of sequence evolution between D. rerio and P. moluccensis. Rapidly diverging genes were overrepresented for receptor, transcription co-activator, and cell signalling functions, but not for stress-related gene functions. I obtained orthologous sequences to D. rerio for the teleosts Takifugu rubripes and Gasterosteus aculeatus. A selection of rapidly diverging candidate genes showed accelerated rates of sequence evolution across multiple teleost lineages. I have shown that genomic hybridisation experiments on microarrays can be successfully used to identify rapidly diverging genes, in particular in species that currently lack genome sequence data and for which bioinformatic approaches are thus not applicable.. viii.
(11) Table of contents CHAPTER 1 General Introduction…………………………..……………………….1 CHAPTER 2 Heterologous microarray experiments used to identify the early gene response to heat stress in a coral reef fish………….………………………….……...9 Abstract…………………………………………………………...……….………9 Introduction…………………………………..…………………………….…….10 Materials and Methods..…………………………………………………….……12 Thermal stress experiments………………………………………..…..……12 Microarray platform…………………………………………….…….….…13 Comparative genomic DNA hybridisation experiment…………...................13 Microarray analysis of heat-stressed P. moluccensis……………….…..….14 Microarray statistical data analysis and data mining……………….……..14 Quantitative real-time PCR data verification of array data...……….….….17 Direct sequence comparison between D. rerio and P. moluccensis….…..…20 Results……………………………………...…………………………………….20 Estimation of sequence similarity between D. rerio and P. moluccensis……………………………………..…….………………….20 The early gene expression response to heat stress……...…………………..22 Verification of microarray data using real-time PCR……...……………….27 Discussion……………………………………………..…………………………28 Interpreting results from heterologous microarray experiments………...…29 The early gene response to heat stress……………...………………………30 Conclusion………………………………………………….……………………33 CHAPTER 3 The transcriptional responses of a coral reef fish to stress: conservation of gene function responses but variable gene responses…….………..34 Abstract……………………………………………………….………………….34 Introduction………………………………………………………………………35. ix.
(12) Materials and Methods…………………………………………...………………37 Stress experiments…………………………………………………………..37 Microarray platform…………………………………..……………………38 Microarray analysis of stressed P. moluccensis…………………….……...38 Microarray data analysis and data mining…………………….…………...39 Identification of gene functions responsive to stress….…………………….42 Hierarchical clustering and visualisation of gene responses across stress treatments…………………………………………………………….…..42 Results…………………………………………….……………………………...43 The transcriptional responses to prolonged heat…………………………...43 The early gene responses to cold, heat, hypoxic, and hyposmotic stress…...53 The expression profile of stress-responsive genes across treatments…........55 Discussion…………………………………………………………….………….58 Common gene function responses elucidate how stress affects biological function in P. moluccensis……………...…………………..……………59 The gene expression response to prolonged heat………….……………......62 The early gene response to cold shock…………………………..….………64 The early gene response to moderate heat shock shock………….…………65 The early gene response to severe heat shock……….…………...…………65 Acclimation………………….……………………………….…..……….…66 The early gene response to hypoxia….…………………………..…………67 The early gene response to hyposmotic stress…………………………...…68 Strategies for managing and interpreting environmental genomic data.......69 Conclusion…………………………………………...…………………………..71 CHAPTER 4 Using inter-species genomic hybridisations to identify rapidly diverging genes………………………………………………….…………………..72 Abstract…………………………………..…………...………………………….72 Introduction……………………………………………...….....…………………73 Materials and Methods……………………………………..………………….…75 Inter-species genomic DNA hybridisation experiments……....…………….75 Microarray statistical data analysis and data mining……………………...76 Estimation of evolutionary rates across teleost lineages using tree branch lengths........................................................................................................78 x.
(13) Results……..…………………………………………………………………….80 Identification of rapidly diverging genes using inter-species genomic hybridisations............................................................................................80 Functions of rapidly diverging genes……………………………………….83 Evolutionary rates of these rapidly diverging genes in other teleosts..…….90 Discussion………………..………………………………………………………95 Analysis of inter-species genomic hybridisation experiments to identify rapidly diverging genes……………………...………………………......95 Relationship between rates of evolution and gene function........………..….97 Comparative genomics of teleosts…………………………….…………….99 Limitations of IGH experiments for the identification of rapidly diverging genes………….…………………………...……………………………..99 Outlook………………………………………………………………….…100 Conclusion………………………………………………...…...……………….101 CHAPTER 5 Modelling the stress response: molecular and physiological correlates and their evolutionary significance……………………….…………….103 Abstract………………………………………………...……………………….103 Introduction……………………………………………...……………………...104 Stress commonly leads to reduced cellular oxygen levels…………....……108 The endocrine system coordinates stress responses and affects rates of transcription…………..………………………………………………..108 Production of reactive oxygen species during cellular stress………..……110 Oxidative stress causes protein damage and induces a heat shock response………………………………………………..……………………….110 Insights from cell biology – activation of signal transduction pathways and immediate early genes during stress…………….......…………….112 The activation of NFκB, HIF-1α and other transcription factors during stress……………………………………...………………….………....114 An evolutionary perspective on the relationship between stress and adaptive evolution……………………………………….…….………..115 Stress and the effects of climate change on population viability….……….118. xi.
(14) CHAPTER 6 General Discussion………………………………………………….121 General Summary…………………………………………………………...….121 Summary and Discussion of Key Findings………………..…….…...………...122 The performance of heterologous microarray experiments...……………..122 Transcriptional responses of a coral reef fish to environmental stress..….123 The application of microarrays to identify rapidly diverging genes in nonmodel teleost species…………………………...……….……….....125 A conceptual model of the stress response…………………..…….……...126 Overall Conclusions and Future Directions……………………..……………..127 Bibliography…………………………………………………………………….…129 Appendix 1………………………………………………………………………...148 Appendix 2………………………………………………………………………...149 Appendix 3………………………………………………………………………...150 Appendix 4 to 6…………………………………………………………….……...160. xii.
(15) List of Tables CHAPTER 2 Table 1……………………………………………………………………………21 Table 2……………………………………………………………………………23 Table 3……………………………………………………………………………26 CHAPTER 3 Table 1……………………………………………………………………………46 Table 2……………………………………………………………………………51 Table 3……………………………………………………………………………52 Table 4……………………………………………………………………………54 Table 5……………………………………………………………………………57 CHAPTER 4 Table 1……………………………………………………………………………84 Table 2……………………………………………………………………………90 Table 3……………………………………………………………………………93. xiii.
(16) List of Figures CHAPTER 1 Figure 1……………………………………………………………………………6 Figure 2…………………………………………………………………………....6 CHAPTER 2 Figure 1…………………………………………………………………….….…16 Figure 2………………………………………………………………….……….25 Figure 3………………………………………………………………….……….25 Figure 4…………………………………………………………………………..27 CHAPTER 3 Figure 1…………………………………………………………………………..41 Figure 2…………………………………………………………………………..44 Figure 3…………………………………………………………………………..45 Figure 4…………………………………………………………………………..51 Figure 5…………………………………………………………………………..56 CHAPTER 4 Figure 1…………………………………………………………………………..79 Figure 2…………………………………………………………………………..81 Figure 3…………………………………………………………………………..82 Figure 4…………………………………………………………………………..82 Figure 5…………………………………………………………………………..83 Figure 6…………………………………………………………………………..92 CHAPTER 5 Figure 1…………...…………………………………………………………….107. xiv.
(17) CHAPTER. 1. General Introduction Current models of climate change predict a rise in sea surface temperatures of between 2ºC and 5ºC by the year 2100 (IPCC 2001, Done et al. 2003). Such increased temperatures can have adverse effects on coral reef organisms. For example, coral bleaching can occur when temperatures rise only 1ºC to 2ºC above normal values (Hoegh-Guldberg 1999). The predicted climate change, therefore, has the potential to induce significant physiological stress and mortality, and may drive shifts in geographic ranges (Parmesan and Yohe 2003). The potential of climate change to induce stress and alter animal function has already been investigated in a variety of organisms (Hoegh-Guldberg 1999, Etterson and Shaw 2001, Pörtner et al. 2001, Hoffmann et al. 2003, Stillman 2003, Somero 2005). But we currently lack data to predict the likely effects of elevated sea surface temperatures on the physiology of coral reef fishes. We, therefore, need to understand the extent to which rising temperatures will induce stress in these species and the capacity of these species to evolve resistance to such stresses. Stress may be regarded as a displacement from homeostasis (Johnson et al. 1992, Moberg 2000), causing a potentially injurious change in a biological system (Hoffmann and Parsons, 1991). The negative effects of stress manifest themselves at all levels of biological organisation. For example, the injurious effects of stress commonly include impairments of development, growth and reproduction (Hochachka and Somero 2002). In addition, stress can suppress immune functions, making the organism more prone to developing pathologies (Johnson et al. 1992, Moberg 2000). Stress further causes changes in cardio-respiratory, endocrine, cellular, and molecular functions (Johnson et al. 1992, Somero and Hofmann 1996, Bonga 1997, Feder and Hofmann 1999, Hochachka and Somero 2002, Pörtner 2002, Somero 2005). Finally, stress commonly leads to extensive changes in gene regulation (Gasch et al. 2000, Gracey et al. 2001, Buckley et al. 2003, Enjalbert et. 1.
(18) al. 2003, Williams et al. 2003b, Gracey et al. 2004, Koskinen et al. 2004, Podrabsky and Somero 2004, Yoshida et al. 2004, Krasnov et al. 2005). At present, however, understanding gene regulation during stress still poses many challenges. In particular, the significance of gene regulation for organismal function often remains unclear, because the interactions between physiological and transcriptional stress responses are not well understood. Thus far, reviews of stress responses have focused on individual aspects of the stress response in isolation (Johnson et al. 1992, Somero and Hofmann 1996, Bonga 1997, Feder and Hofmann 1999, Hochachka and Somero 2002, Pörtner 2002, Somero 2005). A conceptual model, which would synthesise data on different aspects of ‘the stress response’ (see, for example, Seyle 1936) and which would account for the key regulators of physiological and transcriptional stress responses and their main interactions, would add to our current understanding of stress responses. In this context, microarray technology and the assessment of gene regulation during stress have already provided new insights into the effects of stress on biological function. DNA microarrays for gene expression analysis were first developed in the mid 1990s (Schena et al. 1995). DNA microarrays have since found a broad range of applications, including functional genomic studies in ecology and evolution (Feder and Mitchell-Olds 2003). In functional genomic studies, and because genes are transcribed into RNA which is translated into proteins that carry out biological functions, assessment of the transcriptome can reveal how genetic information is translated into biological function. At present, however, there are few examples of the use of microarrays to understand gene regulation in coral reef organisms and these are currently limited to the study of gene responses in corals (e.g. Edge et al. 2005). The limited application of microarray technology to study coral reef organisms is likely due to the challenges associated with transferring this technology to species for which genomic resources, such as EST libraries or genome sequence data, are currently not available. In general, commercial microarrays are only available for widely studied species and species of interest to large research communities. Where there are no commercial microarrays available and for the study of non-model species, researchers wanting to apply microarray technology may pursue one of the following strategies. Firstly, 2.
(19) custom cDNA microarrays can be developed for any species of interest. The development of new cDNA microarrays requires the isolation and cloning of a cDNA library, which can then be PCR amplified and spotted onto microarray slides (Oleksiak et al. 2001). Clones that show interesting regulation during gene expression profiling are sequenced and the sequences are compared against genome databases to determine the identity of the clones. While the development of cDNA microarrays is, in principle, possible for all organisms, developing a new microarray is time-consuming and expensive. Given the broad range of species that are of interest to functional genomic studies, it is unlikely that microarrays will be developed for all these species any time soon. An alternative strategy to using a species-specific microarray is to use a microarray developed for a closely related species. Microarray experiments that are performed using a species other than the one for which the microarray was originally designed, are commonly referred to as heterologous microarray experiments. Human cDNA microarrays, for example, have been used to study bovine, pig and even salmon gene regulation (Medhora et al. 2002, Tsoi et al. 2003, Adjaye et al. 2004). Oligonucleotide microarrays can also be successfully applied in heterologous microarray experiments (Ji et al. 2004). In general, cross-hybridisation on microarrays is positively correlated with sequence similarity (Wu et al. 2001, Hinchliffe et al. 2003, Brunelle et al. 2004). The success of heterologous microarray experiments would thus depend on the ability of the heterologous DNA species to bind to the microarray, which is in turn determined by the level of sequence similarity between the two taxa. In general, microarray analysis is robust to some level of sequence divergence and genes with less than 25 percent sequence divergence generally show significant cross-hybridisation (Kane et al. 2000). With increasing sequence divergence, the ability to accurately measure gene regulation decreases (Renn et al. 2004). However, the level of sequence divergence differs across genes with some genes diverging more rapidly than others (Makalowski et al. 1996). Therefore, heterologous microarrays may be more successfully employed to measure gene responses at conserved gene loci, while genes that have diverged significantly may fail to cross-hybridise.. 3.
(20) For these reasons, heterologous microarray experiments are most suitable for gene discovery studies where the aim is to identify candidate genes for studies of gene regulation. In this context, loss of signal for some genes on the microarray would not compromise the aims of the study and genes with the most interesting gene regulation can be further validated using an alternative method, such as quantitative real-time PCR. In this thesis, I demonstrate that inter-species hybridisation experiments using genomic DNA can be used to identify which of the genes represented on a microarray are conserved enough to allow heterologous microarray analysis. For this purpose, genomic DNA (gDNA) is extracted from the species of interest and the species for which the microarray was designed and both gDNA samples are competitively hybridised to the microarray. Genes that share significant sequence similarity between the two species will produce even signal intensities, while genes with significant sequence divergence will show reduced signal intensities in the heterologous species. To my knowledge, this is the first study to use genomic hybridisation experiments to test the performance of a heterologous microarray platform. Typically, comparative genomic hybridisation experiments are used to identify gene copy number changes and chromosomal deletion and duplication events (Pollack et al. 1999). More recently, comparative genomic microarray experiments have also been used to compare sequence similarity across genomes and to identify rapidly diverging genes between closely related taxa (Kim et al. 2002, Hinchliffe et al. 2003, Brunelle et al. 2004). Rapidly diverging genes interest evolutionary biologists because genes with high rates of evolutionary change have been implicated in the process of speciation and species diversification (Turner et al. 2005, Harr 2006). Furthermore, high rates of evolutionary change may indicate strong directional selection and molecular adaptation, especially where selection on gene function can be directly related to environmental pressures (Tautz and Schmid 1998, Lecompte et al. 2001, Matzkin 2005, Fairhead and Dujon 2006). Examples of rapidly diverging genes include genes with functions in reproduction, especially in sperm competition and species recognition (Swanson and Vacquier 1998, Hellberg and Vacquier 1999, Swanson et al. 2001), and genes with functions in environmental interactions (Jordan et al. 2001, Clark et al. 2003). Rapidly diverging genes thus appear to be good candidates to study the mechanisms underlying molecular adaptation. 4.
(21) Thus far, the application of microarray technology for the identification of rapidly diverging genes has been restricted to the study of microbial and fungal genomes (Hinchliffe et al. 2003, Brunelle et al. 2004, Le Quere et al. 2006). However, microarray approaches for the identification of rapidly diverging genes should be feasible for any organism and are of particular interest for application in species with few genomic resources. Such species do not lend themselves to bioinformatic approaches for the identification of rapidly diverging genes because of a lack of genome sequence data. The potential of comparative genomic hybridisation experiments on microarrays to identify rapidly diverging genes across a broader range of organisms thus warrants further investigation. Because of their ability to screen thousands of gene transcripts and gene sequences at once, microarrays are an attractive tool for environmental genomic and comparative genomic studies. As outlined above, there are two main applications of microarray technology in ecology and evolution. Firstly, microarrays can be used to assess the transcriptome and to measure gene regulation, for example during conditions of environmental stress (Figure 1). Since the transcriptome is the mediator between the genome and the proteome, understanding of the transcriptome can contribute to our understanding of how genetic information is translated into biological function. Secondly, microarrays can be used to assess the genome itself, to understand sequence divergence, and to identify those genes, which can be measured in heterologous microarray experiments (Figure 1). The latter is a novel application of microarray technology developed as part of this PhD research. The coral reef fish Pomacentrus moluccensis is an abundant damselfish species on the Great Barrier Reef (Figure 2). This species is particularly amenable to housing in aquaria and, therefore, is a suitable species on which to perform environmental stress experiments and to investigate the effects of heat on gene regulation in coral reef fishes. However, there are currently no genomic resources or microarrays available for P. moluccensis or any other species of coral reef fishes.. 5.
(22) Figure 1 Applications of microarray technology in ecology and evolution.. Figure 2 The coral reef fish Pomacentrus moluccensis on the Great Barrier Reef, Australia.. 6.
(23) In contrast, the zebrafish Danio rerio has been widely studied, its genome has been completely sequenced, and there is an olignucleotide (65mers) microarray available for this species consisting of nearly 16,000 gene products. This D. rerio microarray is one of the largest teleost microarrays available and would, therefore, offer the best chance of detecting large numbers of genes involved in environmental stress responses. Because the D. rerio microarray has been computationally designed and is widely used in the zebrafish research community, the identity of the clones represented on the microarray is known and there are continuing efforts into improving the annotation of this microarray. For these reasons, the D. rerio microarray was an obvious choice to elucidate environmental stress responses in coral reef fishes. The specific aims of this PhD research were: 1. To examine strategies for how microarray technology can be applied to the study of non-model species and, specifically, to test the performance of the D. rerio microarray to study gene regulation in the coral reef fish P. moluccensis. 2. To apply heterologous microarray experiments to study environmental stress responses in P. moluccensis, in particular transcriptional responses to heat stress. 3. To apply comparative genomic hybridisation experiments and bioinformatic approaches to identify rapidly diverging genes in teleosts. 4. To develop a conceptual model of the key regulators of organismal, cellular, molecular, and transcriptional responses to stress and their main interactions. This thesis is structured as a series of stand-alone but conceptually interconnected publications. In Chapter 2, I report on the utility of a D. rerio microarray for measuring gene regulation in P. moluccensis. I demonstrate that inter-species genomic hybridisation experiments can identify which genes can be measured in microarray analysis across species. In order to test the performance of the heterologous microarray to measure gene regulation in P. moluccensis, I further validate differential gene expression for a selection of candidate genes using quantitative real-time PCR.. 7.
(24) In Chapter 3, I report heterologous microarray experiments designed to study environmental stress responses in P. moluccensis, in particular transcriptional responses to heat stress. This is the first study to investigate the effects of elevated temperatures on gene regulation in a coral reef fish. In order to understand the generality of transcriptional responses to heat, I examine how different types and severities of stress affect gene regulation. For this purpose, I designed a series of experiments, which allowed me to assess the effects of different dimensions of stress on gene regulation. Throughout this thesis I use the term ‘stress’ to refer to some form of disturbance from homeostasis or normal biological function. Hence, genes that change expression level following different treatments indicate a change in biological function; the treatment is thus considered a ‘stressor’; and the change in gene expression is considered to form part of the ‘stress response’. In Chapter 4, I report on inter-species genomic DNA hybridisation experiments designed to identify rapidly diverging genes between P. moluccensis and D. rerio. I develop a cut-off threshold based on relative signal intensities to distinguish between relatively conserved and rapidly diverging genes. I examine the functions of rapidly diverging genes and test for an over-representation of gene functions amongst rapidly diverging genes. In addition, I test whether genes identified as rapidly diverging between P. moluccensis and D. rerio by means of comparative genomic microarray experiments generally show high rates of sequence evolution in teleosts. For this purpose, I used a bioinformatic approach and obtained orthologous sequences to D. rerio for the teleosts Takifugu rubripes and Gasterosteus aculeatus. I estimated rates of sequence evolution based on tree branch lengths and the number of nucleotide changes per site. In Chapter 5, I review current literature on physiological, endocrine, cellular, molecular, and transcriptional responses to stress and develop a conceptual model of the interactions between these different levels of biological organisation. I identify key players of the stress response and their main interactions. Lastly, in Chapter 6, I summarise and discuss the main findings and conclusions of this PhD thesis. I discuss questions that remain in our understanding of environmental stress responses and point out areas of potential future research.. 8.
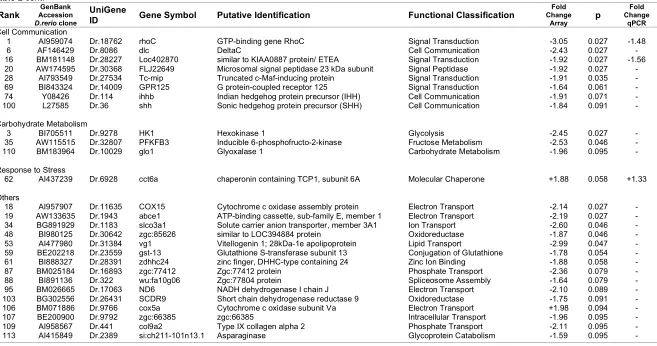
(25) CHAPTER. 2. Heterologous microarray experiments used to identify the early gene response to heat stress in a coral reef fish. Publication: Kassahn KS, Caley MJ, Ward AC, Connolly AR, Stone G, Crozier RH. (In press) Heterologous microarray experiments used to identify the early gene response to heat stress in a coral reef fish. Molecular Ecology.. Abstract Coral reef fishes are expected to experience a rise in sea surface temperatures due to climate change. How well tropical reef fishes will respond to increased temperatures and which genes are important in the response to elevated temperatures is not known. Microarray technology provides a powerful tool for gene discovery studies, but the development of microarrays for individual species can be expensive and timeconsuming. In this study, I tested the suitability of a Danio rerio oligonucleotide microarray for application in a species with few genomic resources, the coral reef fish Pomacentrus moluccensis. Results from a comparative genomic hybridisation experiment and direct sequence comparisons indicate that for most genes there is considerable sequence similarity between the two species, suggesting that the D. rerio microarray is useful for genomic studies of P. moluccensis. I employed a heterologous microarray approach to characterise the early transcriptional responses to heat stress in P. moluccensis. A total of 111 gene loci, many of which are involved in protein processing, transcription, and cell growth, showed significant changes in transcript abundance following exposure to elevated temperatures. Changes in transcript abundance were validated for a selection of candidate genes using quantitative real-time PCR. This study demonstrates that heterologous microarrays can be successfully employed to study species for which specific microarrays have. 9.
(26) not yet been developed, and so have the potential to greatly enhance the utility of microarray technology to the field of environmental and functional genomics.. Introduction Current models of climate change predict a rise in sea surface temperatures of between 2ºC and 5ºC by the year 2100 (IPCC 2001, Done et al. 2003). Such increased temperatures can have adverse effects on coral reef organisms. For example, coral bleaching can occur when temperatures rise only 1ºC to 2ºC above normal values (Hoegh-Guldberg 1999). The predicted climate change, therefore, has the potential to induce significant physiological stress and mortality, and may drive shifts in geographic ranges (Parmesan and Yohe 2003). To predict the effects of rising sea surface temperatures on reef species, we need to understand the extent to which rising temperatures will induce stress in these species and the capacity of these species to evolve resistance to such stresses. While the responses of coral reef fishes to temperature stress are poorly understood, temperature stress responses in temperate fishes include changes in gene expression, which vary depending on the type and duration of the stress. For example, constant high, constant low and fluctuating temperatures initiate different transcriptional responses in the eurythermal killifish (Austrofundulus limnaeus) (Podrabsky and Somero 2004). In channel catfish (Ictalurus punctatus), cold stress initiates rapid expression changes at a large number of loci (Ju et al. 2002), and the transcriptional response to cold stress in common carp (Cyprinus carpio) appears to resemble that observed during muscular atrophy (Gracey et al. 2004). Acclimation to seasonal temperature shifts in temperate fishes also entails changes in gene expression. The expression of warm temperature acclimation-related protein (Wap65) increases in summer-acclimated goldfish (Carassius auratus) (Kikuchi et al. 1995) and in warmacclimated populations of the salt-water minnow (Fundulus heteroclitus) (Picard and Schulte 2004). Similarly, the expression of β-actin and 5.8 rRNA increases during seasonal acclimation to higher temperatures in common carp (Vera et al. 1997, Sarmiento et al. 2000). Gene expression changes in response to temperature stress are thought to help maintain cellular homeostasis and function during altered environmental conditions (Gabai and Sherman 2002, Sonna et al. 2002). 10.
(27) Microarray technology has become a powerful tool for studying stress-related gene expression responses in teleosts because it allows screening of a large proportion of the transcriptome (Gracey et al. 2001, Williams et al. 2003, Gracey et al. 2004, Koskinen et al. 2004, Picard and Schulte 2004, Podrabsky and Somero 2004, Krasnov et al. 2005). In some cases where a species-specific microarray has not been available, microarrays developed for a related species have been used effectively (Girke et al. 2000, Hittel and Storey 2001, Nowrousian et al. 2005). Currently, however, there are only a few examples of cross-species microarray experiments in teleosts and these are limited to cDNA arrays (Hogstrand et al. 2002, Tsoi et al. 2003, Renn et al. 2004, Rise et al. 2004, Aubin-Horth et al. 2005). Oligonucleotide arrays may provide increased specificity and sensitivity as the oligos deposited on the array can be especially designed for this purpose (Kane et al. 2000, Irizarry et al. 2005). There are currently no examples of cross-species microarray experiments using long oligonucleotide microarrays. Given the potential utility of microarrays for understanding stress responses in tropical reef species and the low probability of the development of species-specific microarrays for these species in the near future, the potential to successfully perform heterologous hybridisations on different microarray platforms warrants further investigation. In this study, I test the suitability of an oligonucleotide microarray developed for the zebrafish Danio rerio to measure gene responses in the coral reef fish Pomacentrus moluccensis. The most recent common ancestor of P. moluccensis (Perciformes, Acanthopterygii, Teleostei) and D. rerio (Cypriniformes, Ostariophysi, Teleostei) dates from between 110 and 300 million years ago (Cantatore et al. 1994, Wittbrodt et al. 2002). Therefore, successful cross-hybridisation of P. moluccensis to the D. rerio microarray would depend on significant sequence conservation. Sequence similarity between D. rerio and P. moluccensis was estimated by direct sequence comparison and by performing a comparative genomic hybridisation experiment where genomic DNA from D. rerio and P. moluccensis was competitively hybridised to the D. rerio microarray. I then employed this heterologous microarray approach to compare the transcriptome of heat-stressed P. moluccensis to that of P. moluccensis kept at ambient temperature. The expression changes were further tested for a selection of candidate genes using quantitative real-time PCR. Based on these results. 11.
(28) I evaluate the utility of heterologous hybridisations on long oligonucleotide microarrays and discuss the early gene response of P. moluccensis to heat stress.. Materials and Methods Thermal stress experiments Adult P. moluccensis were collected around Lizard Island, northern Great Barrier Reef, Australia (14º40’S, 145º28’E) by divers on SCUBA using barrier and scoop nets and transferred to the Lizard Island Research Station. Fish were housed in groups of up to 20 individuals in aquaria supplied with flow-through seawater at ambient temperature (approximately 26ºC). Sections of PVC pipes and dead branching coral were provided for shelter. After two days of acclimation to these conditions, animals were transferred for three hours to individual tanks containing water of either 34ºC (thermal stress) or 26ºC (ambient, control). Previous studies have shown that the transcriptional response to temperature stress in teleosts starts within hours after exposure (Ju et al. 2002, Podrabsky and Somero 2004), suggesting that a relatively short exposure to heat stress should lead to measurable changes in gene expression. It is possible that handling and capture stress amplified the effects of the heat stress treatment. However, fish that were kept at ambient temperature would have also suffered from the same handling and capture stress. It is likely, therefore, that the differences between treatments observed here are mainly associated with the effects of heat stress. Following these thermal treatments, fish were killed by placing them on ice. Livers were excised and stored in RNAlater™ (Qiagen) for microarray and quantitative real-time PCR analysis. Gonads were preserved in FAAC (formaldehyde 4%, acetic acid 5%, calcium chloride 1.3%) so the fish could be sexed. In teleost fishes, gene expression can vary considerably between the sexes with females showing larger inter-individual variation than males (Williams et al. 2003). Because such inter-individual variation could obscure the identification of those genes involved in the stress response, we restricted our analyses to adult male fish of similar standard length (46 ± 4 mm).. 12.
(29) Microarray platform Because there is currently no microarray available for any species of pomacentrid fish (family Pomacentridae), I tested the suitability of a D. rerio microarray for application in P. moluccensis. I used the Compugen 16K D. rerio oligonucleotide microarray, which contains 16,399 oligos (65-oligomers) representing 15,806 unique D. rerio gene clusters plus controls. This array platform represents one of the largest fish microarrays available and therefore offered the greatest chance of detecting large numbers of genes involved in temperature stress responses. The arrays were printed by the Adelaide Microarray Facility. The list of genes immobilized on the array is available at http://www.microarray.adelaide.edu.au/libraries/microarrays.html. Comparative genomic DNA hybridisation experiment In order to assess the hybridisation potential of P. moluccensis DNA to the D. rerio microarray, I performed four comparative genomic DNA hybridisations on D. rerio microarrays. Genomic DNA was extracted from fish caudal fins of both species using. CTAB. (Murray. and. Thompson. 1980). and. quantified. using. a. spectrophotometer. Five µg of gDNA per sample was digested with DpnII and labelled using the BioPrime®Plus Array CGH Genomic Labeling System (Invitrogen). In order to account for potential dye bias, dye usage was swapped between P. moluccensis and D. rerio gDNA samples. Genomic DNA from three individuals of D. rerio were pooled. Four biological replicates of P. moluccensis gDNA were each mixed with an aliquot of fluorescently labelled D. rerio pooled gDNA. Each of the four gDNA mixtures was hybridised to an individual D. rerio microarray. Prior to hybridisation, each microarray slide was immersed in distilled water at 60ºC for 5min and dried by centrifugation at 650 x g for 5min. Fifty µg of human Cot-1 was added to each labelled gDNA sample, dried under reduced pressure, resuspended in 14µl formamide and 14µl of 6.25 X SSC, denatured by heating to 100ºC for 3min and transferred directly to ice. Finally, 0.6µl of 10% SDS was added to each sample. The probes were applied to the array and incubated at 42ºC overnight in a humidified chamber. The arrays were washed in 0.5 X SSC containing 0.01% SDS for 1min, 0.5 X SSC for 3min and 0.2 X SSC for 3min. The slides were scanned using an Axon 4000B microarray scanner. Single image .tif files were saved for data analysis. 13.
(30) Microarray analysis of heat-stressed P. moluccensis Total RNA from liver tissue of heat-stressed P. moluccensis and P. moluccensis kept at ambient temperature was extracted using TRIzol® (Invitrogen) according to the manufacturer’s instructions and purified using RNeasy™ columns (Qiagen), ethanolprecipitated and subsequently resuspended in nuclease-free water. The concentration and purity of RNA was determined by spectrophotometer readings at 260nm and 280nm. The integrity of the RNA was confirmed by agarose gel electrophoresis. Forty µg of total RNA was mixed with 4µg of anchored polyT(V)N and 0.5µg of random hexamers, and incubated at 70ºC for 10min. The samples were placed on ice and mixed with 6µl of 5X Superscript II buffer (Invitrogen), 2µl of 0.1M dithiothreitol (DTT), 2µl of Superscript II (200U/µl) (Invitrogen) and 0.6µl of aminoallyl (aa) dNTP mix (25mM dATP, 25mM dGTP, 25mM dCTP, 10mM dTTP and 15mM aa dUTP). After incubation at 42ºC for 2.5 hours, residual RNA was hydrolysed in 10µl of 0.25M NaOH and 10µl of 0.5M EDTA (pH 8.0) by incubating at 65ºC for 15min. The reactions were neutralised by adding 15µl of 0.2M acetic acid and purified using a QIAquick PCR purification kit (Qiagen). The purified cDNA was dried under reduced pressure, dissolved in 9µl of 0.1M NaHCO3 (pH 9.0), mixed with Cy3 or Cy5 and left in the dark to couple at room temperature for 60min. The labelled cDNA was mixed with 41µl of MilliQ water and purified using a QIAquick PCR purification kit (Qiagen). The purified fluorescently labelled cDNA samples were eluted into a clean tube with 90µl of MilliQ water and dried under reduced pressure. Equal amounts of RNA samples from four P. moluccensis kept at ambient temperature were pooled and used as a common reference. Labelled cDNA from four heat-stressed P. moluccensis was competitively hybridised against the pooled control in four microarray hybridisations using dye swaps. Microarray hybridisations of labelled cDNA were performed as described for the gDNA samples above except that 2.5µg human Cot-1 and 4µg poly A were added to each labelled cDNA sample. Microarray statistical data analysis and data mining The Cy5 and Cy3 fluorescent signal intensity of each gene on the array was extracted using SPOT software (CSIRO Mathematical and Information Sciences, Australia).. 14.
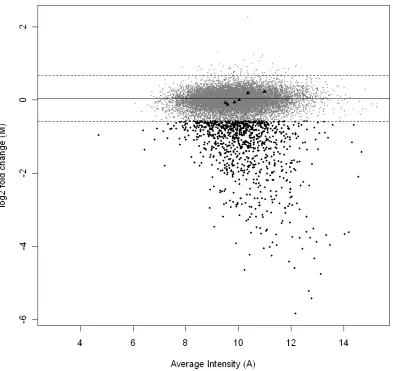
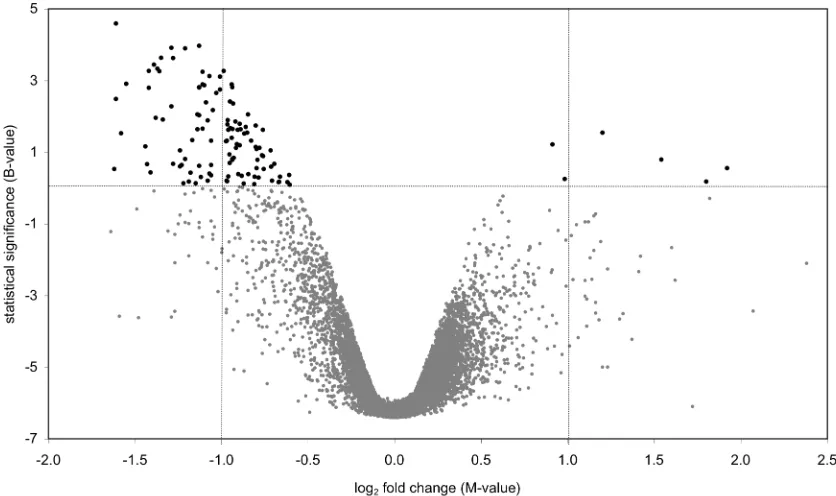
(31) The background fluorescence was subtracted and the ratio of the resultant signal intensities (Cy5/Cy3) was log2-transformed. Statistical analyses were performed using the software package LIMMA implemented in the R statistical software environment (Smyth 2005), following Smyth (2004). The transformed signal intensities of each grid on the array and global signal intensity were print-tip Loess normalised (Smyth and Speed 2003), and scale normalised between arrays. Loess normalisation subtracts a Loess regression curve from the data in order to linearise the data, while scale normalisation between arrays ensures that signal intensities are comparable across arrays. Pomacentrus moluccensis gDNA will not preferentially hybridise to a D. rerio oligonucleotide microarray in the presence of D. rerio gDNA. I was, therefore, able to measure the random noise in the comparative genomic hybridisation experiment by using spots with positive M-values (Figure 1). Due to the Loess normalisation discussed above potentially shifting the M-value corresponding to equal hybridisation away from M=0, I used the modal M-value, estimated from a density estimate of M-values, as the centre of the distribution. The 99th percentile of spots with M-values greater than this mode was taken as a threshold to decide which spots had poorly hybridised with the P. moluccensis gDNA and spots with M-values that exceeded this threshold below the mode were flagged as such (Figure 1). Genes with negative M-values outside this range are attributed to D. rerio gDNA hybridising in preference to P. moluccensis gDNA due to sequence divergence between the two taxa. In contrast, genes that lie within the 99th percentile show similar hybridisation signal in P. moluccensis and D. rerio and are thus considered to share significant sequence similarity in the two taxa. Although I take no account of variability amongst replicates and the 99th percentile is somewhat arbitrarily chosen, this approach identifies more spots as poorly hybridised than several other methods I have considered (see Chapter 4). Ultimately, the purpose of the comparative genomic hybridisation experiment was to identify any spots that show any evidence of reduced hybridisation when using P. moluccensis on the D. rerio microarray. Spots identified in this way were excluded from further analysis of the gene expression data. This approach provides a conservative estimate of the number of genes involved in the heat stress response of P. moluccensis.. 15.
(32) Figure 1 The plot illustrates the relative signal intensity difference between Pomacentrus moluccensis and Danio rerio against average signal intensity A. Each dot represents one of the 15,806 genes represented on the microarray. The solid line represents the modal Mvalue of the distribution of M-values. The dashed lines represent the M-value corresponding th to the 99 percentile of positive M-values and its extrapolation towards negative M-values. Genes that show reduced hybridisation signal for P. moluccensis as compared to D. rerio have negative M-values that fall below this threshold (). MA values for six nuclear gene loci that are known to have high sequence identity between P. moluccensis and D. rerio are also marked (▲).. 16.
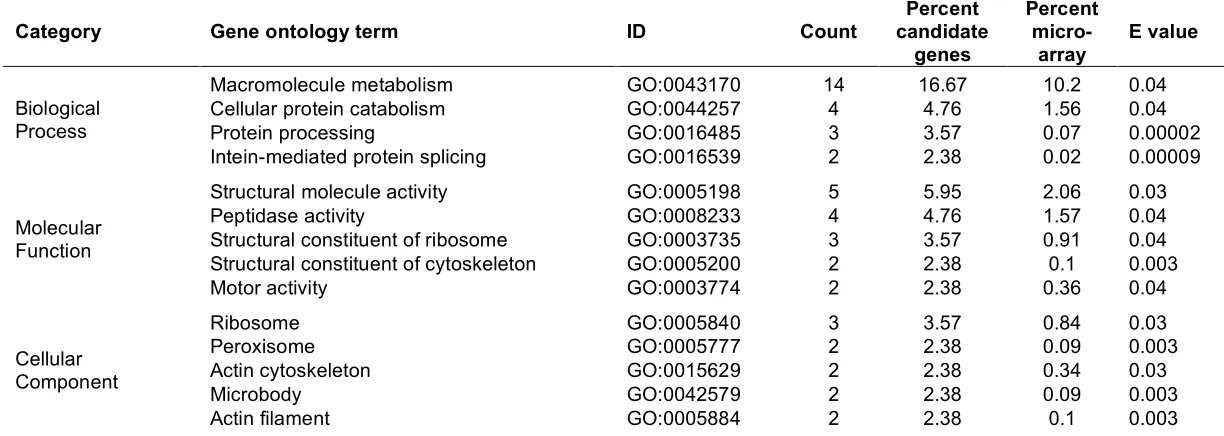
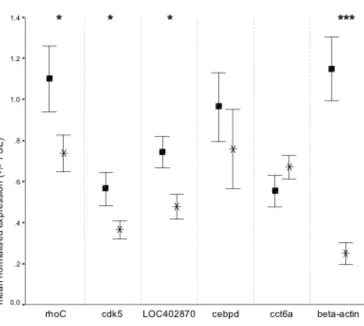
(33) For analysis of the gene expression data, a moderated t-statistic was calculated for each gene on the array employing an empirical Bayes method (Smyth 2004). This method uses the information from all genes represented on the array in order to moderate the standard errors of the estimated expression changes for each individual gene. This approach results in more stable inference and improved power and is particularly useful for experiments with small numbers of arrays (Smyth 2004). Benjamini and Hochberg’s (1995) method for controlling the false discovery rate (FDR) was used to control experiment-wise error rates in the face of multiple testing. Genes with FDR-adjusted p-values < 0.1 were considered differentially expressed. The raw microarray data on which these analyses are based is deposited at the Gene Expression Omnibus website (http://www.ncbi.nlm.nih.gov/projects/geo/; Barrett et al. (2005)) under the following accessions: GPL3365 (microarray platform), GSE4047 (data series), GSM104737, GSM104739, GSM104741, GSM104742, and GSM92653 to GSM92656 (samples). The raw image .tif files can be downloaded at ftp://ftp.ncbi.nih.gov/pub/geo/DATA/ supplementary/samples/. Gene annotation was performed using the program Resourcerer 12.0 (Tsai et al. 2001). Gene function of identified candidate genes was estimated by gene functions determined for D. rerio using a combination of AmiGo (The Gene Ontology Consortium. 2000). (http://www.godatabase.org/cgi-bin/amigo/go.cgi),. iHop. (http://www.pdg.cnb.uam.es/UniPub/iHOP/) (Hoffmann and Valencia 2004), and databases at NCBI (http://www.ncbi.nlm.nih.gov/). Overrepresentation of gene ontologies in candidate genes compared to the total of genes represented on the microarray was tested using the program The Ontologizer 2.0 (Robinson et al. 2004) and data files downloaded from the Gene Ontology (gene_ontology.obo accessed September 27, 2005; http://www.geneontology.org/) and the Zebrafish Information Network. (gene_association.zfin. September. 21,. 2005;. http://zfin.org/cgi-. bin/webdriver?MIval=aa-ZDB_home.apg).. Quantitative real-time PCR verification of array data In order to independently verify that candidate genes for heat stress identified in the heterologous microarray experiments were differentially expressed, I performed quantitative real-time PCR on six candidate genes. These genes were chosen because. 17.
(34) their reported gene function made them interesting candidates, and because combined they represent a variety of functional classes. With the exception of βactin, degenerate primers to amplify the selected candidate genes in P. moluccensis were. designed. using. BlockMaker. and. CODEHOP. (http://blocks.fhcrc.org/codehop.html) (Rose et al. 1998, Rose et al. 2003) and sequence information available on GenBank for other vertebrates. For β-actin I used the primers of Forlano et al. (2005) (Appendix 1). Where possible, PCR amplification targeted the same gene region that was represented by the oligo on the microarray. However, the choice of gene region for PCR amplification also depended on sequence information available in GenBank and the availability of suitable priming sites. Gene fragments of 217bp to 729bp per gene were amplified using cDNA synthesised with oligo dT primers. PCR products were cloned into pGEM®-T Easy Vector Systems (Promega) following the manufacturer’s instructions. Clones were sequenced using DYEnamic™ ET Dye Terminator (GE Healthcare) on an ABI 377 automated sequencer. Sequence homology to genes of interest was confirmed using BLASTX search, translated query vs. protein database, on the NCBI website (all E values ≤ 3e-24, Appendix 1). Real-time PCR primers specific for P. moluccensis were designed using a combination of Primer Express® Software v.2.0 (Applied Biosystems) and Primer 3 (http://frodo.wi.mit.edu/cgibin/primer3/primer3_www.cgi) (Rozen and. Skaletsky 2000) following the. recommendations of Bustin (2000) and Giulietti et al. (2001), in particular with respect to primer annealing temperature and amplicon length (Appendix 2). Samples for quantitative real-time PCR data validation consisted of the same RNA samples employed in the microarray experiment, except for one control sample, which had been completely used during microarray analysis and hence was not available for the real-time PCR assay. In order to maximise sample sizes for quantitative real-time PCR, RNA from five non-stressed fish and two heat-stressed fish that had not been used in the microarray experiment were added to the sample pool, resulting in a total of eight and six samples from non-stressed and heat-stressed individuals, respectively. All RNA samples were treated with DNA-free™ DNase Treatment and Removal Reagents (Ambion) in order to remove any contamination with genomic DNA. The absence of genomic DNA contamination after DNase treatment was confirmed by the absence of bands following PCR with β-actin 18.
(35) genomic DNA primers. The quality and quantity of total RNA was assessed using spectrophotometry and formaldehyde-agarose gel electrophoresis. 1µg of total RNA was used for cDNA synthesis using oligo dT primers and the SuperScript™ III FirstStrand Synthesis System for RT-PCR (Invitrogen) following the manufacturer’s instructions. After treatment with RNase H, cDNA samples were cleaned of free nucleotides and enzyme using QIAquick PCR clean-up columns (Qiagen) and eluted in 30µl of nuclease free water. The amount of cDNA was quantified using spectrophotometry. PCR reactions were done in duplicate using a Corbett Robotics CAS-1200™ and run on a Corbett Research Rotor-Gene™ 3000. PCR reactions were carried out in a final volume of 15µl containing 7.5µl SYBR Green PCR Master Mix (Applied Biosystems), 5ng of cDNA, and between 50nM and 900nM forward and reverse primers. Optimum primer concentrations for each gene were determined using different combinations of 50nM, 300nM, and 900nM forward and reverse primers (Appendix 2). In order to reduce between-run variability, the same dilution of cDNA samples and the standard were used in each PCR run. PCR conditions were one cycle of 95ºC for 10min, followed by 40 cycles of 95ºC 15sec and 60ºC 1min. During each of the 40 cycles the fluorescence was acquired at the end of the 60ºC step. The PCR run was followed by a melt curve analysis in order to confirm amplification of specific product only. Negative controls for PCR reactions included RNA that had not been reverse-transcribed as well as no-template controls. The amount of cDNA was quantified using the standard curve method. Each PCR run included serial dilutions of the cDNA sample designated as standard, ranging from 10ng cDNA to 0.05ng cDNA. PCR efficiencies (E) were calculated using the dilution series of the standard and the formula E = 10. (-1/slope). implemented in the. program REST (Pfaffl et al. 2002). PCR efficiencies ranged between 1.90 and 2.06 with R2 values between 0.994 and 0.999 indicating good PCR performance for all loci. Two commonly used housekeeping genes, 18S rRNA and hypoxanthineguanine phosphoribosyl transferase (HPRT), were also amplified for each sample for use as endogenous controls. The program BestKeeper by Pfaffl et al. (2004) and notnormalised results from the randomisation test in REST© were used to test the stability of the two housekeeping genes. Both, HPRT and 18S were suitable reference genes based on their invariant expression amongst control and treatment samples and the significant correlation between HPRT and 18S values. For relative. 19.
(36) quantification, the real-time PCR data were normalised to the geometric mean of 18S and HPRT following the method of Vandesompele et al. (2002). The non-parametric Mann Whitney U test for two independent samples was used to test for significant differences in group means between heat-stressed and non-stressed fish.. Direct sequence comparison between D. rerio and P. moluccensis As part of designing the real-time PCR assay, I sequenced segments of the coding region of eight nuclear gene loci in P. moluccensis. I was thus able to directly compare sequence identity between P. moluccensis and D. rerio at these loci. The D. rerio data consisted of the clone sequences represented on the microarray and sequence data downloaded from GenBank. Sequences were aligned using Se-Al v2.0a11 (Rambaut 1996) and sequence identity was calculated using MEGA 3.1 (Kumar et al. 2004).. Results Estimation of sequence identity between D. rerio and P. moluccensis Direct sequence comparison between D. rerio and P. moluccensis at eight nuclear gene loci revealed, on average, 81% DNA sequence identity (Table 1, see Appendix 3 for sequence alignments). The below average level of sequence identity at locus cebpd was due to 18 codon insertions and two codon deletions. Six of the eight nuclear gene loci sequenced were represented on the microarray. The M-values for these six loci did not exceed the threshold for M-values set in the comparative genomic hybridisation experiment, indicating that hybridisation to the D. rerio array at these loci was comparable for the two species (Figure 1). I have therefore demonstrated that genes with high sequence identity between P. moluccensis and D. rerio produce similar fluorescent signals in both species when competitively hybridised to the D. rerio array.. 20.
Figure

+7

Related documents
The Malmquist productivity index, for example, recently used in tourism to measure tourism productivity (Barros, 2005, Gracolici et al. 2007; Peypoch, 2008) is an
(NAM) is an effective and successful procedure enabling the the alveolar segments to increase the overall procedural success in cleft routine at certain centers in western
NEUROIMAGING IN OCULAR MOTOR CRANIAL NERVE PALSIES.. DISSERTATION
If the hemoglobin concentration and red cell indices do not return to normal, then further investigation may be done (9) ... Microcytic hypochromic anemia is mostly
Following epithelial differentiation, genome amplification and differentiation-dependent late gene expression were ob- served in mutant cell lines, but at a rate significantly
The cell e.s.d.'s are taken into account individually in the estimation of e.s.d.'s in distances, angles and torsion angles; correlations between e.s.d.'s in cell parameters are
This difference between both the groups was statistically significant p <0.05, suggesting that the latency period was longer in the group of pregnant women
As in the case of astemizole tetrachlorocuprate(II) (Parvez & Braitenbach, 2000), the phenylethyl C atoms are disordered over C20±C27 and C20 0 ±C27 0 , indicating the presence
