E
d
u
ca
tio
n
BEHAVIOUR IN SCOTTISH SCHOOLS
Anne Wilkin; Helen Moor; Jenny Murfield; Kay Kinder and Fiona Johnson
National Foundation for Educational Research
Scottish Executive Social Research
2006
The views expressed in the report are those of the author(s) and do not necessarily reflect those of the Scottish Executive or any other organisation(s) by which the author(s) is/are employed.
The Scottish Executive is making this research report available on-line in order to provide access to its contents for those interested in the subject. The Executive commissioned the research but has not exercised editorial control over the report.
This web only report is accompanied by the Insight document "Behaviour in Scottish Schools", available both on-line and in printed form.
Both reports are published by Information and Analytical Services Division, Scottish Executive Education Department, Victoria Quay, Edinburgh, EH6 6QQ. If you have any enquiries about these reports please contact the Dissemination Officer on 0131-244-0894.
ACKNOWLEDGEMENTS
The authors would like to thank the local authority personnel who gave up their time to be interviewed for the research. We would like to express our thanks to staff in the schools who were involved in the piloting stage of the research. We are particularly grateful for the contributions of staff in the survey sample of schools who completed questionnaires for us, and of school staff who attended the focus group sessions. The research team would also like to thank the pupils in the seven schools that participated in the pupil survey and pupil focus groups, and the member of staff interviewed in each of the seven schools.
Our thanks also go to members of the Steering Group at the Scottish Executive for their invaluable advice and support throughout the study.
CONTENTS
EXECUTIVE SUMMARY i
CHAPTER ONE INTRODUCTION 1
Background 1
The study 2
The report 7
CHAPTER TWO OVERVIEW 9
Introduction 9
How serious a problem is indiscipline? 9
Trends and patterns 15
Violence in school 18
Influence of national policy 19
Summary 20
PART ONE BEHAVIOUR IN THE CLASSROOM 22
CHAPTER THREE POSITIVE BEHAVIOUR IN THE CLASSROOM 23
Introduction 23
How well behaved are pupils in lessons 23
What sort of positive behaviour is in evidence during lessons 25
Summary 30
CHAPTER FOUR NEGATIVE BEHAVIOUR IN THE CLASSROOM 31
Introduction 31
How badly behaved or difficult to deal with are pupils in lessons? 31 What sort of negative behaviour is in evidence during lessons? 33 Are some classes more challenging than others? 43 What impact does poor behaviour in lessons have on staff, on pupils, on learning? 45
Summary 48
PART TWO BEHAVIOUR AROUND THE SCHOOL AND WITHIN THE LOCAL
COMMUNITY 51
CHAPTER FIVE POSITIVE BEHAVIOUR AROUND THE SCHOOL 52
Introduction 52
How well behaved are pupils around the school? 52 What sort of positive behaviour is in evidence around the school? 54
Summary 57
CHAPTER SIX NEGATIVE BEHAVIOUR AROUND THE SCHOOL AND WITHIN THE
LOCAL COMMUNITY 58
Introduction 58
How badly behaved or difficult to deal with are pupils around school 58 What sort of negative behaviour is in evidence around the school 59
How typical is that negative behaviour? 62
What impact does poor behaviour around the school have on staff and pupils 63 Complaints about pupil behaviour from the general public, local community or the media 65
Violence in school 67
PART THREE EFFECTIVE PRACTICE IN MANAGING BEHAVIOUR 78
CHAPTER SEVEN APPROACHES TO MANAGING BEHAVIOUR 79
Introduction 79
Approaches to encourage positive behaviour and overcome negative behaviour 79 Involvement of the local community in developing these strategies 87
Effectiveness of these approaches 93
Supportiveness of parents 100
Summary 103
CHAPTER EIGHT SUPPORT AVAILABLE FOR STAFF 105
Introduction 105
Local authority support 105
School-level support 110
Summary 116
CHAPTER NINE CONCLUSION 118
ANNEX 1 THE INTERVIEW SCHEDULES 120
Local authority telephone interview schedule 120 Case-study interview schedule for school staff 122 Case-study focus group schedule for school staff 123
Case-study focus group schedule for pupils 125
ANNEX 2 THE QUESTIONNAIRES 126
i
EXECUTIVE SUMMARY
Introduction
1. Pupil behaviour in schools has been an issue of concern for many years and the
subject of extensive research. Better Behaviour – Better Learning (Scottish Executive, 2001)
recognised the challenges that teachers and other professionals face, and acknowledged the wide-ranging causes of indiscipline. In light of this, funding was made available across Scotland for the implementation of the report’s 36 recommendations.
2. As a result of the recommendations, the Scottish Executive committed to supporting a
range of initiatives, as well as making resources available for professional development
purposes. The Policy Update on Behaviour in Scottish Schools (Scottish Executive, 2004a)
concluded that progress had been made in implementing the recommendations of the former report and recommended developing further approaches to prevent, and respond to, pupil-on-pupil violence or aggression. The Scottish Executive committed to instituting ‘regular major surveys of teachers’ and pupils’ experiences and perceptions of behaviour and discipline in schools’ (Scottish Executive, 2004a).
3. The main aims of the current study were: to provide clear and robust information on
the nature and extent of behaviour (including positive behaviour) in publicly funded schools in Scotland; to examine what is effective in preventing and responding to indiscipline; and to examine what is effective in promoting positive behaviour.
4. The study was designed to build on previous work conducted by Edinburgh
University, but to expand its scope. Thus, in addition to the views of headteachers and teachers, this study now also sought those of education authority representatives, additional support staff and pupils. It had 3 strands: telephone interviews with a representative of each of the 32 local authorities in Scotland; questionnaire surveys to headteachers, teachers and additional support staff in primary and secondary schools; a questionnaire survey to pupils in 4 primary and 3 secondary schools, as well as pupil focus groups and a contextual staff interview in those 7 schools; and 8 regional focus groups with school staff.
Overview
5. Overwhelmingly, the headteachers surveyed considered pupils to be generally well
behaved in the classroom, as did the majority of teachers, additional support staff and pupils, (although all were less emphatic than headteachers). Positive behaviour was much more frequent in primary schools than at secondary level.
6. Headteachers thought that indiscipline was less serious a problem than teachers and
additional support staff. Secondary school staff were consistently more likely than their primary counterparts to identify indiscipline as a serious problem. Comparing the percentages of staff rating the problem as ‘very serious’ with the findings from the Edinburgh
University study (Munn et al., 2004), the figures are not vastly different. Primary and
ii
7. The more positive headteachers, teachers and additional support staff were in their
ratings for their school’s overall ethos, quality of leadership and collegiality, the less serious a problem they thought indiscipline was. The more supported teachers and additional support staff felt, the less serious a problem they thought indiscipline was in their school.
8. Indiscipline was thought to occur predominantly in the ‘school playground or yard’,
‘outside school precincts’ or on ‘corridors and stairs’. Secondary headteachers were more likely than primary headteachers to identify the ‘classroom’.
9. P6 and P7 and S2-S4 were identified by staff and pupils as being the most difficult
year groups (again, largely in line with the 2004 Edinburgh University study) with the individuals usually causing the indiscipline being: boys; pupils from dysfunctional homes; and those with behavioural/developmental difficulties.
10. Better Behaviour – Better Learning appears to have affected practice at a local
authority level and, to a lesser extent, at school and classroom level. School staff felt generally aware of BB-BL and evidence from the school staff survey showed support for a number of the recommendations being implemented in schools and classrooms.
PART ONE: BEHAVIOUR IN THE CLASSROOM
Positive behaviour in the classroom
11. There were acute differences in perceptions of positive behaviour depending on the
‘world view’ of the respondent type. Pupils themselves were most negative, then additional support staff, followed by teachers and finally the headteachers.
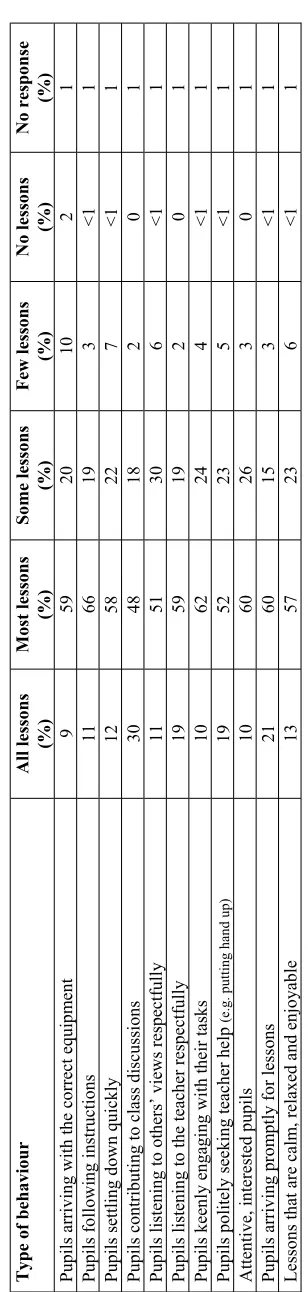
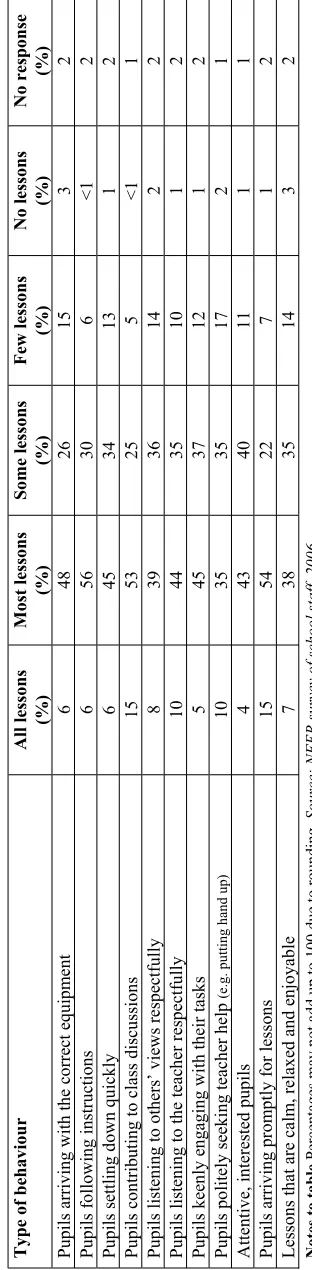
12. The specific types of positive behaviours that were reported to occur most frequently
in lessons included ‘pupils arriving promptly for classes’, ‘pupils contributing to class discussions’ and ‘pupils listening to the teacher respectfully’.
13. Analysis by school sector revealed that positive behaviours occurred much more
frequently at primary level than they did in secondary schools.
14. The more confident teachers felt with regard to responding to indiscipline in their
classrooms, the more likely they were to report positive behaviour as frequently occurring. Similarly, teachers and support staff who felt supported by their school recorded more incidences of positive behaviours.
Negative behaviour in the classroom
15. Secondary headteachers were more likely than their primary counterparts to report
iii
16. Teachers, additional support staff and pupils were generally less positive than
headteachers about pupil behaviour in lessons. Additional support staff and pupils were more likely than teachers to report that pupils were badly behaved in ‘some’ or ‘most’ lessons. Teachers and additional support staff in primary schools were more likely than their secondary colleagues to report that pupils were badly behaved in ‘none/almost none’ of their lessons.
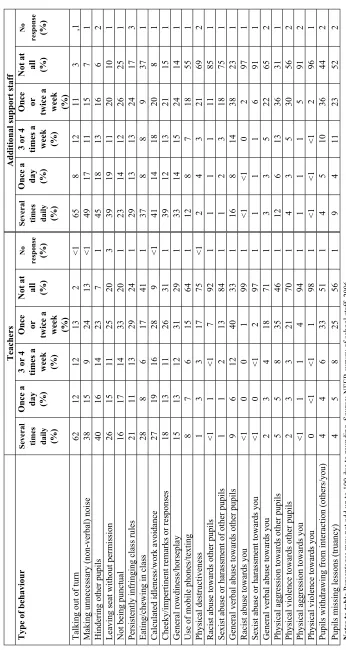
17. The classroom behaviours encountered by school staff (headteachers, teachers and
additional support staff) most frequently within a typical week of teaching were low level, in particular ‘talking out of turn’, ‘making unnecessary (non-verbal) noise’, ‘hindering or distracting others’ and ‘pupils leaving their seat without permission’. More serious indiscipline, such as physical violence or aggression, was far less likely to occur on a daily basis, and was hardly ever directed at school staff. These findings are very much in line with those of the 2004 Edinburgh University study.
18. The very few incidents of racist or sexist abuse towards staff, and physical aggression
or violence towards staff that were reported in the survey, occurred more frequently in primary schools than in secondary. Increasing numbers of 3- and 4-year olds were reported to be entering mainstream education with often complex difficulties, or a lack of basic social skills, which quite often resulted in behavioural problems.
19. Additional support staff in the survey were consistently more likely than teachers to
identify low-level behaviours as happening in lessons several times daily. This could well be related to the perception, which is borne out by additional support staff comments in focus groups, that pupils can be less inclined to do as they are asked by support staff.
20. The low-level indiscipline identified so frequently on a daily basis by teachers and
additional support staff in the school survey was far less likely to referred on to, or directly encountered by, headteachers.
21. As identified in the previous Edinburgh University study and reported by staff in the
focus groups in the current study, it is the constant “drip, drip effect” (Munn et al., 2004) of
low-level bad behaviour that grinds school staff down and contributes to a lowering of morale. Analysis revealed that the more confident teachers felt in responding to indiscipline in the classroom, the less likely they were to report incidents of negative behaviour. At the same time, teachers and additional support staff who reported feeling more supported in school, were also less likely to report incidents of negative behaviour in the classroom.
22. Pupils also identified low-level indiscipline as the type of behaviour they observed in
most of their lessons. The classroom behaviours they reported as occurring several times daily emerged as broadly similar to those reported by teachers and additional support staff. Pupils did report incidents of being rude to teachers and of being rowdy more frequently than staff.
23. The most challenging classes for school staff were identified as P7 and P6 in primary
iv
24. Most teachers in the survey, especially those in primary schools, did not find any of
the behaviours they had reported particularly difficult to deal with. Headteachers and teachers reported that it was the low-level behaviours identified most frequently by school staff (in particular, talking out of turn), that had the greatest negative impact on teaching. Staff focus group participants noted that dealing with such behaviour “wasted” teachers’ time and hindered teaching and learning. It was also said to be unfair to other pupils and could have a detrimental effect on their behaviour because they saw poor behaviour being “rewarded” through increased teacher attention.
25. Pupil comments from their focus groups echoed those of school staff. They reported
that negative behaviour in the classroom disrupted lessons and slowed down the learning process. Such behaviour was said to be “annoying” and unfair when “bad” pupils received all the teacher’s attention. Some pupils noted that negative behaviour could escalate, especially if not contained by the teacher.
PART TWO: BEHAVIOUR AROUND THE SCHOOL AND WITHIN THE LOCAL COMMUNITY
Positive behaviour around the school
26. The vast majority of the school staff surveyed indicated that ‘all/almost all’ or ‘most’
of the pupils they encountered around the school were generally well behaved. Headteachers were the most positive, followed by teachers and then support staff. Pupils were most negative in their assessment of their peers’ behaviour around the school.
27. Headteachers were consistently more positive than teachers in their appraisals of the
frequency of positive behaviours evident around the school. Primary school staff reported seeing the positive behaviours more often than their secondary colleagues.
28. The more confident teachers felt themselves to be with regard to responding to
indiscipline in their classrooms, the more likely they were to report observing positive behaviours around the school. Similarly, the more supported teachers felt by their schools, the more likely they were to register encountering positive behaviours around the school.
Negative behaviour around the school and within the local community
29. Headteachers were generally more positive than teachers about the behaviour of their
pupils around school. Teachers were more than twice as likely as headteachers to report that ‘some’ or ‘most’ pupils were badly behaved around school.
30. Negative behaviour around school was identified as more of a problem in secondary
schools than in primary schools. Secondary staff in the focus groups identified off-site locations at breaktimes and lunchtimes as particularly problematic in terms of behaviour.
31. As with negative behaviour in the classroom, the tiny number of headteachers who
v
32. The types of behaviour around the school encountered most frequently by
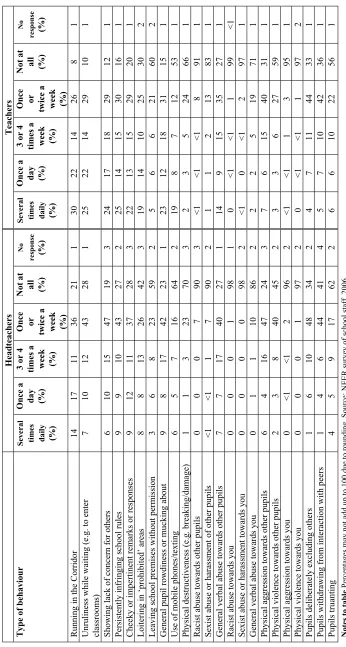
headteachers and teachers were: ‘running in the corridor’; ‘unruliness while waiting’; ‘persistently infringing school rules’; ‘cheeky or impertinent remarks or responses’; ‘showing a lack of concern for others’; ‘loitering in ‘prohibited’ areas’; ‘general pupil rowdiness or mucking about’; and, to a lesser extent, ‘general verbal abuse towards other pupils’. Teachers were more likely than headteachers to identify these behaviours as ones they encountered on a daily basis. More serious incidents such as physical aggression or violence towards staff were rare.
33. Incidents of negative behaviour around school were reported more frequently (i.e. at
least daily) in secondary schools, which is perhaps not surprising given the greater opportunities for such behaviour afforded by moving from lesson to lesson. Secondary school staff in the focus groups particularly referred to corridors and stairs as locations for negative behaviour outside the classroom.
34. The very few incidents of physical aggression or violence towards staff that were
reported around school occurred more frequently in primary schools than in secondary.
35. The more confident staff felt in responding to indiscipline in their classrooms, the less
likely they were to report incidents of negative behaviour around school. At the same time, those teachers who identified a greater level of support available to them in school were less likely to report incidents of negative behaviour around school.
36. Most teachers, particularly in primary schools, did not find the negative behaviour
around school they had reported particularly difficult to deal with. Secondary teachers were more likely than their primary counterparts to identify some degree of difficulty in dealing with negative behaviour around school.
37. Complaints were not frequently received by headteachers from the general public,
local community or the media about the conduct of their pupils outside the school premises. Secondary headteachers were more likely than primary headteachers to report receiving complaints. The most common basis for a complaint was, for primary headteachers, ‘verbal abuse’ and ‘cheeky or impertinent remarks to members of the public’, while for secondary headteachers, it was’ general rowdiness/horseplay’ and ‘anti-social behaviour’.
38. Headteachers, teachers and additional support staff did not perceive pupil violence to
be a particular problem in their school. Teachers were the least positive of the 3 groups, with just over a third reporting that they thought it was a problem. Pupil violence was considered to be more serious by secondary school staff, particularly secondary teachers.
39. Primary headteachers surveyed in the current study in 2006 perceived pupil violence
to be less of a problem than those primary headteachers surveyed in the Edinburgh University study in 2004, while secondary teachers surveyed in 2006 perceived it to be more of a problem than those secondary teachers surveyed in 2004.
40. Staff reporting pupil violence as a problem in their school were most likely to cite
vi
41. Analysis showed a significant relationship between experience of violence and the
length of time headteachers had been in that role, but not for either of the other two staff groups (teachers and additional support staff). That said, however, far fewer teachers who had been in role for 3 years or less had experienced a violent incident compared with the proportion who had been teaching for 4 years or more.
42. The majority of school staff who had experienced violence against them had reported
it. Headteachers were most likely to report violent incidents to the local authority, and teachers and primary additional support staff to the headteacher. Secondary support staff were more likely to refer incidents to their line manager in school and SMT before the headteacher. Secondary headteachers also reported referring incidents to the police when appropriate.
43. Local authority interviewees confirmed that most authorities operated a centralised
system for schools to report incidents of violence by pupils to them. Incidents were typically recorded on a form within the school and logged onto a database by the local authority for termly or annual review. Follow-up after a serious or violent incident had been recorded included: identifying schools in need of additional support; offering direct support and counselling to staff; and (for very serious incidents) instigating risk assessments to look at what can be put in place to minimise the risks to staff and other pupils (e.g. de-escalation/physical intervention training).
PART THREE: EFFECTIVE PRACTICE IN MANAGING BEHAVIOUR
Approaches to managing behaviour
44. Local authorities were rolling out, and piloting, a range of initiatives/strategies (e.g.
Staged Intervention/Framework for Intervention (FFI); Solution-Oriented Schools; and Restorative Practices).
45. The majority of schools operated a school-wide behaviour/discipline policy; used a
range of rules and reward systems; had a school uniform; and were involving parents and pupils in school-wide issues. Pupil support bases; home-link workers; integrated support teams; pupil councils and buddying/mentoring schemes were used to a lesser extent.
46. Referral to a key member of staff was a much reported strategy for managing
behaviour: over three-quarters of headteachers and teachers ‘frequently’ or ‘sometimes’ employed it in their school. A third of both headteachers and teachers stated that they ‘frequently’ or ‘sometimes’ made a referral for an exclusion.
47. Pupils thought schools could do more by: rewarding well behaved pupils; punishing
(more severely) badly behaved pupils; a fairer treatment by teachers; removing badly behaved pupils; and making lessons more enjoyable.
48. The ‘top-five’ individuals included by headteachers in whole-school discussion were:
vii
49. School staff identified the key factors in developing a whole-school approach to
behaviour as: consistency; involvement of parents and pupils; SMT support; school staff consultation; and flexibility.
50. The vast majority of teachers already felt confident in their ability to promote positive
behaviour and deal with indiscipline in their classroom. Understanding individual pupils’ learning styles and motivations was the approach thought by teachers to be most likely to increase their confidence (personal safety training was deemed least likely).
51. Local authority interviewees considered approaches such as Staged Intervention/FFI
to be effective means of responding to indiscipline at a local authority level, as well as a comprehensive CPD menu; integrated working amongst agencies; a clear inclusion policy; and inclusion training. Effective approaches at a school and classroom level were: pupil support bases; alternative, flexible and appropriate curriculum; additional support/behaviour support staff; and Assertive Discipline.
Support available for staff
52. A diverse range of CPD opportunities was on offer in local authorities. School staff
requested more training in general that was of a practical and proactive nature. An absence of supply cover was highlighted as an issue.
53. Nearly three-fifths of headteachers had received some CPD since being in their
current post, which was predominantly provided by the local authority. The majority of teachers had been involved in some kind of development activity related to behaviour in the last year.
54. Three-quarters of headteachers had received local authority support for trying new
initiatives for promoting positive behaviour. Most primary headteachers received this support in the form of advice and consultancy, whilst most secondary headteachers received additional funding or support staff.
55. Headteachers, teachers and additional support staff all indicated that the education
authority worked, to a moderately satisfactory level, with schools to promote positive behaviour. Headteachers were the most positive, followed by additional support staff then teachers. Primary staff were consistently more positive than secondary staff.
56. School staff who gave higher ratings of how the education authority worked in
partnership with the school, also felt more supported by their school.
57. All school staff felt generally supported in their school (as measured by the level that
staff could openly talk to colleagues; senior staff would help colleagues; and awareness of confidential support and counselling in the school). Headteachers agreed the most, followed by additional support staff and then teachers. Secondary school staff felt less supported than their primary equivalents.
58. Teachers had access, to a reasonable degree, to a number of supports to help them
viii
whole-class and individual pupils, but had less access to support provided by senior management within their school, than did secondary teachers.
Conclusion
59. The majority of pupils were reported to be generally well behaved, both in the
classroom and around school. Low-level negative behaviour continues to be the most prevalent form of indiscipline encountered in schools. Yet, focus group discussions would suggest that these are also the most wearing for staff. Headteachers continue to be more optimistic than their staff about indiscipline, whilst the overall picture remains more positive at primary level than at secondary. In the intervening period since the earlier research by Edinburgh University, there has been no real decline in standards of behaviour nationally. However, it may be that addressing the common pattern of low-level indiscipline needs greater attention, particularly given its reported de-motivating effect on school staff.
60. The very tiny number of schools where ‘most’ or ‘all/almost all’ children were said to
exhibit negative behaviour were actually in the primary sector and the very few incidents of physical aggression and violence towards staff also occurred more frequently in primary school responses. These findings were corroborated by local authority staff and in staff focus group discussions, suggesting that cohorts of very young children are embarking on their school careers with often complex difficulties, or a lack of basic social skills, which can result in behavioural problems.
61. The report suggests that there are various ‘world views’ of indiscipline issues which
co-exist within schools and which are dependent on an individual’s status and role within the institution. Headteachers, teachers and additional support staff all have differing experiences of the degree and frequency of the positive behaviours and indiscipline they encounter. Recognising these differences and understanding the perspective of others may be an important component of any training and professional development in this area.
62. Additional support staff consistently appeared to be more negative than other school
1
CHAPTER ONE
INTRODUCTION
Background
1.1 Pupil behaviour in our schools has been an issue of concern for many years and is one
that has been the subject of extensive research in recent decades. In December 2000, the then Minister for Education, Europe and External Affairs, established a Discipline Task Group in response to concerns regarding indiscipline in Scottish schools. The remit of that group was to provide recommendations to the Scottish Executive of strategies focused on ensuring ‘purposeful and orderly’ conditions in schools that would enable all those involved in education ‘to participate positively and appropriately in the processes of learning and teaching’ (Scottish Executive, 2001).
1.2 The report produced by the Discipline Task Group, Better Behaviour – Better
Learning (Scottish Executive, 2001) recognised the challenges that teachers and other professionals face in delivering education to young people and acknowledged the wide-ranging causes of indiscipline, stating that ‘there is no single overall solution which can solve all problems’. It noted that young people are more likely to engage positively with learning
when the factors that impinge on it are taken into consideration. Similarly, Kinder et al.,
(1995; 1999), in the course of their research on pupil disaffection, observed that the reasons young people do not engage with school can be ‘highly complex and multi-faceted’ and highlighted the influence of school factors (curriculum, ethos and relationships with teachers), individual factors relating to the young person themselves, and family or community factors.
1.3 In the light of Better Behaviour – Better Learning (Scottish Executive, 2001), funding
was made available to local authorities across Scotland for the implementation of the recommendations made in the report, and to produce action plans as to how this would be achieved. The 36 recommendations to the Scottish Executive, local authorities and schools, aimed to promote positive behaviour through the provision of a range of strategies to support the needs of young people, and by effectively targeting support and resources to help teachers in delivering education.
1.4 As a result of the recommendations, the Scottish Executive committed to supporting a
range of initiatives, as well as making resources available for professional development purposes. Local authorities were asked to prioritise the establishment of in-school support bases and the innovative use of additional support staff (for example, classroom assistants and home-school link workers). Other strategies introduced to promote positive behaviour and create a positive school ethos included: increased multi-agency working; the development of whole-school discipline policies; reward and praise systems; and a focus on involving pupils, for example through pupil councils and buddying schemes.
1.5 In addition, the Executive supported the piloting and subsequent development of a
2
‘solution-oriented schools’, a whole-school approach where headteachers work with staff teams to develop problem solving within the classroom and throughout the school; ‘the motivated school’ which is aimed at developing a systematic profiling system to aid early intervention within an ethos of self-motivation; and restorative practices, which include peer mediation and circle time.
1.6 Three years after Better Behaviour – Better Learning (Scottish Executive, 2001), the
Policy Update on Behaviour in Scottish Schools (Scottish Executive, 2004a) reviewed the progress made in implementing the recommendations of the former report, in order to decide
if the current policy direction and priorities were appropriate. The Policy Update drew on a
range of survey evidence and research findings relating to behaviour in school, including a Scottish Executive commissioned survey conducted by Edinburgh University in 2004, which had been previously conducted in 1990 and 1996. The 2004 survey found that most indiscipline encountered by teachers constituted low-level, ‘irritating’ behaviour that the majority do not find difficult to deal with. However, the survey did show some areas where perceptions of the seriousness of indiscipline, as well as the time spent in dealing with it, had increased since the 1996 and 1990 surveys. At the same time, teachers in the 2004 survey expressed concern about the level of pupil-on-pupil aggression (Scottish Executive, 2004a).
1.7 The Policy Update on Behaviour in Scottish Schools (Scottish Executive, 2004a)
concluded that progress had been made on implementing the recommendations of Better
Behaviour – Better Learning (Scottish Executive, 2001) and on introducing a range of behavioural strategies in schools. However, it recommended that further approaches to prevent, and respond to, pupil-on-pupil violence or aggression be developed. Furthermore,
following a review of data collection, Violence and Anti-Social Behaviour in Scottish Schools
(Scottish Executive, 2004b), the Minister for Education and Young People expressed concern that information on indiscipline in schools was ‘not sufficiently robust’ to provide a clear enough picture of what was taking place in Scottish schools. As a result, after consultation, the Scottish Executive committed to instituting ‘regular major surveys of teachers’ and pupils’ experiences and perceptions of behaviour and discipline in schools’ (Scottish Executive, 2004a).
The study
Aims
1.8 The overall aim of the current study was to provide clear and robust information on
behaviour (including positive behaviour) in publicly funded schools in Scotland. The study also addressed the following objectives associated with behaviour in schools, to:
• provide evidence on the nature and prevalence of indiscipline
• provide evidence on the extent of positive behaviour
• examine what is effective in preventing and responding to indiscipline
3 Methodology
1.9 The study was designed to build on the previous work conducted by Edinburgh University, but to expand its scope by providing a wider picture of behaviour than that provided by teachers and headteachers alone. Thus, in addition, the study also sought the views of education authority representatives, additional support staff and pupils, and comprised 3 complementary strands:
Strand One: Telephone interviews with local authority representatives
Strand Two: Questionnaire surveys to school staff in primary and secondary schools
Strand Three: Fieldwork (comprising a questionnaire survey to pupils in 7 schools, pupil focus groups and a contextual staff interview in these 7 schools, and 8 focus groups with school staff).
Strand One: Telephone interviews with local authority representatives
1.10 Letters were sent by the Scottish Executive to Directors of Education in all 32 local
authorities in Scotland that explained the research and asked them to participate. In addition, Directors of Education were informed of the number of schools in their authority to be contacted in connection with the school staff survey. Telephone interviews were then conducted with a representative of all 32 local authorities, the majority of whom had a remit for additional support for learning, inclusion and/or pupils with social, emotional and behavioural difficulties.
1.11 Interviews focused on local authority perceptions of the nature and prevalence of indiscipline in primary and secondary schools within their authority, as well as how incidents of violence or bullying in schools are monitored and the extent of off-site provision within the authority for pupils with behavioural difficulties. Interviewees were also asked to identify examples of effective practice in responding to indiscipline and of effective practice in promoting positive behaviour. In addition, views were sought on the extent to which the
recommendations of Better Behaviour – Better Learning (Scottish Executive, 2001) have
been useful in managing discipline, and the progress made to date towards reviewing and developing written policies and guidelines (e.g. to include care, behaviour and inclusion policies) into a single framework. Interviewees were then asked to highlight the CPD on offer within their authority on behaviour/classroom management and, finally, to identify what they perceived to be the key factors in effective behaviour management.
Strand Two: Questionnaire surveys to school staff
1.12 A national sample of 580 schools (250 secondary schools and 330 primary schools) was drawn by the Scottish Executive to be representative of schools in Scotland in terms of the following (in order of stratification): local authority (LA), entitlement to free school meals, school size, and urban/rural location.
1.13 Three instruments were devised for the staff survey:
• headteacher questionnaire
• teacher questionnaire
4
1.14 The headteacher and teacher questionnaires were each 12 pages long and the additional support staff was four pages in length.
1.15 The instruments were piloted in early January 2006 in five schools, identified by the
Scottish Executive, comprising two primary and three secondary schools. The survey instruments were then re-drafted in the light of comments received from these five schools.
1.16 In early February of 2006, packs containing headteacher, teacher and additional support staff questionnaires, together with covering letters and pre-paid envelopes, were sent out to headteachers in the sample of 580 schools by NFER’s survey administration department, Research Data Services (RDS). Headteachers were asked to complete their own questionnaire, and to pass on 4 teacher questionnaires (3 in the primary schools) to teachers currently teaching in their schools whose names appeared first in the alphabet, and 2 additional support staff questionnaires (one in the primary schools) to additional support staff of their choice.
1.17 In early March 2006, reminder letters with replacement questionnaires were sent out
to the headteachers of schools where the full complement of questionnaires had not been received, and another letter encouraging a response was sent to non-responding schools in mid-March. Follow-up telephone calls were then made at the end of March 2006.
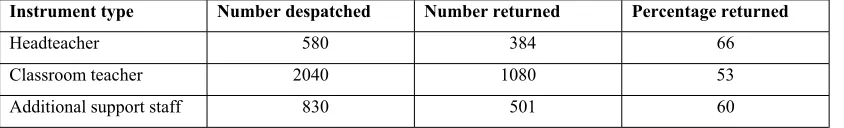
[image:17.612.99.521.404.468.2]1.18 Table 1.1 below presents the responses of school staff to the survey.
Table 1.1: Response rates to the NFER survey of school staff
Instrument type Number despatched Number returned Percentage returned
Headteacher 580 384 66
Classroom teacher 2040 1080 53
Additional support staff 830 501 60
Source: NFER survey of school staff, 2006
Strand Three: Fieldwork
1.19 The fieldwork strand of the study involved:
• the administration of a questionnaire survey to pupils in 7 schools (4 primary and
3 secondary)
• qualitative contextual work alongside the pupil survey, including pupil focus
groups and a short interview with a key member of staff
• eight focus groups with school staff (headteachers, classroom teachers and
support staff) drawn from across local authority boundaries and from both primary and secondary schools.
1.20 The 4 primary and 3 secondary schools involved in the pupil survey were selected by
5
was made, in conjunction with the sponsor, to include 7. The pupils to be involved in the survey included P6 and P7 pupils in the 4 primary schools and all pupils in the 3 secondary schools.
1.21 Given the wide age range of the pupils to be involved, a 4-page questionnaire was designed to cover: pupils’ experiences of school in general; their perceptions of the extent, nature and frequency of positive behaviour in the classroom; their experience of the extent, nature and frequency of indiscipline in the classroom; and their views on the effectiveness of strategies/approaches to promote positive behaviour and prevent indiscipline (including school rules, sanctions and reward systems). The pupil questionnaire was piloted in the 2 primary schools and 3 secondary schools that were piloting the staff questionnaires and revisions were made in the light of the comments received.
1.22 Following the piloting phase, the 4 primary schools and 3 secondary schools to be involved in the pupil survey were contacted to elicit headteacher support and to identify the number of pupils to be involved in each school. The pupil questionnaires, together with a covering letter and guidance on administration, were then sent out by the research team to all 7 schools at the beginning of March. The questionnaires were administered by school staff, with the offer of support from the Executive’s Regional Communication Team, if needed. The response rate achieved for the pupil survey is displayed in Table 1.2 below.
Table 1.2: Response rates to the NFER survey of pupils
Instrument type Number despatched Number returned Percentage returned
Pupils (primary) 309 296 96.0
Pupils (secondary) 1775 1165 66.0
Pupils (overall) 2084 1461 70.0
Source: NFER survey of pupils, 2006
1.23 Visits were subsequently made to each of the 7 pupil survey schools to conduct up to
2 pupil focus groups and a contextual interview with a key member of staff. It was recommended that the focus groups include separate groups of P6 and P7 pupils in the primary schools, and separate groups of S1 to S3 and S4 to S6 pupils in the secondary schools. In total, 14 pupil focus groups were conducted. Thirteen of these involved 6 pupils and one group comprised 8. Two of the groups, held in a very small secondary school, involved S1 to S6 pupils.
1.24 Pupil participation in the focus groups was voluntary and, where requested, information letters and/or request forms for parental permission were provided for schools to send out. The focus groups invited pupils to talk about their own and their peers’ experiences of behaviour, in particular when and where indiscipline takes place; the effect indiscipline has on pupils and the way they learn; what happens when pupils misbehave; what works to prevent indiscipline and help pupils behave well; and finally pupil involvement, for example, in devising school rules or behaviour policies. The interviews with a key member of staff involved either the headteacher or the deputy headteacher and sought information about behaviour within each school, in order to provide a context for the pupil survey and focus group results.
6
school staff (including 2 groups of headteachers, 4 groups of teachers and 2 groups of additional support staff) from primary and secondary schools across local authority boundaries. These focus groups took place in 4 different locations across Scotland and included 62 participants, as shown in Table 1.3 below:
Table 1.3: Staff focus group participants
Participants Number attending
Primary headteachers 6
Secondary headteachers 7
Primary teachers 15
Secondary teachers 14
Primary additional support staff 11
Secondary additional support staff 9
Total 62
1.26 Discussion topics for the staff focus groups included: the nature of behaviour (both positive and negative) and key patterns of poor behaviour observed; the effect that negative behaviour has on both staff and teaching and learning; approaches to, and support for, managing behaviour; and the experience and confidence of staff in dealing with behaviour.
Data analysis
1.27 All interviews and staff focus groups conducted over the course of the research were
taped and summarised. Analysis of the local authority and school staff contextual interviews was completed using MaxQDA (a qualitative research package, which involves the development of comprehensive coding frames which are then used to ascribe codes to segments of text). This allowed comparative analysis of the different policies on, and approaches to, behaviour management taking place in schools in Scotland. The data, from all stages of the research, were then written up thematically, according to the foci of the interview schedules (examples of the local authority and the school staff schedules, as well as the school staff and pupil focus group schedules, can be found in Annex 1).
1.28 The statistical analysis of the questionnaire data was undertaken by NFER’s Statistics
Research and Analysis Group (SRAG). The data were analysed using SPSS. The basic frequencies for each questionnaire type were produced and following this, the data were disaggregated by school sector. Further, for the teacher survey, teachers’ ratings of their confidence in dealing with indiscipline in the classroom was correlated with other items included in their questionnaires. Additionally, for the headteacher, teacher and support staff surveys, correlations were carried out between each respondent type’s perceptions of the support available for staff in their schools and other questions on their questionnaires. For all
correlations, tests to measure the statistical significance were conducted1. Where the results
of the correlations are reported in this document, the associations are all statistically significant to p=0.05 or less. Examples of the questionnaires for school staff (including
1
7
headteachers, teachers and classroom assistants/support staff) and for pupils can be found in Annex 2.
1.29 Although the current survey comprised a different sample, in terms of size, to that of
the earlier longitudinal Edinburgh University study, and thus was not strictly comparable, some interesting parallels with that survey did emerge. These have been included in the text of this report where appropriate.
The report
1.30 The report draws on the data from all 3 strands of the research and, following an overview in Chapter Two which outlines the perceived seriousness of the problem of indiscipline, any trends and patterns related to indiscipline, and the influence of national policy, is divided into 3 parts. It should be noted that, in the chapters that follow, where pupil survey responses are reported, they are not strictly comparable with school staff survey responses, as the former was administered to pupils in only 7 schools.
Part One: Behaviour in the classroom
• Chapter Three focuses on positive behaviour in the classroom, in particular
how well behaved pupils are in lessons and the type of positive behaviour exhibited.
• Chapter Four presents a picture of negative behaviour in the classroom. It
considers how badly behaved pupils are in lessons, the type of poor behaviour exhibited, how typical that behaviour is and whether some classes are more challenging than others. Finally, the chapter examines the impact poor behaviour in lessons has on staff, on pupils and on the learning experience.
Part Two: Behaviour around the school and within the local community
• Chapter Five looks at positive behaviour around the school, particularly how
well behaved pupils are when moving around the school and the sort of positive behaviour encountered outside the classroom environment.
• Chapter Six then considers negative behaviour around the school and within
the local community, in particular the extent of negative behaviour, the type of poor behaviour encountered, how typical that behaviour is, as well as the impact such negative behaviour has on staff and pupils. The chapter then moves on to discuss the frequency and nature of any complaints to headteachers about the conduct of their pupils outside the school premises. Finally, this chapter ends by examining perceptions of the extent and type of pupil violence.
Part Three: Effective practice in managing behaviour
• Chapter Seven focuses on the approaches used to encourage positive behaviour
8
• Chapter Eight discusses the support available to school staff in managing
behaviour and focuses on local authority support, including continuing professional development (CPD), and support provided at school level.
9
CHAPTER TWO
OVERVIEW
Introduction
2.1 This initial chapter of the report provides an overview of current behaviour in
Scotland’s schools. The chapter begins by illustrating how serious a problem indiscipline is in schools, followed by an account of current trends and patterns, including where and when indiscipline is most likely to occur. Finally, the influence of national policy on approaches taken to managing behaviour is discussed, with particular attention being paid to the impact of Better Behaviour – Better Learning (Scottish Executive, 2001). Data collected from all stages of the research (both qualitative and quantitative) are used throughout this chapter.
How serious a problem is indiscipline?
2.2 Chapter Three, which focuses in more detail on positive behaviour in the classroom,
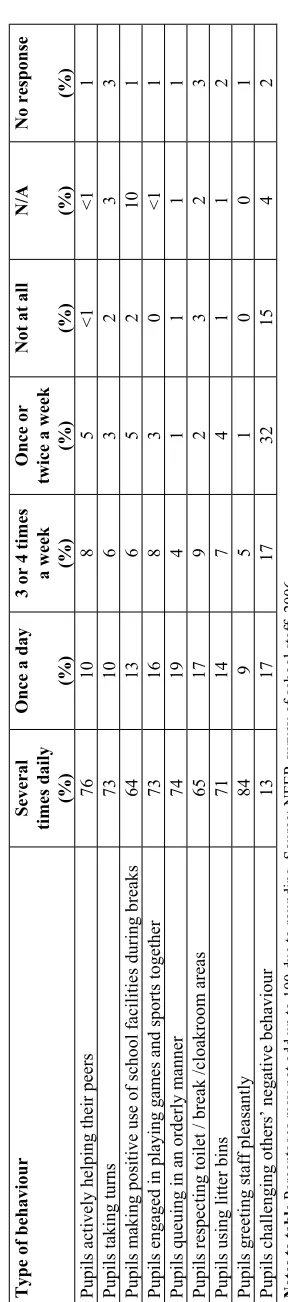
notes that, overwhelmingly, the headteachers surveyed considered pupils to be generally well behaved in the classroom. This was also the case for the majority of teachers, additional support staff and pupils, although they were less emphatic than headteachers. The types of positive behaviour reported to occur most frequently included ‘pupils arriving promptly for classes’, ‘pupils contributing to class discussions’ and ‘pupils listening to the teacher respectfully’. Analysis by school type revealed that positive behaviour occurred much more frequently in primary schools than at secondary level.
School staff and pupil perceptions of how serious a problem indiscipline is in schools
2.3 In the survey of school staff, headteachers, teachers and additional support staff were
asked to rate, on a scale of 1 to 5, how serious a problem they thought indiscipline was in their respective schools. Table 2.1 overleaf shows that the most positive response to whether indiscipline was a serious problem came from headteachers, nearly three-quarters (70 per cent) of whom made a rating of 4 or 5 (not a serious problem). In contrast, the responses of teachers and additional support staff were much less positive, with fewer than half (45 per cent) of teachers and just over two-fifths (41 per cent) of additional support staff making the same rating. More than a quarter of teachers (27 per cent) and a fifth (22 per cent) of additional support staff indicated that the problem was serious by making a rating of 1 or 2, compared with only 6 per cent of headteachers.
2.4 Analysis by school sector revealed that secondary school staff were consistently less
positive about the seriousness of indiscipline in their school. Two-fifths (40 per cent) of secondary teachers made a rating of 1 or 2, indicating that the problem of indiscipline was serious in their school, compared with 14 per cent of primary teachers. Almost a third (32 per cent) of secondary additional support staff indicated the problem was serious (by making a rating of 1 or 2) compared with one in 10 (10 per cent) of primary support staff.
2.5 When the percentages of primary and secondary headteachers and teachers giving a
rating of 1 (‘very serious’) in the current 2006 survey are compared with the findings from
the Edinburgh University survey (Munn et al., 2004), the figures do not really emerge as
10
the problem very serious in 2004, compared with one per cent and 4 per cent respectively in 2006. Three per cent of secondary headteachers and 10 per cent of secondary teachers rated it very seriously in 2004, compared with one per cent and 13 per cent respectively in 2006. Thus, primary and secondary teachers’ perceptions of the problem as ‘very serious’ have increased very slightly since 2004, while secondary headteachers’ perceptions have decreased. There are no data on additional support staff from the 2004 survey with which to compare the responses of additional support staff in the current survey.
2.6 Staff in the 7 pupil survey schools indicated in the contextual interviews that, on the
[image:23.612.100.515.265.575.2]whole, the majority of pupils in their school were well behaved. However, some did indicate that there were “small pockets” of indiscipline amongst certain individuals.
Table 2.1 Headteacher, teacher and additional support staff (overall, primary and secondary) ratings of how serious a problem indiscipline is in their own school
Rating of how serious a problem indiscipline is in school
Overall Primary Secondary
(N) % (N) % (N) %
Headteacher
Very serious 1 3 1 2 1 1 1
2 18 5 5 2 13 8
3 92 24 34 16 58 34
4 161 42 81 38 80 47
Not serious at all 5 108 28 91 43 17 10
No response 2 1 2 1 - -
TOTAL 384 100 215 100 169 100
Teacher
Very serious 1 89 8 21 4 68 12
2 202 19 54 10 148 27
3 297 28 124 24 173 32
4 299 28 175 33 124 23
Not serious at all 5 180 17 151 29 29 5
No response 13 1 5 1 8 1
TOTAL 1080 100 530 100 550 100
Additional support staff
Very serious 1 26 5 5 3 21 7
2 87 17 12 6 75 24
3 166 33 39 21 127 40
4 117 23 57 31 60 19
Not serious at all 5 89 18 68 37 21 7
No response 16 3 6 3 10 3
TOTAL 501 100 187 100 314 100
Notes to table Percentages may not all add up to 100 due to rounding. Source: NFER survey of school staff, 2006
2.7 In assessing the factors that might be contributing to the responses given by school
staff as to how serious a problem they perceived indiscipline to be in their school, staff in the survey schools were asked to rate the overall ethos, the quality of leadership and the levels of collegiality in their school.
2.8 Most school staff indicated that the overall ethos in their school was ‘good’ or ‘very
11
positive rating for the quality of leadership in their school (94 per cent giving a ‘good’ or
‘very good’ rating), compared with teachers and additional support staff (60 and 67 per cent respectively giving a ‘good’ or ‘very good’ rating). Although there was little difference in the responses of primary and secondary headteachers, secondary school teachers were less
positive than primary colleagues. Most school staff surveyed indicated that levels of
collegiality in their school were ‘good’ or ‘very good’. Headteachers were more positive
than teachers and additional support staff and, as evident throughout, secondary school staff were less positive than their primary counterparts.
2.9 When the above factors, together with teachers’ confidence in dealing with
indiscipline and the level of support they felt was available to them in school, were correlated with perceptions of the seriousness of the problem of indiscipline, the following associations were revealed:
• the more positive headteachers, teachers and additional support staff were in
their ratings of the overall ethos, quality of leadership and collegiality of their
school, the less serious they perceived the problem of indiscipline in their
school to be
• the more confident teachers felt in their ability to respond to indiscipline in the
classroom, the less serious they thought the problem of indiscipline was in
their school
• the more supported teachers and additional support staff felt, the less serious
they perceived the problem of indiscipline in their school to be.
2.10 It should be noted though, that although relationships between the above factors and
the reported seriousness of the problem of behaviour were evident, this analysis does not establish direction of causality. Taking overall ethos as an example, this analysis does not determine whether teachers perceived the problem of indiscipline as less serious because they rated the overall ethos of their school highly; or whether they rated the overall ethos highly because they perceived the problem of indiscipline to be less serious.
2.11 Pupils completing the questionnaire in the 7 pupil survey schools were also asked to
provide a rating of how serious a problem they thought bad behaviour was in their school. Pupils were provided with a 3-point response scale as opposed to the 5-point one used for the school staff survey. Table 2.2 overleaf provides the details.
Table 2.2 Pupil (overall, primary and secondary) ratings of how serious a problem bad behaviour is in their own school
Rating of how serious a problem bad behaviour is in school
Overall Primary Secondary
(N) % (N) % (N) %
Very serious 1 121 8 16 6 105 9
Quite serious 2 686 47 156 54 530 47
Not serious 3 620 42 115 40 505 44
No response 34 2 - - - -
TOTAL 1461 100 213 100 169 100
12
2.12 Nearly half (47 per cent) of pupils stated that they thought the problem of indiscipline
was ‘quite serious’ within their own school. A further two-fifths (42 per cent) stated that they thought indiscipline was ‘not serious’. A higher proportion of primary pupils (54 per cent) than secondary pupils (47 per cent) stated that they thought bad behaviour was ‘quite serious’ within their school.
2.13 Participants in the pupil focus groups were asked if pupils in their school were generally well behaved or not. In each of the 14 groups, participants stated that pupils were generally good, most of the time, but that a minority of pupils was not.
2.14 Representatives from all 32 local authorities were asked about the prevalence of discipline problems in their authority. Eleven of the 32 local authority interviewees gave a direct assessment of the scale of the problem within their authority. The majority of these indicated that they felt discipline was generally good and presented only a moderate challenge. A minority suggested that the issues within their authority were similar to those faced nationally. Low-level disruption was said to be most prevalent in schools, while more serious incidents of pupil aggression and violence were felt to be far less frequently encountered. A number of local authority interviewees suggested that the perception of indiscipline was possibly higher than the actuality.
2.15 In relation to perceptions of trends in pupil behaviour, local authority interviewees were in broad agreement that the nature of the problem was changing, both in terms of the types of behaviour being encountered in schools and the methods used by schools to challenge indiscipline. Recurring issues in the comments of interviewees included:
• changes in the age profile of pupils causing the most severe problems: schools were
reported to be experiencing dramatic rises in the numbers of early years pupils with significant behavioural problems
• an increase in the numbers of pupils with identifiable disorders and physical and
mental health issues which contribute to their poor behaviour.
• a perceived increase in the extent to which social problems outside school, such as
deprivation, family breakdown and drug and alcohol use are being manifested in schools.
The nature of indiscipline
2.16 Chapter Four discusses in depth the issue of negative behaviour in the classroom. The
key finding is that the classroom behaviours encountered by school staff (headteachers, teachers and additional support staff) most frequently within a typical week of teaching were low level (e.g. ‘talking out of turn’, ‘making unnecessary (non-verbal) noise’, ‘hindering or distracting others’ and ‘pupils leaving their seat without permission’). More serious indiscipline, such as ‘physical violence or aggression’, were far less likely to occur on a daily basis, and were hardly ever directed at school staff.
Time spent undertaking activities to promote positive school ethos and behaviour
2.17 As part of the questionnaire survey, headteachers and teachers were asked to indicate
13
in their school to promote positive ethos and behaviour. Table 2.3 overleaf presents their responses.
Table 2.3 The time headteachers and teachers (overall, primary and secondary) spent undertaking activities to promote positive school ethos and behaviour in the last full teaching week
Time spent Overall Primary Secondary
(N) % (N) % (N) % Headteacher
No time spent 4 1 3 1 1 1
Under an hour 95 25 59 28 36 22
An hour to 3 hours 217 57 129 61 88 53
More than 3 hours 63 16 21 10 42 25
No response 5 1 - - - -
TOTAL 384 100 212 100 167 100
Teacher
No time spent 178 17 24 5 154 28
Under an hour 407 38 205 39 202 37
An hour to 3 hours 397 37 249 48 148 27
More than 3 hours 86 8 44 8 42 8
No response 12 1 - - - -
TOTAL 1080 100 522 100 546 100
Notes to table Non-responses were included in the figures for the sample overall. The figures for primary and secondary respondents were calculated from those who responded to the question only. Percentages may not all add up to 100 due to rounding. Source: NFER survey of school staff, 2006
2.18 Table 2.3 shows that, the majority of headteachers (82 per cent) and teachers (75 per
cent) had spent up to 3 hours undertaking specific activities to promote positive school ethos and behaviour. Almost a fifth (17 per cent) of teachers stated that they had not spent any time on this, compared with only one per cent of headteachers. Analysis by school sector reveals that primary headteachers, and particularly teachers, reported spending more time undertaking activities to promote positive school ethos and behaviour than did secondary headteachers and teachers. Conversely, a quarter (25 per cent) of secondary headteachers reported spending more than 3 hours a week on such activities compared with one in ten (10 per cent) of primary headteachers.
Time spent dealing with indiscipline
2.19 Headteachers and teachers were also asked in the questionnaire survey to indicate how much time they had spent, in the last full teaching week, dealing with indiscipline and planning or providing behaviour support to individual pupils. These questions aimed to provide another measure of how serious a problem indiscipline is for schools on a regular basis. Tables 2.4 and 2.5 present the results.
2.20 Table 2.4 overleaf shows that the majority of headteachers (71 per cent) and teachers
14
spending under an hour a week on discipline issues compared to just over a third of primary teachers.
Table 2.4 The time headteachers and teachers (overall, primary and secondary) spent dealing within indiscipline in the last full teaching week
Time spent Overall Primary Secondary
(N) % (N) % (N) % Headteacher
No time spent 20 5 19 9 1 1
Under an hour 109 28 81 38 28 17
An hour to 3 hours 166 43 90 42 76 45
More than 3 hours 86 22 23 11 63 38
No response 3 1 - - - -
TOTAL 384 100 213 100 168 100
Teacher
No time spent 46 4 33 6 13 2
Under an hour 556 52 322 61 234 43
An hour to 3 hours 346 32 138 26 208 38
More than 3 hours 127 12 35 7 92 17
No response 5 1 - - - -
TOTAL 1080 100 528 100 547 100
Notes to table Non-responses were included in the figures for the sample overall. The figures for primary and secondary respondents were calculated from those who responded to the question only. Percentages may not all add up to 100 due to rounding. Source: NFER survey of school staff, 2006
2.21 In relation to time spent providing or planning behaviour support to individuals, Table
15
Table 2.5 The time headteachers and teachers (overall, primary and secondary) spent planning or providing behaviour support to individuals
Time spent Overall Primary Secondary
(N) % (N) % (N) % Headteacher
No time spent 68 18 42 20 26 15
Under an hour 161 42 90 42 71 42
An hour to 3 hours 127 33 70 33 57 34
More than 3 hours 26 7 11 5 15 9
No response 2 1 - - - -
TOTAL 384 100 213 100 169 100
Teacher
No time spent 350 32 159 30 191 35
Under an hour 488 45 267 51 221 40
An hour to 3 hours 183 17 85 16 98 18
More than 3 hours 54 5 17 3 37 7
No response 5 1 - - - -
TOTAL 1080 100 528 100 547 100
Notes to table Non-responses were included in the figures for the sample overall. The figures for primary and secondary respondents were calculated from those who responded to the question only. Percentages may not all add up to 100 due to rounding. Source: NFER survey of school staff, 2006
Trends and patterns
When indiscipline is most likely to occur in schools
2.22 As part of the school survey, headteachers were asked to indicate when indiscipline
was most likely to occur in the school context. Table 2.6 below shows that by far the highest proportion of headteachers stated that indiscipline predominantly occured during lunchtimes
(83 per cent); a finding consistent with the Edinburgh University survey (Munn et al., 2004).
16
Table 2.6 When indiscipline is most likely to occur in school, as identified by headteachers
When most likely to occur Overall Primary headteachers
Secondary headteachers (N) (%) (N) (%) (N) (%)
Before the school day begins 34 9 30 14 4 2
During morning classes 17 4 7 3 10 6
Morning break 118 31 81 38 37 22
Lunchtime 317 83 180 84 137 81
During afternoon classes 148 39 50 23 98 58
Afternoon break 8 2 5 2 3 2
After the end of the school day 118 31 81 38 37 22
No response 13 3 9 4 4 2
TOTAL RESPONSES 773 443 330
Notes to table Multiple response question: headteachers could select more than one option, therefore percentages do not add
up to 100. Source: NFER survey of school staff, 2006
2.23 Although, the highest proportions of both primary and secondary headteachers indicated that lunchtime was the most likely time for indiscipline to occur, there are a number of key differences in the responses of primary and secondary headteachers. Table 2.6 shows that primary school headteachers typically stated contexts in which pupils were outside of the classroom as times when indiscipline was most likely to occur (i.e. ‘before the school day begins’, ‘morning break’ and ‘after the end of the school day’). In contrast, a notably higher proportion of secondary school headteachers (58 per cent) than primary headteachers (23 per cent) stated that indiscipline was most likely to occur ‘during afternoon classes’. This, in fact, was rated the second highest ‘flash point’ after lunchtimes.
Where indiscipline is most likely to occur in schools
2.24 Headteachers were also asked in the school survey, to indicate where indiscipline was
most likely to occur in school. Table 2.7 overleaf reveals that responses of primary and secondary headteachers to this question differed quite considerably. Of most interest is that nearly two-fifths (56 per cent) of secondary headteachers stated that ‘corridors and stairs’ was where indiscipline was most likely to occur, whereas only 10 per cent of primary headteachers stated the same. This may well be due to the increased opportunities for indiscipline provided in secondary schools by pupils moving from lesson to lesson. Just over two-fifths (42 per cent) of secondary headteachers identified the ‘classroom’ as the place where indiscipline was most likely to occur, compared with less than a fifth (17 per cent) of primary headteachers. In addition, secondary headteachers were more likely than primary headteachers to identify ‘outside school precincts’ and ‘school buses’ as places in school where indiscipline is most likely to occur.
17
Table 2.7 Where indiscipline is most likely to occur in school, as identified by headteachers (overall, primary and secondary)
Where most likely to occur Overall Primary headteachers
Secondary headteachers (N) (%) (N) (%) (N) (%)
Corridors and stairs 117 31 22 10 95 56
School playground or yard 256 67 182 85 74 44
Classrooms 108 28 37 17 71 42
Toilet areas 81 21 56 26 25 15
Dining hall/queue 44 12 38 18 6 4
School buses 80 21 30 14 50 30
Outside school precincts 123 32 53 25 70 41
Other 6 2 2 1 4 2
No response 13 3 9 4 4 2
TOTAL RESPONSES 828 429 399
Notes to table Multiple response question: headteachers could select more than one option, therefore percentages do not add
up to 100. Source: NFER survey of school staff, 2006
2.26 Pupils in the 14 focus groups were also asked when they thought indiscipline was most likely to occur. In answering this, pupils typically drew a distinction between the different types of behaviour and where they took place. Specifically, the classroom was identified as being the main place that low-level indiscipline took place. In turn, outside in the school yard/playground was cited as being the dominant place for more serious incidents of indiscipline, such as fighting. Aside from this, however, pupils showed agreement with the results shown above in Table 2.7, as participants in 5 groups stated that corridors were common places for indiscipline to occur.
2.27 It is perhaps not surprising that interviews and focus groups with school staff and pupils showed that supply/substitute teachers were perceived to contribute to an increase in indiscipline. Specifically, participants in 5 staff focus groups stated that negative behaviour became more pronounced during lessons delivered by a supply teacher. Furthermore, participants in 10 out of 14 pupil focus groups stated that pupil behaviour, often including their own, changed when a supply teacher took the lesson, as illustrated in the quotation below:
“It is adapting to new teachers. You think, oh, we’re never going to see this teacher again so it doesn’t matter really” (P7 pupil focus group).
Particular year groups / classes or individuals
2.28 As part of the staff and pupil focus groups and during the contextual interviews, specific attention was paid to whether indiscipline varied according to year group/classes or individuals. (Please see Chapter Four for a fuller discussion of challenging classes.) In relation to the school staff interviews and staff focus groups, staff stated that, in primary, P6 and P7 were the most badly behaved (although P4 and P5 were also identified by a group of additional support staff) and in secondary it was S2 –S4. In addition, a number of individuals stated that it was difficult to pinpoint one particular year group as indiscipline was more to do
with the composition of pupils than year groups per se. These findings are largely consistent
with Munn et al (2004) where the later stages of primary (P6 and P5) and S2-S4 in secondary
18
2.29 Results from the pupil focus groups show strong concordance with the school staff focus group results, as participants in 8 out of the 14 pupil groups named pupils in P5-P7 as being the year groups most likely to cause negative behaviour. In addition, participants in 3 pupil focus groups stated S3-S4