Abstract: Magnetic Resonance Imaging (MRI) is one of the medical imaging modality that widely used by the doctors to represent the internal brain structure information digitally. There are plenty of methods available for the classification and segmentation of tumor from the brain MRI study. Brain tumor detection in the initial stage is very important for accurate and better treatment. Patient survival chances can be increased if the accurate tumor is segmented from the brain which can help doctors to treat the patient accordingly. There are a number of existing emerging machine learning algorithms contributed to this problem area. Convolutional Neural Network (CNN) is a widely used method for this type of image segmentation problems. 3D CNN is already achieving better results in this work but it takes lots of data and the time to train such very high accurate model. In this research, 3D CNN is used along with the biological structural information of the brain i.e. the brain has a symmetric structure which can be divided into two nearly equal half, information from each half can help CNN model to differentiate the abnormal tissues from the normal tissues. Using the biological information the results are improved by 10.27%. The fractal search algorithm is implemented to reduce the time complexity of the tumor segmentation process. The segmentation processing time has been reduced by 41.75% on GPU while 23.69% on CPU and improves the segmentation result by 2.76%.
Index Terms: Brain tumor segmentation, CNN, Fractal Search,
I. INTRODUCTION
In the medical field, brain tumor treatment is very difficult. Brain tumors are the abnormal mass of the tissues spread in 3-dimensional space inside the brain. Its size and the location inside the brain defined the type and level of the tumor. Magnetic Resonance Imaging (MRI) is one of the medical imaging modality that widely used by the doctors to represent the internal brain structure information digitally. Gliomas are one of the brain tumor types which grows in the glial cell. It can be divided into two types, Low Grade (Slow-growing) and High Grade (Fast-growing). LGG generally covers II and III grade of the brain tumor. Treatment for the Brain tumor is decided on the basis of the grade of the tumor, higher the grade represent more treatment required. Brain tumor detection is a very time-consuming task for the radiologist. It needs more time and effort for a single brain MRI study. There are plenty of methods which reduces this tedious task of physicians by using the different classification and
Revised Manuscript Received on May 06, 2019
segmentation techniques. Emerging machine learning has also lots of contribution to this problem area. In most of the machine learning methods, Convolutional Neural Network (CNN) is a widely used method for this type of segmentation problems. CNN can be used in 2D and 3D space of the brain structure. 3D CNN is already achieving better results in this work but it takes lots of training data and the time to train such very high accurate model. All these available machine learning algorithms are based on the information of pixel values of the MRI. In this research, 3D CNN is used along with the biological structural information of the brain i.e. the brain has a symmetric structure which can be divided into two nearly equal half, information from each half can help CNN model to differentiate the abnormal tissues from the normal tissues. By using the 3D architecture sufficient amount of search time to find the tumor inside the brain can is reduced.
LITERATURE SURVEY
Research in medical imaging is a favorite topic in the healthcare domain. There are much research has been done in this problem area and many are ongoing. Work has been done in both machine learning and naïve techniques. Few techniques, architectures, results, findings are listed below. A. Comparative study of Supervised and Unsupervised Classification has been done on brain tumor segmentation. Supervised methods like KNN, SVM, and ANN are compared with unsupervised techniques like K-means and Fuzzy C-Means. These methods are tested with the BRATS- 2015 data set. Results of this study state that the ANN has outperformed the other classification methods, also it states that KNN and SVM performed lower than the unsupervised methods [6].
B. Convolutional Neural Networks (CNN) with small 3 * 3 kernel with the intensity normalization methods as a preprocessing step is used in the recent studies. This research has been tested on the BRATS-2013 data sets. Two different models have been designed for the HGG and LGG for tumor segmentation. With LLU activation function taking the Dropout of 0.5 in HGG and 0.1 in LGG dataset in the FC layers is used to reduce the overfitting of the model. Achieved a 0.88 dice score value for the HGG and 0.65 for LGG [7][9]. C. 3D CNN is also used in the recent study because of the 3D structure of the brain. With the help of GMU fusion technique information from the multiple modalities is feed to the CNN network. The research was performed on the BRATS-2015 Dataset which concludes that the GMU fusion technique gives better results than the simple fusions [8].
D. Auto Encoder is also used in the process of brain tumor
Brain Tumor Segmentation from 3D Brain MRI
Using 3D Convolutional Neural Network
studies as input and collect the same size output. Relu activation function is used along with the L2 regularization. 0.83 dice score value is achieved in this research. Although it is getting better results autoencoder is a very time-consuming technique [10].
E. Biological information of the brain i.e. the symmetrical structure of the brain is used with the fast bounding box technique to segment the brain tumor. By finding the difference between two portions of the brain. The used technique is very fast compared to the machine learning technique. Also, different sets of morphological operations are used in the brain tumor segmentation process. Results obtained by this method are lower than the machine learning methods [13][14].
II. PROPOSED METHODOLOGY
A. Datasets
The datasets were collected from the Brain Tumor Segmentation (BraTS) challenge by the Medical Image Computing and Computer-Assisted Intervention (MICCAI) society. It is an international Multimodal brain tumor segmentation challenge. The dataset includes the HGG and LGG tumors. It covers the data from the four different modalities of MRI scan a) T1- weighted b) T1CE c) T2- weighted and d) FLAIR. All the images have been segmented manually by the experienced neuro-radiologists. Provided data is already pre-processed, i.e. interpolated to the same resolution and skull-stripped [1][2][3][4].
B. Data Preprocessing
The intensity variation of the MRI images is very high. To balance this nonuniform intensity variation of the MRI images N3 technique is used. The problem of correcting for intensity nonuniformity is greatly simplified if it is modeled as a smooth multiplicative field. Nonparametric data are not required to fit a normal distribution. Nonparametric statistics uses data that is often ordinal, meaning it does not rely on numbers, but rather a ranking or order of sorts. For this purpose, N4ITK Library is used [11][12].
C. Data Normalization
There are plenty of techniques available for the intensity normalization like histogram equalization, normalize by dividing each value by the max value of the given set, logarithmic normalization. To downgrade the pixel value range to a small amount, Image is subtracted by mean and divided by the standard deviation. By applying this the range of MRI of Sample Brats18_CBICA_BFP_1 if decrease from [0, 803] to [-0.4256, 11.2722], It has been reduced without losing the information from the image. Corresponding histogram plots are shown in Fig 1 which shows that there is no loss in the information but reduces the range of pixel value for a given image [9].
(a)
(b)
Fig 1. (a) Actual Data Distribution. (b) Normalized data Distribution.
D. Sampling of Data
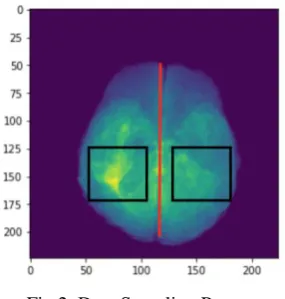
[image:2.595.328.518.53.357.2]The brain has an almost symmetric structure. It is human’s nature that to compare the objects by referencing it to some other objects. This phenomenon of human’s brain nature is applied.
Fig 2. Data Sampling Process.
[image:2.595.353.496.455.605.2]E. Model Architecture
[image:3.595.322.525.63.373.2]Proposed model architecture is shown in Fig 3 and corresponding layer information is listed in Table 1 for a single modality. The same architecture is used for both left CNN and right CNN. Finally, the fusion of the two CNN model will be merged into the fully connected layer as listed in Table II. The binary cross entropy will be used as the loss function to classify the normal and abnormal brain tissue.
Fig 3. General model Architecture.
Filter Size Filter Numbers Activatio n
Conv3D (3, 3, 2) 32 Relu
Conv3D (3, 3, 2) 32 Relu
Average Pooling (2, 2, 2) -
-Conv3D (3, 3, 2) 16 Relu
Conv3D (3, 3, 2) 16 Relu
Average Pooling (2, 2, 2) -
-Conv3D (3, 3, 2) 8 Relu
Conv3D (3, 3, 2) 8 Sigmoid
Average Pooling (2, 2, 2) -
-(I)
Size Activation
FC 1024 Sigmoid
FC 512 Sigmoid
FC 2 sigmoid
(II)
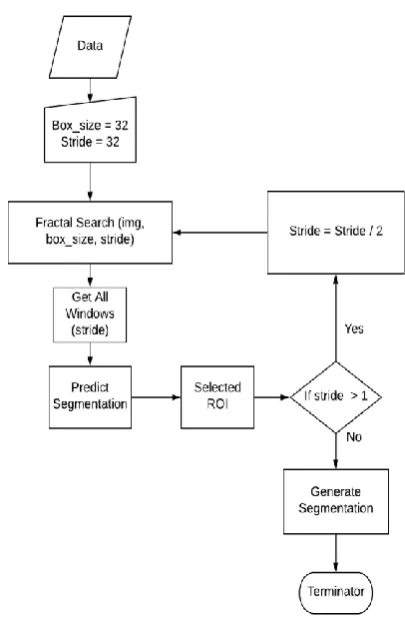
F. 3D Fractal Search Algorithm
To search tumor region inside the 3D MRI images is very time and space consuming with the small box size. It is reduced by using the basic fractal search technique. Fractal search technique works as digging the region of interest to get a more precise result. In terms of segmentation, it will use the
Fig 4. Flow chart for the Fractal Search Technique. G. Evaluation Methods
1) Dice Coefficient
It is used to find the similarity between two sets. For given set A and B the formula for the dice coefficient is given below [15].
2) Sensitivity and Specificity
Sensitivity measures the proportion of actual positives that are correctly identified and Specificity measures the proportion of actual negatives that are correctly identified. Equations for both given below [5].
III. IMPLEMENTATION
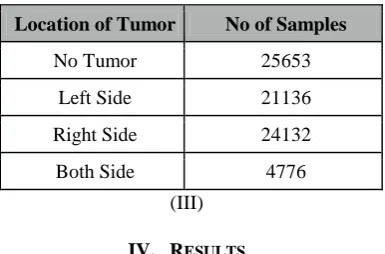
[image:3.595.61.281.170.311.2]Data is duplicated by applying rotation and flipping operation to make it unbiased. The final count of the data sample used for the training is listed in the table (III). Model is then trained for 10 epoch with the batch size of 64. The binary cross entropy loss function is used with Adam optimizer.
It takes nearly 15 minutes to train the model using the GPU. The current implemented model has 5.15% training loss while 5.96% testing loss which can be improved by changing the model parameters.
Location of Tumor No of Samples
No Tumor 25653
Left Side 21136
Right Side 24132
Both Side 4776
(III)
IV. RESULTS
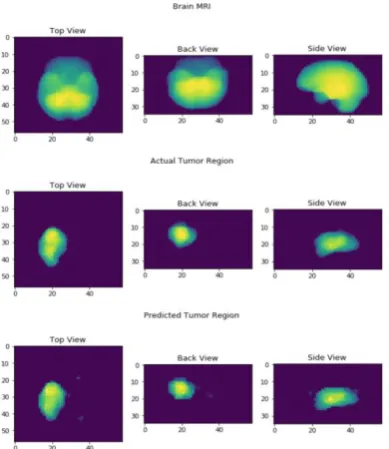
Results of the proposed method are calculated as the dice coefficient. The segmented 3D brain is plotted in 2D view by taking the average in each direction which gives the three different view of the 3D brain model. The first row shows the actual MRI image, the second row shows the manually segmented tumor region and the third row shows the predicted segmented region by the proposed method. Tumors are varying in the shape and size at a different level according to that the model is tested with the differently sized tumor located at a different position inside the brain.
A. Based on the Location of the Tumor
[image:4.595.75.268.167.294.2]Examples of the brain segmentation using the proposed method varying in the different location of the brain are shown below. A tumor present in the right left and center of the brain is shown in Fig 5, 6, and 7 respectively.
Fig 5. A sample having a tumor on the right side of the brain.
Fig 6. A sample having a tumor on the left side of the brain.
Fig 7. A sample having a tumor at the center of the brain.
B. Based on Size of Tumor
Fig 8. A sample having a small-sized tumor
Fig 9. A sample having a large-sized tumor V. COMPARISONS
The proposed model is compared with the naive approach with the same size 3D CNN architecture for the same set of the test sample. The different set of sample is taken and segmented using both models and the results are compared as dice coefficient value. Along with the proposed model, the proposed fractal search algorithm is also compared with the direct search technique on both CPU and GPU processors. All the results are taken by keeping the 4-pixel stride. For the comparison purpose, 12 different samples are chosen varying in location and size of the tumor region.
A. Fractal Search vs Direct Search
1) Time Difference in GPU
dice score value. Time taken to segment each sample on GPU and CPU are shown in table IV and table V respectively.
Sample Direct Search (In Seconds)
Fractal Search (In Seconds)
Improvement (In %)
TCIA10_644_1 21.8781 10.4033 47.5509
TCIA02_368_1 20.3798 7.4878 36.7412
TCIA02_455_1 20.6699 6.1933 29.9627
TCIA10_175_1 20.6941 8.1226 39.2508
TCIA13_618_1 20.5074 8.6384 42.1234
TCIA02_118_1 20.2793 9.9479 49.0546
TCIA02_374_1 20.1932 7.2147 35.7284
CBICA_APR_1 20.1789 6.3191 31.3152
CBICA_AVV_1 20.1415 7.0827 35.1646
TCIA08_242_1 20.6286 10.9696 53.1767
TCIA12_466_1 20.1505 9.5206 47.2475
CBICA_AWH_1 20.2194 10.8225 53.5255 (IV) Time is taken to segment the tumor on GPU
Sample Direct Search (In Seconds)
Fractal Search (In Seconds)
Improvement (In %)
TCIA10_644_1 217.0490 67.1032 30.9162
TCIA02_368_1 226.5082 41.6174 18.3735
TCIA02_455_1 228.6530 28.8280 12.6077
TCIA10_175_1 228.6044 47.6985 20.8651
TCIA13_618_1 227.5983 53.9294 23.6950
TCIA02_118_1 228.5186 70.4659 30.8359
TCIA02_374_1 227.2234 41.4829 18.2564
CBICA_APR_1 227.7457 29.6955 13.0389
CBICA_AVV_1 227.6137 38.2548 16.8069
TCIA08_242_1 227.2919 81.0595 35.6632
TCIA12_466_1 228.0244 63.6875 27.9301
CBICA_AWH_1 227.0785 81.1253 35.7257
(V) Time is taken to segment the tumor on CPU
2) Performance Difference
The very small performance difference is found between the direct search and fractal search method. The performance was improved by 2.76% using fractal search over direct search. Results are shown in Table VI.
Sample Direct Search Dice Score
Fractal Search Dice Score
Performance Difference
TCIA10_644_1 0.8243 0.8420 2.1021
TCIA02_368_1 0.9431 0.9343 -0.9419
TCIA13_618_1 0.7965 0.8675 8.1844
TCIA02_118_1 0.8908 0.9008 1.1101
TCIA02_374_1 0.9181 0.9228 0.5093
CBICA_APR_1 0.8406 0.8331 -0.9003
CBICA_AVV_1 0.9440 0.9369 -0.7578
TCIA08_242_1 0.9370 0.9256 -1.2316
TCIA12_466_1 0.6742 0.8455 20.2602
CBICA_AWH_ 1
0.7229 0.7759 6.8308
(VI)
B. Normal segmentation vs Symmetric Segmentation
The Base method is compared with the proposed method by taking a different set of small and large size tumor located at the different side of the brain. Most of the cases, the proposed method gave a better result than the base method. There is 10.27% improvement for the all test dataset available. Results are shown in Table VII.
Sample Location Tumor Area % Base Model Dice Score Symmetri c Model Dice Score Improve ment in % CBICA_ AWH_1
CENTER 1.79 0.5831 0.7759 24.8486
CBICA_ APR_1
CENTER 0.82 0.6566 0.8331 21.1859
CBICA_ AVV_1
RIGHT 1.46 0.8091 0.9369 13.6407
TCIA13_ 618_1
LEFT 0.76 0.7573 0.8675 12.7032
TCIA12_ 466_1
CENTER 0.73 0.7441 0.8455 11.9929
TCIA02_ 374_1
LEFT 1.47 0.8215 0.9228 10.9775
TCIA02_ 455_1
LEFT 1.09 0.7666 0.8406 8.8032
TCIA02_ 368_1
RIGHT 1.96 0.8657 0.9343 7.3424
TCIA02_ 118_1
LEFT 1.69 0.8407 0.9008 6.6718
TCIA10_ 175_1
LEFT 2.15 0.8581 0.9104 5.7447
TCIA08_ 242_1
RIGHT 1.75 0.9043 0.9256 2.3012
TCIA10_ 644_1
CENTER 1.78 0.8668 0.842 -2.9454
(VII)
VI. CONCLUSION
The proposed method has been tested on the 12 different test samples varying in the size and location of the tumor inside the brain. Using the Biological information i.e. symmetric structure of the brain the results are improved by 10.27% compared to 3D CNN technique used earlier by the researcher []. Further improvement in the acquired result can be possible by changing the model parameter. The proposed fractal search technique is also tested on the same set of test samples.
The proposed method improves the segmentation processing time by 41.75% on GPU devices while 23.69% on CPU device compare to basic window based image segmentation technique. Fractal search method affects the performance of the tumor segmentation. The fractal search method improves the segmentation result by 2.76%. The fractal search technique still can be improved by using better thresholding techniques.
VII.
F
UTURES
COPE1.The results are based on the single modality FLAIR of the MRI images. As different type of modalities used in the different type of tumor visualization, a fusion of the different modalities can be used to get a better accurate result for all types of tumor.
2.The more efficient algorithm can be designed to improve the time complexity to segment the tumor.
REFERENCES
1. Menze BH, et al. "The Multimodal Brain Tumor Image Segmentation Benchmark (BRATS)", IEEE Transactions on Medical Imaging 34(10), 1993-2024 (2015) DOI: 10.1109/TMI.2014.2377694 2. Bakas S, et al. "Advancing The Cancer Genome Atlas glioma MRI
collections with expert segmentation labels and radiomic features", Nature Scientific Data, 4:170117 (2017) DOI: 10.1038/sdata.2017.117
3. Bakas S, et al. "Segmentation Labels and Radionic Features for the Pre-operative Scans of the TCGA-GBM collection", The Cancer Imaging Archive, 2017. DOI: 10.7937/K9/TCIA.2017.KLXWJJ1Q 4. Bakas S, et al. "Segmentation Labels and Radiomic Features for the
Pre-operative Scans of the TCGA-LGG collection", The Cancer Imaging Archive, 2017. DOI: 10.7937/K9/TCIA.2017.GJQ7R0EF 5. https://en.wikipedia.org/wiki/Sensitivity_and_specificity
6. Aymen Bougacha, Jihene, Khaireddine Ben Mahfoudh, and Chokri Mhiri, “Comparative Study of Supervised and Unsupervised Classification Methods: Application to Automatic MRIGlioma Brain Tumors Segmentation.”, 4th International Conference on Advanced TechnologiesFor Signal and Image Processing ATSIP 2018, March 21-24, 2018 Sousse, Tunisia
7. Sérgio Pereira, Adriano Pinto, Victor Alves, and Carlos A. Silva, “Brain Tumor Segmentation Using Convolutional Neural Networks in MRI Images”, IEEE TRANSACTIONS ON MEDICAL IMAGING, VOL. 35, NO. 5, MAY 2016
8. Fangyan Ye1, Jian Pu1, Jun Wang1, Yuxin Li3, Hongyuan Zha1, “Glioma Grading Based on 3D Multimodal Convolutional Neural Network and Privileged Learning”, 2017 IEEEInternational Conference on Bioinformatics and Biomedicine (BIBM), 13-16 Nov. 2017
9. Wang Mengqiao, Yang Jie, Chen Yilei, Wang Hao, “The Multimodal Brain Tumor ImageSegmentation Based On Convolutional Neural Networks”, 2017 2nd IEEE International Conference on Computational Intelligence and Applications (ICCIA)Page | 33 10. V. Shreyas, and Vinod Pankajakshan, Member, IEEE, “A Deep
Learning Architecture for Brain Tumor Segmentation in MRI Images”, 2017 IEEE 19th International Workshop onMultimedia Signal Processing (MMSP)
11. Sled JG, Zijdenbos AP, and Evans AC, “A nonparametric method for automatic correction of intensity nonuniformity in MRI data,” IEEE Trans. Med. Imag., vol. 17, no. 1,pp. 87-97, Feb.1998.
12. Tustison N., Gee J., “N4ITK: Nick's N3 ITK Implementation For MRI Bias FieldCorrection,” Published in The Insight Journal - 2009 January - June.
13. Samee Azad, Shaikh Anowarul Fattah* and Celia Shahnaz, “An Automatic Scheme for Brain Tumor Region Detection from 3D MRI Data Based on Enhanced Intensity Variation” Proc. of the 2017 IEEE Region 10 Conference (TENCON), Malaysia, November 5-8, 2017 14. Adel Kermi1, Khaled Andjouh1, Ferhat Zidane1, “Fully automated
technology, Image Process., 2018, Vol. 12 Iss. 11, pp.1964-1971. 15. https://en.wikipedia.org/wiki/S%C3%B8rensen%E2%80%93Dice_co
efficient
AUTHORSPROFILE
Hiren Patel is Pursuing ME in Information Technology from L D College of engineering, Ahmedabad – 380015. He published a paper in ICRISET Dec-2018 on “Comparative Analysis for Moving Object Detection in Vibrant Background using SVM, LS-SVM, and Random Forest Classifier”. His research domain is in machine learning in healthcare.
Mehul C. Parikh is presently working as an associate professor in the Department of Information technology, L.D. College of Engineering, Ahmedabad. He received his M.Tech degree from Nirma University and Ph.D. from Charotar University of Science and Technology, Changa, Gujarat. His research focus in the area of Image processing, especially in segmentation of moving objects and in medical image processing. He is a life member of CSI, ISTE, and IETE.