International Journal of Innovative Technology and Exploring Engineering (IJITEE) ISSN: 2278-3075, Volume-8 Issue-5S March, 2019
Abstract: In this paper, Two Sided Modified Chain Sampling Plans (TSMChSP) for Exponential distribution is presented. The decision of acceptance lot can be made by ensuring no defects in both preceding and succeeding samples. The design parameters such as the minimum sample size and operating characteristic values are calculated to ensure the consumer’s risk at a specified quality level. The main purpose of this article is to produce the TSMChSP for Exponential distributions. An example is provided for illustrative purpose.Then, the article moving on further to compare the performances of TSMChSP and TSChSP, based on two criteria, which are the number of minimum sample size, and the probability of lot acceptance, . The article concluded that, the TSMChSP has a better performance compared to the TSChSP in both criteria.
Keywords: Two sided Modified Chain Sampling Plan (TSMChSP), Consumer’s risk, Operating characteristic values, Exponential distribution, Minimum size
I. INTRODUCTION
Acceptance sampling is a quality control method used to accept or reject a lot after testing a random sample of a product. Many re-searchers have given distinctive defini-tions for acceptance sampling but still all definidefini-tions have a similar essential thought of what acceptance sampling is. Based on all the definitions that have been stated before, it is clearly prove that acceptance sampling is an extremely valu-able technique when a lot is so large, but it is not applicvalu-able to inspect each item in the lot because the cost will be higher and it will take more time. Besides, there is a possibility to neglect some defective products and may pass the inspection point. The acceptance sampling plans can be classify into various distinctive ways. However, there are two major type of sampling plan namely attribute sampling plans and varia-ble sampling plans. The attribute sampling plan are meas-ured based on “go, no-go” basis meanwhile the variable sampling plans are
Revised Manuscript Received on March 08, 2019.
Sharifah NajlaaHanini Syed Abdullah, School of Quantitative Scienc-es (SQS), College of Arts and SciencScienc-es, Universiti Utara Malaysia, 06010 UUM Sintok, Kedah, Malaysia ,
Nazrina Aziz, School of Quantitative Sciences (SQS), College of Arts and Sciences, Universiti Utara Malaysia, 06010 UUM Sintok, Kedah, Malaysia
Institute of Strategic Industrial Decision Modelling (ISIDM), School of Quantitative Sciences (SQS), College of Arts and Sciences, Universiti Utara Malaysia, 06010 UUM Sintok, Kedah, Malaysia
Mohd Azri Pawan Teh, School of Quantitative Sciences (SQS) College of Arts and Sciences, Universiti Utara Malaysia, 06010 UUM Sintok, Kedah, Malaysia
measured based on a numerical scale such as height and weight. It is available with smaller sample size and gives more information about the lot than the attribute sampling plan.
For attribute sampling plans there are few type of sam-pling plan such as single acceptance samsam-pling plan (SSP), chain acceptance sampling plan (CHSP-1), two-sided com-plete chain sampling plan CChSP(0,1), two sided-modified complete chain sampling plan MCChSP( , two sided chain sampling plan (TSChSP) and two sided modi-fied chain sampling plan (TSMChSP). For this article, we will focus on TSMChSP as we found there is so much op-portunity to get better of the arrangement by concentrating on minimum number of sample size, and the probability of lot acceptance,
The first attribute sampling plan is the SSP developed by Epstein (1954).The SSP is the most widely recognized and simplest arrangement to utilize. However, it is inefficient when dealing with high quality products. In order to over-come the problem, Dodge (1955) proposed ChSP-1 to re-duce the incompetence and less discriminatory power of the SSP when the acceptance number is equivalent to zero. However, the consumers are not happy with ChSP-1 be-cause it only considered preceding information only. The CChSP(0,1) was further developed by Devaarul.S and Edna.K (2011) to ensure both preceding and succeeding samples are inspected. It gives more protection to the con-sumer while retaining the same amount of protection to the producer compare to ChSP-1. Later in 2018, Devaru and Vijila introduced MCChSP to protect producer by allowing the product lot to have acceptance number more than zero.
The TSChSP was initiated by Mughal, Zain and Aziz (2015). The operating procedure for TSChSP consider only one defective in both preceding and succeeding samples. However, the plan still has drawback where it still consider-ing at least one defect in both preceding and succeed-ing sample. To solve the drawback in the TSChSP, Mughal, Zain and Aziz (2015) proposed TSMChSP for Pareto Distri-bution of the 2nd kind. By applying the TSMChSP, it can ensure no defects in both preceding and succeeding samples. All sampling plan that have been discuss earlier have been develop for various lifetime distributions. In industry there are various product that follow different lifetime distribu-tion. For instance, capacitors and integrated circuit follow Exponential distribution. Past studies on the Single, Chain, Sharifah NajlaaHanini Syed Abdullah, Nazrina Aziz, Mohd AzriPawan Teh
Time Truncated Two Sided Modified
Chain Sampling Plans for Exponential
Group and Modified Group Chain Acceptance Sampling Plan that follows exponential distribution were first dis-cussed by Epstein (1954), Ramaswamy and Jayasri (2012), Kundu, Jun and Ahmad (2011), Teh, Aziz and Zain (2018), Jamaludin, Zain and Aziz (2017).However, to our knowledge TSMChSP only have been develop for Pareto Distribution of the 2nd kind. Therefore, in this study, TSMChSP for exponential distribution is developed.
II. GLOSSARY OF SYMBOLS : Sample size
: Number of defective products
: Allowable preceding and succeeding lots
: Producer’s risk (Probability of rejecting a good lot) : Consumer’s risk (Probability of accepting a bad lot)
Mean ratio
Probability of lot acceptance
Test termination time
III. EXPONENTIAL DISTRIBUTION
Exponential distribution is a simple distribution with just a single parameter and is ordinarily used to model reliability data. Not only that, it is also gives a decent model for the phase of a product's life when it is just as likely to fail at any time.
According to Epstein (1954) the Cumulative Distribution Function (CDF) of an exponential distribution can be writ-ten as follow:
(1) Given is the scale parameter. Eq.2 shows probability of failure, . It is a probability that a product will be fail at a specified time and can be obtained as:
. (2) There are two risk in acceptance sampling which is pro-ducer’s and consumer’s risk. The probability of rejecting a good lot is known as producer’s risk and the chance of ac-cepting bad lot is known as consumer’s risk. Consumer’s risk is used when selecting the design parameters for the TSMChSP and it is presented as, . Then the minimum sample size for the TSMChSP is calculated by using:
(3) The operating characteristic (OC) function of TSMChSP is given by:
(4) Where, is the probability of finding zero defective in a sample and is the probability of finding one defective in a sample.The operating characteristic (OC) function of TSMChSP is given by:
(5)
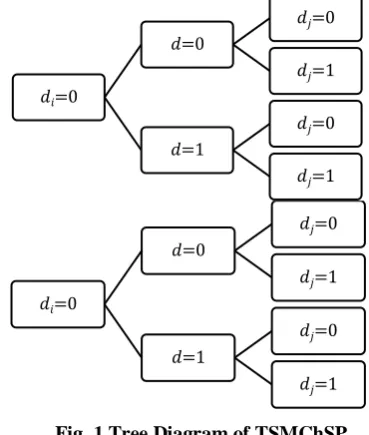
Figure 1 displays all the possible outcomes of TSMChSP based on preceding and succeeding lots.
Fig. 1Tree Diagram of TSMChSP
The operating steps are make based on tree diagram above. For instance, if the number of preceding and succeeding is equal to zero, then accept the lot but if there is a defective either in preceding and succeeding lot, then reject the lot.
IV. OPERATING STEPS
TSMChSP requires three design parameters which are the sample size, allowable preceding and succeeding lots, de-noted by and respectively. The operating steps are as follow:
i. For each lot, find the minimum sample size and test each unit for conformance to the specified requirements. ii. Accept the lot, if provided that preceding and
succeeding samples have no defects, if , reject the lot. iii. Accept the lot if the number of defectives, , provided
that have no defectives are found in both preceding and
succeeding samples.
The performances of the TSMChSP are measured based on two criteria which are the number of minimum sample size, and the probability of lot acceptance, Table 1 shows the number of minimum sample size, for TSMChSP for Exponential distribution at different values of design parameters: specified constant, , consumer’s risk, , number of allowable preceding and succeeding lots .
𝑑𝑖=0
𝑑=0
𝑑𝑗=0
𝑑𝑗=1
𝑑=1
𝑑𝑗=0
𝑑𝑗=1
𝑑𝑖=0
𝑑=0
𝑑𝑗=0
𝑑𝑗=1
𝑑=1
𝑑𝑗=0
[image:2.595.326.511.77.295.2]International Journal of Innovative Technology and Exploring Engineering (IJITEE) ISSN: 2278-3075, Volume-8 Issue-5S March, 2019
[image:3.595.49.556.403.707.2]V. RESULT
Table. 1 Number of minimum sample size, for Exponen-tial Distribution
a 0.2
5 0. 5
0.7 5 1
1.2 5
1. 5
1.7 5
2
0.0 1
1 8 4 3 3 2 2 2 2
2 5 3 2 2 1 1 1 1
3 3 2 2 1 1 1 1 1
4 3 2 1 1 1 1 1 1
5 2 1 1 1 1 1 1 1
0.0 5
1 6 3 2 2 2 1 1 1
2 3 2 1 1 1 1 1 1
3 2 1 1 1 1 1 1 1
4 2 1 1 1 1 1 1 1
5 2 1 1 1 1 1 1 1
0.1 0
1 5 2 2 2 1 1 1 1
2 3 2 1 1 1 1 1 1
3 2 1 1 1 1 1 1 1
4 2 1 1 1 1 1 1 1
5 1 1 1 1 1 1 1 1
As shown in Table 1, the number of minimum sample size, for the TSMChSP following Exponential distribution
at different values of design parameters is presented satisfy-ing Eq.4.
Based on Table 1, the number of minimum sample size,
decreases as the consumer’s risk, , the specified constant, and the number of allowable preceding and succeeding lots, increases. For in-stance, if the consumer’s risk, is 0.10, the number of allowable preceding and succeeding lots, is 1 and the specified constant, is 0.25, then the
number of minimum sample size, is 5. It shows that, the number of minimum sample size, is inversely proportional to the design parameters.
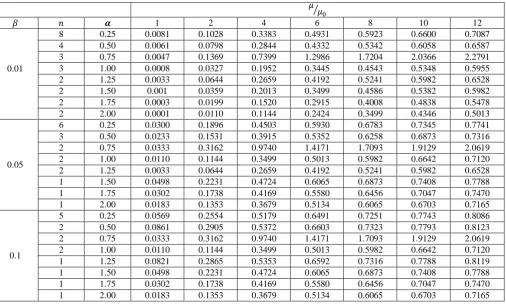
Once the minimum sample size, is obtained, one may interested to find the probability of a lot acceptance, . The probability of lot acceptance, increases as the value of mean ratio, increases. Consider and , the probability of lot acceptance, is 0.0569. The probability of lot acceptance, increases from 0.0569 to 0.8086 when the value of mean ratio, increases from 1 to 12 as shown in Figure 2. It means that the probability of lot acceptance, increases from 5.69% to 80.86% when the true mean lifetime of a product is 12 times higher than the specified mean lifetime.
Table. 2 Probability of lot acceptance for exponential distribion
1 2 4 6 8 10 12
0.01
8 0.25 0.0081 0.1028 0.3383 0.4931 0.5923 0.6600 0.7087
4 0.50 0.0061 0.0798 0.2844 0.4332 0.5342 0.6058 0.6587
3 0.75 0.0047 0.1369 0.7399 1.2986 1.7204 2.0366 2.2791
3 1.00 0.0008 0.0327 0.1952 0.3445 0.4543 0.5348 0.5955
2 1.25 0.0033 0.0644 0.2659 0.4192 0.5241 0.5982 0.6528
2 1.50 0.001 0.0359 0.2013 0.3499 0.4586 0.5382 0.5982
2 1.75 0.0003 0.0199 0.1520 0.2915 0.4008 0.4838 0.5478
2 2.00 0.0001 0.0110 0.1144 0.2424 0.3499 0.4346 0.5013
0.05
6 0.25 0.0300 0.1896 0.4503 0.5930 0.6783 0.7345 0.7741
3 0.50 0.0233 0.1531 0.3915 0.5352 0.6258 0.6873 0.7316
2 0.75 0.0333 0.3162 0.9740 1.4171 1.7093 1.9129 2.0619
2 1.00 0.0110 0.1144 0.3499 0.5013 0.5982 0.6642 0.7120
2 1.25 0.0033 0.0644 0.2659 0.4192 0.5241 0.5982 0.6528
1 1.50 0.0498 0.2231 0.4724 0.6065 0.6873 0.7408 0.7788
1 1.75 0.0302 0.1738 0.4169 0.5580 0.6456 0.7047 0.7470
1 2.00 0.0183 0.1353 0.3679 0.5134 0.6065 0.6703 0.7165
0.1
5 0.25 0.0569 0.2554 0.5179 0.6491 0.7251 0.7743 0.8086
2 0.50 0.0861 0.2905 0.5372 0.6603 0.7323 0.7793 0.8123
2 0.75 0.0333 0.3162 0.9740 1.4171 1.7093 1.9129 2.0619
2 1.00 0.0110 0.1144 0.3499 0.5013 0.5982 0.6642 0.7120
1 1.25 0.0821 0.2865 0.5353 0.6592 0.7316 0.7788 0.8119
1 1.50 0.0498 0.2231 0.4724 0.6065 0.6873 0.7408 0.7788
1 1.75 0.0302 0.1738 0.4169 0.5580 0.6456 0.7047 0.7470
1 2.00 0.0183 0.1353 0.3679 0.5134 0.6065 0.6703 0.7165
Suppose that u and are true and specified mean life of a prod-uct respectively. A lot is considered good if the true mean life, . For more explanation, one may refer to Jamaludin et al. (2017). Assume that the lifetime distribution of the product follows Exponential distribution with the level of consumer’s confidence is 0.99. The product is consider as good only when its true mean life is at least 1000 hours. If, during inspection hours have not more
Then, the performances of the TSMChSP and TSChSP are com-pared. The performances of these two sampling plans are explained based on two criteria, which are the number of minimum sample size, and the probability of lot acceptance,
[image:4.595.45.542.117.244.2]Table 3 shows the number of minimumsample size, for the TSMChSP and the TSChSP for Exponential distribution when consumer’s risk is 0.01.
Table. 3Number of minimumsample size for Exponential distribution for different sampling plans.
TSMChSP TSChSP
0.01
0.25 8 9
0.5 4 5
0.75 3 3
1 3 3
1.25 2 2
1.5 2 2
1.75 2 2
2 2 2
As shown in Table3, for most values of the specified constant , the number of minimum sample size, for TSMChSP is smaller compared to TSChSP. For instance, TSMChSP requires 8 mini-mum sample size meanwhile the TSChSP needs 9 minimini-mum sam-ple size when the design parameters for both plan are . The smaller sample size, will reduce the cost and inspection time.
Table 4 shows the probability of lot acceptance, for the TSMChSP and TSChSP for Exponential distribution. It presents that TSMChSP is smaller compared to TSChSP, for most value of specified constant, . For instance, the probability of lot ac-ceptance, for the TSMChSP is 0.0081 meanwhile for the TSChSP is 0.0072 when the design parameters for both plan are
Besides, the probability of lot acceptance, for both sam-pling plans increases as the value of mean ratio, increases. For instance, the probability of lot acceptance, with , for TSMChSP and TSChSP are 0.0081 and 0.0072, respectively when the value of mean ratio is .
Table. 4 Probability of lot acceptance for Exponential distribution for the TSMChSP and TSChSP.
0
TSMChSP TSChSP
0.01
1 0.0081 0.0072
2 0.1028 0.1162
4 0.3383 0.3997
6 0.4931 0.5733
8 0.5923 0.6758
10 0.6600 0.7412
12 0.7087 0.7857
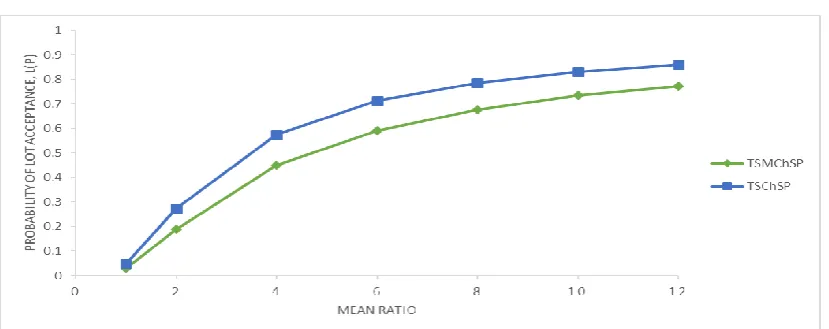
[image:4.595.49.464.547.711.2]The probability of lot acceptance, ) for both sampling plans increases to 0.7087 and 0.7857, respectively when the value of mean ratio, . It is found that, the probability of lot ac-ceptance, for TSMChSP increases from 0.81% to 70.87%. Meanwhile, TSChSP increases from 0.72% to 78.57% when true mean lifetime of a product is twelve times higher than the specified mean lifetimefor both sampling plans. Figure 2 described the effect of different values of mean ratio, on the probability of lot acceptance,
Fig. 2 Probability of lot acceptance versus mean ratio for Exponential distribution for two different sampling plans
Figure 2 indicates that the lot of acceptance, for exponential distribution for the TSMChSP and TSChSP when the design
International Journal of Innovative Technology and Exploring Engineering (IJITEE) ISSN: 2278-3075, Volume-8 Issue-5S March, 2019
As can be seen in Figure 2, the value of mean ratio and the probability of lot acceptance for TSMChSP are always lower compared to TSChSP. For details explanation, we may referred to the probability of lot acceptance, for Exponential distribution when and is 0.0081 for TSMChSP and 0.0072 for TSChSP. The finding shows that the performance of the TSMChSP is better than TSChSP in terms of the number of mini-mum sample size, and the probability of lot acceptance, .
VI. CONCLUSION
In this study, TSMChSP for exponential distribution is devel-oped with the main purpose of minimizing the consumer’s risk, . The design parameters used in this article are specified constant consumer’s risk, number of allowable preceding and succeeding lots The performances of the TSMChSP are measured based on two criteria, which are minimum sample size, and the probability of lot acceptance, .
The first criterion discussed that, the number of minimum sam-ple sizes decreases as the value of specified constant increases. Besides, the number of minimum sample size, also decreases as the number of allowable preceding and succeeding lots, in-crease. Finally, the number of minimum sample sizes, also de-creases as the value of consumer’s risk, increases. For the second criterion, it can be explained that, the probability of lot acceptance, increases as the value of mean ratio, increases. This result is comparable with past studies.
The performances of the TSMChSP are then compared with the TSChSP based on two criteria, which are the number of minimum sample size and the probability of lot acceptance, . Based on these two criterion the performance of the TSMChSP is better than TSChSP. The result has shown that the TSMChSP has a smaller number of minimum sample size, compared to TSChSP. Besides, the probability of lot acceptance, for TSMChSP is smaller compared to TSChSP. For future researches, TSMChSP can be further developed for other lifetime distributions. By having TSMChSP with various lifetime distribution in future, it can allows producer in industry to select the best sampling plan for their pro-duction.
REFERENCES
1. Dodge, H. F, Chain Sampling Inspection Plan, Industrial Qual-ity Con-trol, 11, No.4 (1955), 10-13
2. D. C. Montgomery, Statistical Quality Control: A Modern Introduction, 6th ed. Arizona: Wiley, 2009.
3. Epstein, B., 1954. Truncated life tests in the exponential case. Ann. Math. Stat., 25: 555-564.
4. Mughal, A.R., Z. Zain and N. Aziz, 2015c. New two sided complete group chain sampling plan for Pareto distribution of the 2nd kind. Int. J. Appl. Eng. Res., 10(12): 31855-31860
5. M. A. P. Teh, N. Aziz and Z. Zain, Time truncated group chain sam-pling plans for Exponential distribution, Global Journal of Pure and Applied Mathematics, 119, No. 3 (2018), 491-500. DOI: 10.12732/ijpam.v119i3.9
6. A. R. S. Ramaswamy and S. Jayasri, “Time Truncated Chain Sampling Plans for Generalized Rayleigh Distribution,” International Refereed Journal of Engineering and Science, 3, No 2 (2014), 49-53.
7. A. R. S. Ramaswamy and S. Jayasri, Time Truncated Chain Sampling Plans for Generalized Exponential Distribution (International Journal of Computational Engineering Research, 2012), pp. 1402–1407. 8. Aslam, M., Kundu, D., and Ahmad, M., “Time Truncated Ac-ceptance
Sampling Plan for Generalized Exponential Distribu-tion,” J. Appl. Stat., Vol. 37, 2010, pp. 555–566
9. Mughal, A.R, Z. Zain, and N. Aziz, “Time truncated group chain sam-pling strategy for pareto distribution of the 2nd kind,” Research Journal of Applied Sciences, Engineering and Technology, vol. 10, pp. 471-474, June. 2016.
10. M. A. P. Teh, N. Aziz, and Z. Zain, “Time truncated group chain sam-pling plans for rayleigh distribution,” Global Journal of Pure and Ap-plied Mathematics, vol. 12, pp. 3693-3699, Aug. 2016.
11. M. A. P. Teh, N. Aziz, and Z. Zain, “Group chain sampling plans based on truncated life tests for log-logistic distribution,” International Jour-nal of Applied Engineering Research, vol. 11, pp. 8971-8974, Oct. 2016.
12. M. A. P. Teh, N. Aziz, and Z. Zain, “Group chain sampling plans based on truncated life test for inverse rayleigh distribution,” Research Jour-nal of Applied Sciences, vol. 11, pp. 1432-1435, Nov. 2016.
13. Mughal, A.R., 2011. A hybrid economic group acceptance sampling plan for exponential lifetime distribution. Econ. Qual. Control, 26: 163-171.
14. Mughal, A.R. and M. Aslam, 2011. Efficient group acceptance sam-pling plans for family Pareto distribution. Cont. J. Appl. Sci., 6(3): 40-52.
15. Mughal, A.R., M. Hanif, M. Ahmed and A. Rehman, 2011. Economic reliability acceptance sampling plans from truncated life tests based on the burr type XII percentiles. Pak. J. Commerc. Soc. Sci., 5(1): 166-176. 16. Mughal, A.R., Z. Zain and N. Aziz, 2015a. Time Truncated group
chain sampling strategy for Pareto distribution of the 2nd kind. Res. J. Appl. Sci. Eng. Technol., 10(4): 471-474.
17. Mughal, A.R., Z. Zain and N. Aziz, 2015b. Group acceptance sampling plan for re-submitted lots under generalized Pareto distribution. Res. J. Appl. Sci. Eng. Technol., 10(5): 599-606.
18. Mughal, A.R., Z. Zain and N. Aziz, 2015c. New two sided complete group chain sampling plan for Pareto distribution of the 2nd kind. Int. J. Appl. Eng. Res., 10(12): 31855-31860.
19. Mughal, A.R., Z. Zain and N. Aziz, 2015d. Economic reliability GASP for Pareto distribution of the 2nd kind using Poisson and weighted Pois-son distribution. Res. J. Appl. Sci., 10(8): 306-310.
20. Mughal, A. R., Zain, Z., and Aziz, N. (2016 a). Time Truncated Efficient Testing Strategy for Pareto distribution of the 2nd kind using Weighted Poisson & Poisson distribution. SainsMalaysiana, 45(11), 1763-1772.
21. Devaarul. S and Vijila. M, Modified Complete Chain Sampling Plans For Inexpensive or Non-Destructive Products p – MCChSP (c1, c2, i, j), International Journal of Applied Engineering Research, 2018, 3(2): 78-82
22. Vijila. M and DevaArul.S, Construction and Selection of Two Sided Complete Chain Sampling Plans – CCHSP (0,1) Indexed Through AOQL, International Journal of Scientific Research and Management (IJSRM), 5, No 10 (2017), 7303-7307
23. A. F. Jamaludin, Z. Zain, N. Aziz, A Modified Group chain sampling plans for Lifetimes following a Rayleigh Distribution, Global Journal of Pure and Applied Mathematics, 12, No. 5 (2016), 3941-4947. 24. A. F. Jamaludin, Z. Zain, N. Aziz, A Time Truncated Modified Group