International Journal of Innovative Technology and Exploring Engineering (IJITEE) ISSN: 2278-3075, Volume-8 Issue-6, April 2019
Abstract IoT today resembles the Internet itself, as it was in its earliest stages around 2 decades back, loaded with guarantee and potential yet at the same time a calculated jump for some people. The era of wireless devices has begun and the use of wired connection devices has reduced at an exponential rate. Now every device is connected wire lessly and every device has connectivity among themselves also. Recent developments and researches show that Internet of Things (IOT) is restricted to only few data based sensors and its full potential is yet not utilized. Regarding main issues of greater discharge of CO2 emissions, there emerges a new path for IoT implementation using sensors and other data to save and reduce energy consumption and thus reducing CO2 emissions. The routing of messages is done through routing protocol of IPv6 standardized for Low Power and Lossy Network (LLN). Our paper not only decreases the energy consumption but also proves that the total cost of running is cheaper than the traditional system.
Index Terms: Low Power and Lossy Networks (LLN), Wireless Things Networks (WTN), IoT.
I. INTRODUCTION
The IoT is network of embedded devices that are capable of communicating with the outside environment. However of communicability among devices or Things, it has been a centre of attraction for future innovations. It consists of many wireless interconnected sensors that provide data or information which is then sent for processing. The processed data or information is then analyzed and used in operation or is sent directly to other sensors for further fetching of data. IoT has a huge impact in energy efficiency as the energy consumption in urban areas is increasing and the supply of energy is going to decrease. High energy consumption also leads to a greater release of carbon footprint which results in environment degradation. By decreasing the energy offices, schools, etc. could help preserve the energy resource and also save money on energy by using energy efficiently [1]. All the devices versioned to contribute in energy saving process that are connected are cheap and very small thus taking less area and consuming very less power. All these devices or things are designed to work with LLN using very less power consumption for routing. The LLN protocol controls vectors (arrays) of separations to different hubs in the system. It has less computation complexity thus saving
Revised Manuscript Received on April 06, 2019.
Neetu Faujdar, Dept of CSE, Amity University, Noida, India.
Yashita Verma, Dept of CSE, Amity University, Noida, India.
Akash Punhani, Dept of CSE, Amity University, Noida, India
Overhead cost and message overhead. The benefit of LLN is also that it allows the sender to specify completely or partially the route to be taken through the network i.e. enabling a node to find all possible routes to the host [2].
For easy understand ability, we have divided this research paper into sections with first section with introduction. Second section listed the advantages of using LLN and the related work which will explore the already done work. Third section is introduced the problem statement. Fourth section explores the analysis of proposed solution. Fifth section is related to the analysis and solution. Sixth section is related to the conclusion and future work to be done later on this research topic.
II. LITERATUREREVIEWANDLLNADVANTAGE
Nadeem Javaid et al, designed the routing algorithm BEAR i e. Balanced Energy Adaptive Routing for IOT aiming to extend the life of Underwater WSNs. It eliminates the need of supervision by geological processes, imaging and environment on accounts of better battery power, less signal loss and increased bandwidth. It intends at balanced and efficient consumption of energy. It works on the methodology of exploiting the information related to location, choosing its neighbors, aiding the successor nodes and choosing the elite forwarder node. It works in initialization phase, tree construction phase and data transmission phase. BEAR extended and lengthened the network lifetime by approximately 55% [3].
Worrajak Muangai et al, proposed IOT transmission to meter of energy with the help of Modulus to supervise the energy consumption of Ready-to-Have Fruit Juice manufacturing. This interpretation and monitoring was done in the Second Royal Factory found at Mae Chan. It evaluated SEC Parameters for energy consumption per product. Real Time Data was collected and interpreted for better accuracy in monitoring and results. The analysis suggested that the ready to have fruit juice had enormous energy costs compared to other production lines.
Hence, the Royal Institute needs to speed up the advancement of energy efficacy by a modernized structure. Hence, targeting system for energy dissipation by IOT is given in Fig 1 [4].
Effective Utilization and Delimiting Energy
Consumption Based on IOT
Fig. 1. Targeting System for Power Consumption using IOT
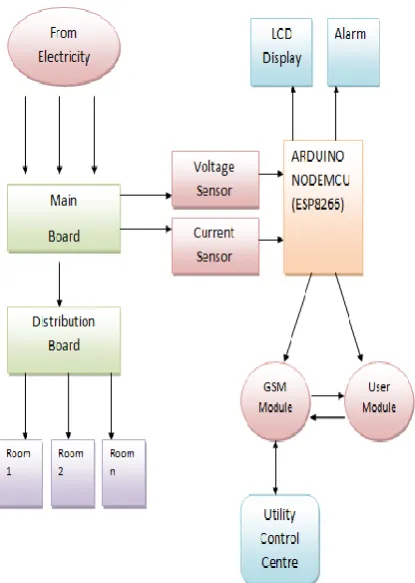
Anitha K et al presented efficient energy meter observation by IOT. It is achieved with the help of the Arduino esp8266 micro controller programmed with GSM Modules. This system helps customers know the energy dissipated and consumed everyday hence aiding them to decrease per day diminution
. It also minimizes the human reliance in order to record every months read hence preserving time as well as money. This also has the system of pre-announcing the turn off technicalities in order to take immediate precautions and aids charging the required gadgets only. It has a facility of an alarm system which guides customers and generates awareness. Also, it avoids the sheer wastage of energy as it automatically disconnects the power by a message whenever the residents of the house are not at home. Block Diagram of Hardware Module is given Fig 2 [5].
Fig. 2. Functional Block Diagram of Hardware Module
[image:2.595.324.542.266.563.2]Shaojun Gan et al, proposed an energy usage supervising structure that merges the abilities of IOT and Cloud Computing in order to accomplish non invasive remote supervision in Industry. This interpretation and monitoring was done at a local bakery. It evaluated the energy consumption of a mixer against the working time. The developed system aimed at easy installation at industrial sites and was expansible. The analysis suggested that the mixer showed a fierce correlation to working time but it was not linearly correlated. This interactive IOT System took energy usage data. Further, it published it to the data centre spontaneously through the wireless communication network by the MQTT (Message Queuing Telemetry Transport) protocol, and a web server driven by Apache was developed to give a human-data interaction dashboard in B/S (Browser/ Server) structure. The structure of the proposed model is given in Fig 3 [6].
Fig. 3. System Structure of Proposed Interactive System
Mohammad Hossein Yaghmaee et al, by utilizing the abilities of IOT constructed and actualized a smart energy mattering platform based on the concept of smart grid which consists of smart gateways, plugs and servers. The system aims to give immediate news to residents of their electricity
usage here by decreasing the cost and amount of load in peak hours. The system supervises the power usage and transmits them to central server on Internet by an immediate gateway. The system can support HTTP, COAP, MQTT and several other data formats like JSON and HTML. It also has the capability to function in both Web Server and Web Client. The module view controller
[image:2.595.72.280.442.734.2]International Journal of Innovative Technology and Exploring Engineering (IJITEE) ISSN: 2278-3075, Volume-8 Issue-6, April 2019
Fig. 4. Module View Controller Architecture
Various propositions have been produced and only a few of them have implemented. Different models work using different devices. Some models use Wi-Fi router for easy message transfer between devices. Some models have cloud servers while some have a parent node which monitors the system.There are many advantages of using wireless network protocols with LLN as they consume very less power [9]. Some of the advantages are [8]:
1. Reduced installation cost: The installation cost will be very less since everything would be wireless. Wire line connections require material and proper lying by specialists which would incur a great cost [10].
2. Easy extension: New devices would be added easily as wireless network would be used and no wire would be needed thus not requiring any planning for laying wire for the new device [11].
3. Remote: Since the network is wireless therefore it could be monitored or operated remotely thus increasing user friendliness [12-15].
III. PROBLEMSTATEMENT
Here a Lab Automation System is considered which faces many concerns such as waste of energy in case all the systems are not occupied and are running idle resulting in waste of energy. Other challenges faced are resoluteness, poor sensibility and trouble in accomplishing security.
The prime objective of this work is to successfully execute Lab Automation System and show that it saves energy than the convention lab system which does not has any sensors. The proposed system will use different sensory data and send it to the server which will compute calculations and thus operate. The system will have high flexibility by using Wi-Fi routers which will interconnect all the devices in the system and will decrease the deployment cost will easy upgrading and extension of the system. We propose a design which guaranteed energy efficiency with very less emissions using RPL (Recognition of prior learning). The server will control and monitor the sensors and based on the data or information acquired by the sensors, the server will command the devices or things to operate. The proposed model by using the Wi-Fi technology to connect all the devices and sensors deployed
will control the energy usage and thus try to show optimal solution to the energy conservation.
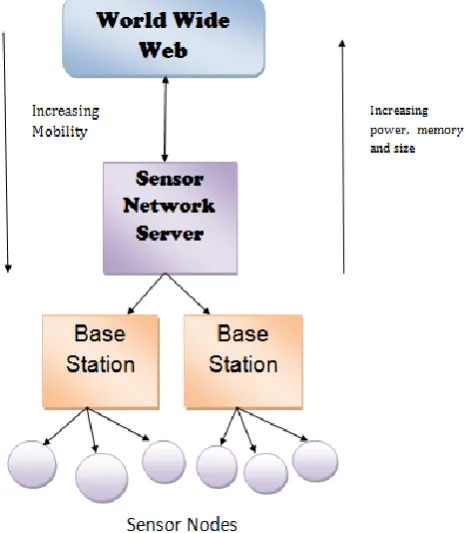
[image:3.595.315.548.216.483.2]Optimized Green Routing Protocol is used in this model. In this all the connected through WTN (Working Telephone Number) will capture the motion and transmit the data to the server and the server will switch ON the system the user finally sits on. All other devices are applied with the same fundamental so that to give them additional capacity to sensor and for the connectivity also. The model using the protocols will only use the necessary devices required at that instant while rest of the devices will be in sleep or hibernate mode so that energy conservation is at its peak.
Fig. 5. Network of Sensor Nodes and Server
IV. ANALYSISOFPROPOSEDSOLUTION
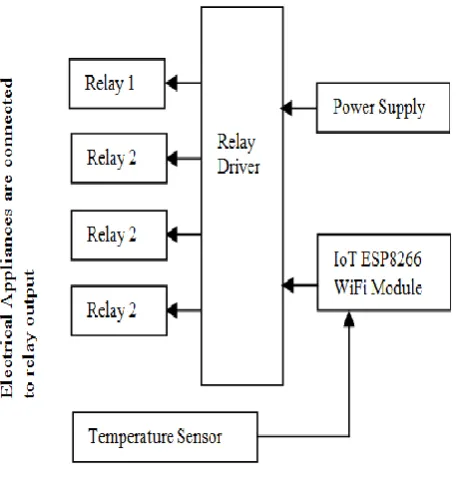
The model consists of many sensors like temperature, motion, etc. All the devices will be connected to relays those will power devices when needed. LLN networks work on very low power and DAG (Directed Acyclic Graph) will be created in the lab from host to node. When the connection established it will start reading values from the sensors and based on the reading from the sensors, it will operate the lab. When a man enters in the lab by sensors at entryway sense the data and passes it to root node server for handling through directed acyclic graph, which drives high rate of information transmission from sensors to the server node.
By finding the nearness of individual by sensors server works a few activities like Switching ON fans and lights. According to individual sits on framework sensors initiates and exchange the information to server and server process its demand and switch ON
no individual on frameworks they are in rest mode and subsequently lights and devotees of separate part of room will likewise be off.
Fig. 6. Proposed System Model
The proposed methodology for energy efficient routing will be as follows:
1. Sensors will first sense the presence of an individual and turn on the lights.
2.The temperature sensor will sense the temperature and based on that will operate the air conditioner.
3.The sensed data is transmitted from the sensor to the server and the principal functioning of the protocol will begin. 4. As soon as the individual will sit on a computer system, the system will switch ON the lights and fans above it.
5. Keeping others turned OFF thus saving energy.
6. Now using the protocol, an optimal path will be chosen to transmit data from server to node using DAG.
6.There is no additional discharge of carbon impression CO2
in view of less utilization of machines which prompts them in SLEEP MODE and that control the outflow of CO2 from
them.
V. ANALYSISANDOBSERVATION
This way the whole Lab Automation System works and we have collected some data from our college labs which are taken in two cases.
A. Without Green IOT
In this condition, the energy consumption is calculated when IoT is not implemented i.e. ideal lab without any sensors to save energy. Table I describes the items without green-IOT and W stands for total power rating. Graph is also designed from Table I, which is shown in Fig 7. Given below, is Fig 7 Graph illustrating the Without Green IOT. The equipments are fixated on X-axis and its corresponding values are fixated at Y-axis. A triple bar graph is drawn for the values. The blue color stands for items, red color stands for total power rating and green stands for cost per month. It is clear from the graph
that with increase in the corresponding values, the total power rating and cost per month increases.
TABLE I Without Green IOT
Appliances Items W Cost Per Month
Fan 900 54000 64800
Light 900 36000 43200
A.C. 100 400000 360000
P.C. 3500 350000 420000
P.C. (Standby) 3500 1750 2100
Projector 100 60000 72000
printer 200 4000 4800
Total Rs.966900
Fig. 7. Energy Consumption using Without Green-IOT
B. With Green IOT
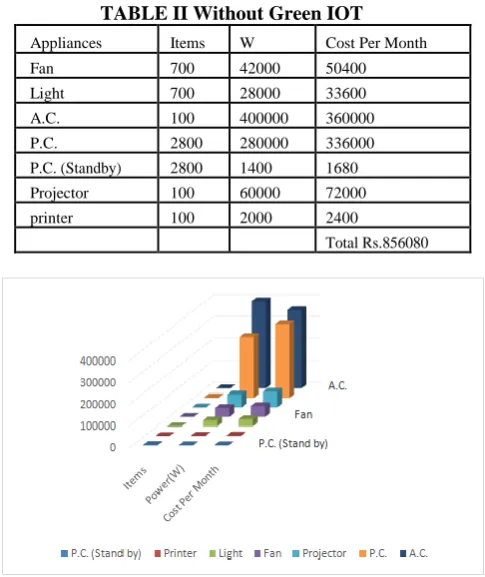
In this condition, the energy consumption is calculated when IOT is implemented and all the sensors are running are trading data. Table II describes the items with green-IOT and W stands for total power rating. Graph is also designed from Table II, which is shown in Fig 8. Given below, is Fig 8 Graph illustrating the With Green IOT. The equipments are fixated on X-axis and its corresponding values are fixated at Y-axis. A triple bar graph is drawn for the values. The blue color stands for items, red color stands for total power rating and green stands for cost per month. It is clear from the graph that with increase in the corresponding values, the total power rating and cost per month increases. However, the cost per month is comparatively lesser than the Graph illustrating Without Green IOT.
The applied methods and techniques will result in a very less emission of CO2 into the environment. To evaluate the
[image:4.595.61.293.87.334.2]International Journal of Innovative Technology and Exploring Engineering (IJITEE) ISSN: 2278-3075, Volume-8 Issue-6, April 2019
TABLE II Without Green IOT
Appliances Items W Cost Per Month
Fan 700 42000 50400
Light 700 28000 33600
A.C. 100 400000 360000
P.C. 2800 280000 336000
P.C. (Standby) 2800 1400 1680
Projector 100 60000 72000
printer 100 2000 2400
Total Rs.856080
Fig. 8. Energy Consumption using With Green-IOT
Using the values generated by calculating the power and thereby the cost of operating them, we can calculate the average cost that would come to operate these mechanisms. We can see that cost of power consumption is very high if Green IOT is not implemented whereas the cost of power consumption with Green IOT being implemented is very low. But the total cost of operating consists of cost of running the devices plus the cost of operating the sensors.
So the total cost i.e. cost of device operation and cost of sensor operating is low compared to running cost without Green IOT. Therefore, this model is capable of reducing consumption with cost of operation less than the actual cost of running. Table III describes the cost of sensor usage and W stands for total power rating. Graph is also designed from Table III, which is shown in Fig 9. Given below, is Fig 9 Graph illustrating the Cost of Sensor Usage. The sensors are fixated on X-axis and its corresponding values are fixated at Y-axis. A triple bar graph is drawn for the values. The blue color stands for items, red color stands for total power rating and green stands for cost per month. It is clear from the graph that with increase in the corresponding values, the total power rating and cost per month increases. However, the cost per month is comparatively lesser than the Graph illustrating Without Green IOT.
TABLE III Cost of Sensor Usage
Appliances Items W Cost Per Month
Relay 1000 50000 60000
Router 500 10000 12000
Temperature Sensor 200 100 120
Motion Sensor 800 80 96
Arduino Uno R3 100 20 100
ATmega1281 100 50 100
Total Rs.72416
Fig. 9. Cost of sensor usage
VI. CONCLUSIONANDFUTUREWORK
A model is proposed which will help save energy consumption and thus helps save the environment for CO2
emissions. This model is supposed to tackle all the issues faced by the Internet of Things in the outside world.
Later in this model, more advance algorithms will be implemented to reduce the cost further and security issues will be discussed and certain implementations will be done to increase the security of the system from the outside open world of Internet of Things.
ACKNOWLEDGMENT
Authors are very thankful to the research environment provided by Amity University, Noida, India. All experimental results are verified in the research lab of this organization.
REFERENCES
1. Sirsath N. S, Dhole P. S, Mohire N. P, Naik S. C & Ratnaparkhi N.S , “Automation using Cloud Network and Mobile Devices,” In: Vidyanagari, Parvati, Pune-411009, India University of Pune. 2. DeepaliJavale, Mohd. Mohsin, ShreerangNandanwar, “LAB
Automation and Security System Using Android ADK”, International Journal of Electronics Communication and Computer Technology (IJECCT), 2(3), 2013.
3. Nadeem Javaid, Saman Cheema, Mariam Akbar, Nabil Alrajeh, Mo-hamad Souheil Alabed and Nadra Guizani, “On Balanced Energy Consumption based Adaptive Routing for IoT Enabling Underwater Wsns”, IEEE Access, vol 5, pp. 10040-10051, 2017.
4. Worrajak Muangjai, Phichad Thanin and Wichan Jantee, “On An Apply IoT for Collection and Analysis of Specific Energy Consumption in Production Line of Ready-to-Drink Juice at the Second Royal Factory Mae Chan”, IEEE International Conference and Utility Exhibition on Green Energy for Sustainable Development (ICUE), 2018.
5. Anitha.K, Prathik.M and Anitha.V, “On Smart Energy Meter Surveil-lance using IoT”, IEEE International Conference on Power, Energy, Control and Transmission Systems (ICPECTS), 2018. 6. Shaojun Gan, Kang Li, Yanxio Wang and Che Cameron, “On IoT based
energy consumption monitoring platform for Industrial processes”, UKACC 2018.
[image:5.595.47.290.50.339.2]8. A. Yadav, N. Rakesh, S. Pandey and R. K. Singh, “IoT -An integrated framework for rapid trusted IOT application development,” IEEE Inter-national Conference on Recent Trends in Electronics, Information & Communication Technology (RTEICT), pp. 1829-1834, 2016. 9. Yadav A., Rakesh N., Pandey S., Singh R.K, “Development and
Analysis of IoT Framework for Healthcare Application,” Advances in Computer and Computational Sciences in Intelligent Systems and Computing, 2018.
10. Gupta K., Rakesh N, “IoT-Based Solution for Food Adulteration,” Pro-ceedings of First International Conference on Smart System, Innovations and Computing Springer, Singapore, pp. 1829-1834, 2016. 11. Jyoti Mangla, Nitin Rakesh, Rakesh Matam, “Analysis of Mobility Aware Routing Protocol for Underwater Wireless Sensor Network,” Pro-ceedings of First International Conference on Smart System, Innovations and Computing Springer Singapor, 2018.
12. Nitin Rakesh and Vipin Tyagi, “Linear-code multicast on parallel archi-tectures,” Advances in Engineering Software, pp. 1074-1088, 2011.
13. Faujdar Neetu and SP Ghrera, “Modified Levels of Parallel Odd-Even Transposition Sorting Network (OETSN) with GPU Computing using CUDA,” Pertanika J. Sci. and Technology, pp. 331-350, 2016. 14. Kaduskar, V. P., Gupta, N., Bhardwaj, Y., & Kumar, S, “IOT BASED
LAB AUTOMATION SYSTEM,” International Journal of Current En-gineering and Scientific Research (IJCESR) , 4(6), pp. 113-117, 2017.
AUTHORSPROFILE
Dr. Neetu Faujdar, is currently working as an Assistant Professor in Amity School of Engineering and Technology, Amity University, Noida. She has completed her Ph.D. from Jaypee University of Information Technology, Solan, H.P. from July 2013 - Feb 2017 on the topic "Performance Analysis of Sorting Algorithms uses GPU Computing with
CUDA Hardware". She has Completed her M.Tech (Computer Science
Engineering) in 2013 from Invertis University Bareilly and B.Tech (Information Technology) in 2011 from VTU University Belgaum. She has been the member of IAENG since2015. She has published 3 book chapters and more than 20 research papers publications in different International Journals and in Proceedings of International Conferences of repute. She has 6 years of teaching and research experience with leading institutions. Her area of interest includes Algorithms, High Performance Computing Architecture, and GPU Computing.
Yashita Verma, is currenty doing BTech in CSE from Amity School of Engineering and Technology, Amity University, Noida. She has published a research paper in Springer conference.