Improving Education Through Data-Driven Decisions
Laura G. Knapp, Elizabeth Glennie, & Karen J. Charles
LEVERAGING
DATA
FOR STUDENT
for Student Success:
Improving Education Through
Data-Driven Decisions
Laura G. Knapp, Elizabeth Glennie,
and Karen J. Charles
Triangle Institute. The RTI logo is a registered trademark of Research Triangle Institute.
This work is distributed under the terms of a Creative Commons Attribution-NonCommercial-NoDerivatives 4.0 license (CC BY-NC-ND), a copy of which is available at https://creativecommons.org/licenses/ by-nc-nd/4.0/legalcode.
Library of Congress Control Number: 2016954669
ISBN 978-1-934831-20-5 (refers to print version)
RTI Press publication No. BK-0018-1609
https://doi.org/10.3768/rtipress.2016.bk.0018.1609 www.rti.org/rtipress
Cover design: Danielle Hennis
tools, and technical expertise to a national and international audience. RTI Press publications are peer-reviewed by at least two independent substantive experts and one or more Press editors.
RTI International is an independent, nonprofit research institute dedicated to improving the human condition. We combine scientific rigor and technical expertise in social and laboratory sciences, engineering, and international development to deliver solutions to the critical needs of clients worldwide.
This publication is part of the RTI Press Book series. RTI International
3040 East Cornwallis Road, PO Box 12194 Research Triangle Park, NC 27709-2194, USA
Acknowledgments v
Introduction vii
1. Planning to Make Data-Driven Decisions 1
Introduction 1
Defining College Readiness 2
Using Data to Solve Problems and Answer Questions: An Example 5 Using Logic Models as Planning and Evaluation Tools 10
Developing a Comprehensive Analysis Plan 15
2. Obtaining Data 23
Introduction 23
Collecting Student Data 24
Accessing State and District Data Systems 28
Accessing Postsecondary Data 36
Effective Methods for Collecting Data 39
Protecting the Privacy and Security of Student Data 46
3. Measuring and Managing Data 55
Introduction 55
Defining and Measuring Variables 56
Converting Concepts to Variables 57
Data Quality 62
Merging Data Files 67
Documenting the Process 76
4. Data Analysis 81
Introduction 81
Choosing Appropriate Analysis Techniques 82
Strategies for Selecting Comparison Groups 83
Choosing an Analytic Technique 86
5. Dissemination 95
Introduction 95
References 107
Additional Resources 111
Glossary 113
Contributors 121
Tables
1. Applying the scientific method in the classroom and beyond 5 2. Longitudinal dataset tracking students’ progress through middle school 29 3. Number of states adopting new Data Quality Campaign actions 32 4. States taking additional steps to develop statewide longitudinal data systems
(SLDSs) 33
5. Sample multiple-choice survey questions 41
6. Examples of the process of defining variables 59 7. Data merge results from two different student records 72
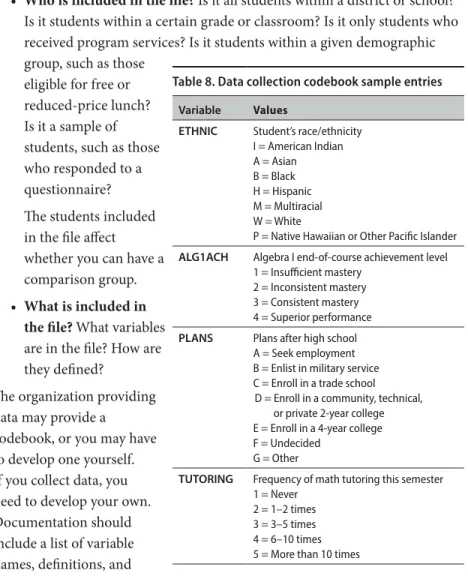
8. Data collection codebook sample entries 77
9. Sample data tracking table 78
10. Disseminating dual-enrollment information to students and parents 99 11. Disseminating dual-enrollment information to administrators 99 12. Disseminating dual-enrollment information to funders and policy makers 100 13. Disseminating dual-enrollment information to program staff 101 14. Use of information comparisons: hypothetical versus actual 101
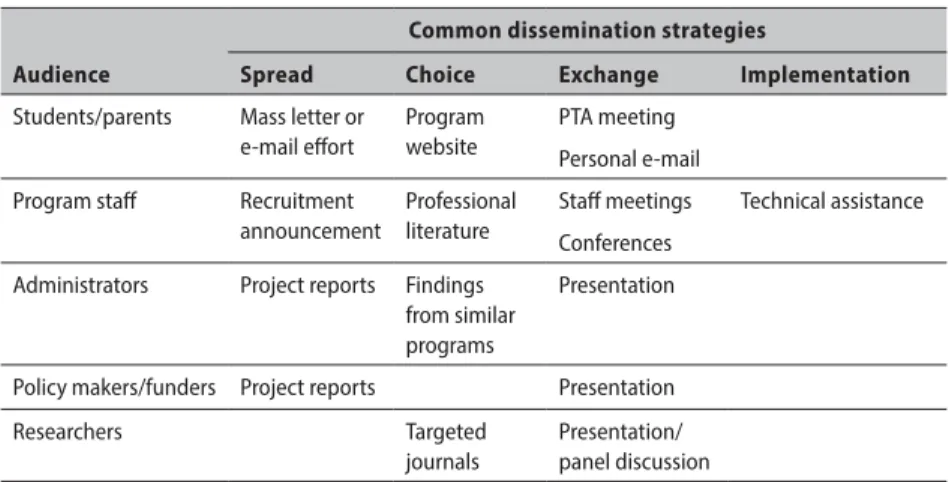
15. Common dissemination strategies 102
Figures
1. Logic model for selecting a postsecondary school 12 2. Logic model for developing a new high school math class 13
3. Sample mobile device survey question 42
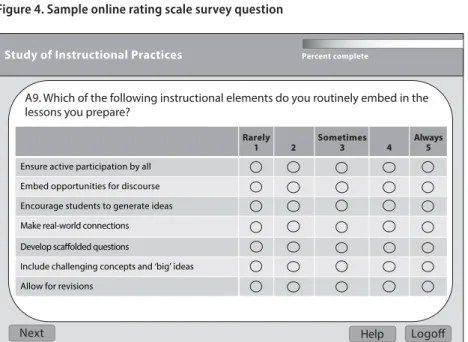
4. Sample online rating scale survey question 43
Acknowledgments
Introduction
How effective is your educational program? Is your program working the way you intended? Are students responding to services in the way you hoped? Can you attribute student outcomes to your program?
Educators ask these kinds of questions when considering whether to continue, expand, or modify services. You may want to expand services that work well and adjust those that need improvement. If an innovative strategy benefits students, you might want to share that information with other educational service providers so that they can build on that strategy. You may be required to provide a final report to the organization that funds your program to demonstrate the program’s success.
Data can be collected and analyzed to address these questions. Data-driven decision making means using a logical, evidence-based approach to actions.
Different kinds of educators regularly make data-driven decisions as part of their job. Project directors collect and review data to report on the status of the project and initiate changes if the data reveal that the project is missing its targets. Principals engage their teachers in collecting and reviewing data to inform the school’s continuous improvement plan. District superintendents review school data to make decisions about allocating new services. Classroom teachers use data as part of their instructional practices. They may not credit themselves with using data to monitor student learning, but they gauge every question, probe, and student response to understand students’ levels of understanding.
Planning to Make Data-Driven Decisions
Introduction
Whether you serve in a school, district, or state leadership role, at some point you will be asked to address a prevalent challenge (e.g., lower graduation rates), justify a recent program decision (e.g., implementing dual-enrollment courses), or examine student data (e.g., standardized test scores) to revise existing practices or recommend new approaches. If your program is supported by funding from foundations or grants from the federal government, you may pursue similar questions. Regardless of your role, you have to make decisions that could be more effective with analysis of appropriate data. You need to develop an effective plan, often called a study, for collecting and analyzing data. If your study has any policy implications—and most do—then you want to clearly lay out a plan that confirms you know where you are going, what you are studying, and how the results can be used. Putting time into planning your study defines its boundaries, keeps you focused, and supports implementation as your study moves forward and decisions are made.
This chapter describes key steps in planning any study that involves the use of data—identifying the problem, developing study tools, and defining study terms and the related metrics for measuring the terms. For illustration and consistency, the examples focus on supporting college and career readiness program improvement; however, you are encouraged to investigate the application of this process to studies of other issues that include data collection or analysis.
and traditional elements that, when adhered to, contribute to the successful implementation of the study and, ultimately, its credibility.
Logic models and analysis plans are commonly used when designing a study. Logic models help developers organize their thoughts and maintain focus during the planning process. An analysis plan is a roadmap for how you are going to answer your questions. You can revisit and revise these tools during the implementation of the study to support decision making.
Studies require clear definitions, and you should define key terms in the early planning stages. For example, problems in studying college and career readiness programs sometimes relate to the definitions of qualitative attributes such as “college readiness,” “career readiness,” and being “on track.” The metrics used to measure these attributes vary greatly across studies and can lead to results that cannot be compared across projects and programs. When planning your study, defining your terms and the metrics used for quantification are two of the most important elements.
We invite you to explore the ideas in this chapter and use them to your advantage, keeping in mind that studies do not have to be elaborate to be credible. They only need to be planned and executed well. Although this publication is designed for all educators and educational researchers, we primarily focus our examples on college and career readiness. We begin with an explanation of college readiness and then cover other topics that will be expanded in the rest of the book.
Defining College Readiness
College-ready high school students have the knowledge, skills, and
Dimensions of College Readiness
There is often a disconnect between what state standards say high school students should learn and what postsecondary institutions expect of high school graduates (Achieve, Inc., 2009). When trying to define or measure college readiness, you want to know the specific content knowledge that should be taught in high school courses for students to enroll and succeed in postsecondary education without the need for remedial classes. To truly be college ready, high school students need to have cognitive strategies such as problem solving, analysis, interpretation, and reasoning; academic knowledge and skills associated with college success, such as writing, synthesis, numeric skills, and research; self-management skills including study skills, time management, and persistence; and knowledge about postsecondary education, such as how to apply to college, how to manage financial aid issues, and how to adjust to college life.
Cognitive Strategies
Conley (2008) identifies cognitive strategies related to college success, including the ability to formulate, investigate, and propose solutions to nonroutine problems; understand and analyze conflicting explanations of phenomena or events; evaluate the credibility and utility of source material and appropriately integrate those sources into a paper or project; think analytically and logically, comparing and contrasting differing philosophies, methods, and positions to understand an issue or concept; and exercise precision and accuracy in applying methods and developing products.
These strategies are at the heart of how postsecondary educators think about their subject areas and what they expect from their students. Students without the capability to think in these ways will struggle as they enter college.
Academic Knowledge and Skills
Self-Management Skills
College students need to keep track of huge amounts of information and organize themselves to meet competing deadlines and priorities. They must plan their time carefully to complete these tasks. They must be able to study independently and in informal and formal study groups. They must know when to seek help from faculty and academic support services and when to cut their losses by dropping a course. These tasks require self-management, a skill that individuals must develop over time, with considerable practice and trial and error.
Knowledge about Postsecondary Education
Comparing colleges, selecting and applying to a postsecondary school, securing financial aid, and adjusting to college life require a tremendous amount of specialized knowledge, including the ability to match personal interests with college majors and programs; understand federal and individual college financial aid programs and how and when to complete the necessary forms; register for, prepare for, and take required admissions exams; apply to college on time and submit all necessary information; and understand how the culture of college is different from that of high school.
Summary
Programs that aid college access often provide a comprehensive set of services that help students prepare to enroll and succeed in postsecondary education. Many of these services are aimed at creating a college-going culture that results in more students who go to college, persist, and graduate. Including services that promote the cognitive strategies and self-management skills can enhance the preparation of students for the rigors of college.
As a potential predictor of college success, remedial college course taking can be used as a proxy for gauging college readiness. The drawback is that you need postsecondary data on your high school graduates, and you may not have the funding to follow them after high school. The advantage is that you may be able to determine which services that you provided to students are associated with lower rates of remedial coursework in college.
students for college. This information is directly related to the logic model you developed at the outset of your program.
Using Data to Solve Problems and Answer Questions: An Example
Educators have a well-established foundation for solving problems and answering questions. The problems you encounter and the subsequent studies you plan follow much of the process you learned in school as the scientific method. You recognize that you have a problem to solve, gather background information, hypothesize solutions, design a plan to test the solutions, gather and analyze data, draw conclusions, and make recommendations. Regardless of the labels for the various steps you use, you are employing some variation— whether classic or updated—of the scientific method. In general, the researcher devises a plan (design an experiment) that is objective, minimizes bias, manipulates only one variable, and is replicable.
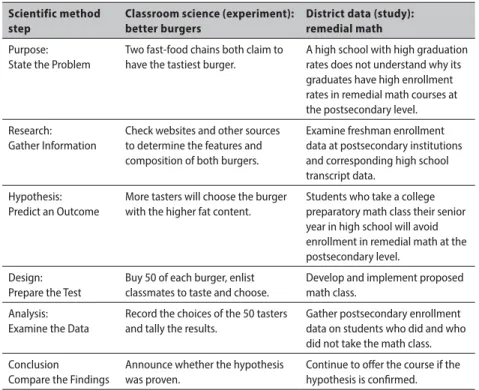
Table 1 shows an example of the scientific method applied to a school science project and an education challenge.
Table 1. Applying the scientific method in the classroom and beyond Scientific method
step Classroom science (experiment): better burgers District data (study):remedial math Purpose:
State the Problem
Two fast-food chains both claim to have the tastiest burger.
A high school with high graduation rates does not understand why its graduates have high enrollment rates in remedial math courses at the postsecondary level. Research:
Gather Information
Check websites and other sources to determine the features and composition of both burgers.
Examine freshman enrollment data at postsecondary institutions and corresponding high school transcript data.
Hypothesis: Predict an Outcome
More tasters will choose the burger with the higher fat content.
Students who take a college preparatory math class their senior year in high school will avoid enrollment in remedial math at the postsecondary level.
Design: Prepare the Test
Buy 50 of each burger, enlist classmates to taste and choose.
Develop and implement proposed math class.
Analysis: Examine the Data
Record the choices of the 50 tasters and tally the results.
Gather postsecondary enrollment data on students who did and who did not take the math class. Conclusion
Compare the Findings
Announce whether the hypothesis was proven.
The steps presented in Table 1 are simplified versions of what really happens and they provide a starting point for exploring how to plan a study. Researchers admit that most models—whether the scientific method, the engineering design process, or some other planning procedure—are guides more than rules and can be adapted or adjusted at most points from start to finish. For ease of discussion here, however, the steps are examined in a logical sequence.
Purpose/State the Problem
Problems, dilemmas, or questions are the genesis for most projects, programs, and studies. Most surface through observation and help define the purpose of the study. Problems may be relatively minor in scope (which laundry detergent best cleans grass stains) or quite important in impact (can a new drug diminish Parkinson’s symptoms). You have to ask yourself how you could test various laundry detergents on grass stains or how a drug company could test its new Parkinson’s treatment. Good questions are not always easy to formulate because they need to be framed in a way that you can test them.
Better burgers. In the battle of the burgers, even young students realize that both claims that each burger is the “tastiest” cannot be true. For them, the problem becomes “which claim to believe” and how to make that decision about which burger to buy.
Remedial math. A high school diploma should indicate that a student has graduated with proficiency in core academic subjects and is college and career ready. However, a postsecondary math remediation problem persists, especially for minority and first-generation college students.
Research/Gather Information
Gathering background information helps you understand the nature of the problem. It is useful to know whether others have studied the problem, what conjectures others have made, and what evidence supports what theory.
Remedial math. School leaders may choose to gather historical data on remedial course enrollment in postsecondary institutions. They might focus on specific student subgroups and review demographic and socioeconomic data, looking for clues that link to school performance. If longitudinal state data on postsecondary remedial math enrollment and students’ high school transcripts are available, they might look for course-taking patterns that provide insights.
Hypothesis/Predict an Outcome
Once you identify a problem and review available research, you can formulate an idea—conjecture or hypothesis—to test. You should structure the idea as a statement to be proved or disproved and base it on ideas formulated while building a knowledge base from the research.
Better burger. Suppose that students find out that one burger has a higher fat content than the other, and, at the same time, they discover that fat is pretty tasty. They might develop this hypothesis: Participants in the study will pick the burger with the higher fat content more often. In this hypothesis, the students are suggesting a correlation between the fat content and taste based on their understanding of the research conducted.
Remedial math. School leaders are concerned about the math abilities of their graduates who are entering postsecondary institutions. Their data lead them to consider adding a new math course to the local high school curriculum and encouraging college-bound seniors with lower math scores who have not taken advanced methods courses to enroll in the new course. They plan to target seniors who do not plan to take a fourth year of math. Their hypothesis might be: Low-performing math students who take a college-preparatory math class their senior year in high school are more likely to avoid remedial math classes in college than those who do not. In this hypothesis, school leaders are proposing an alternate math option for students not taking advanced courses such as calculus or statistics.
Design/Prepare the Test
the variables are, and how you plan to administer the treatment. At this point, you need to understand words such as treatment, control, variables, random, bias, and replication, all of which are in this book’s glossary.
The goal is to design a way to test your hypothesis such that you avoid skewing your results to favor one outcome (bias) and ensure others can duplicate your procedure. You could introduce bias into the better burger test by using freshly prepared, warm burgers from vendor A and stale, cold burgers from vendor B. You can control for other variables like seasoning and condiments to make sure that the burger meat is the only difference.
Not all studies require the have/have not configuration of treatment and control. In some cases, comparison is achieved in other ways. For the math class, you are not randomly selecting the students for the class (the treatment), but you could compare their results to eligible students who did not enroll in the course. This is still not a true control group as motivation cannot be accounted for, but it can give you satisfactory data for comparison. (Chapter 4 presents information about strategies for developing comparison groups.)
There are additional important topics that are part of the design decisions for a study. These include how many participants (or hamburgers) and how to control for only one variable. The examples below give two illustrations of the study design process.
Better burger. The burger battle has all of the elements required of a good design, but the elements are addressed with modification. Students might describe their design as follows:
1. Get 50 burgers from store A and 50 from store B. Label each one A or B (the variables).
2. Have them prepared identically with the same condiments (control).
3. Enlist 50 volunteer tasters (not a random selection). 4. Give each taster one A and one B (burgers are randomly
assigned) and a score card.
5. Ask tasters to record their choice for tastiest burger (no definition of tasty provided).
half the tasters eat A and half eat B because it ensures that everyone tries both.
Remedial math. The example appears simple at first. 1. Design the new math course.
2. Encourage eligible seniors to take the course (not a random selection).
3. Obtain college course enrollment data on students who took the course (A) and those who did not take the course (B). 4. Determine rates of remedial math enrollment for groups
A and B.
This design illustrates one major flaw, and it is one that arises repeatedly when trying to design an experiment with students. Groups A and B are not similar for several reasons. Students in group A may be more motivated, students in group B may have had scheduling conflicts that excluded them from taking the class, and students in each group may have had varying degrees of success in previous math classes. In cases like this, study planners do their best to minimize bias, include an acceptable number of subjects, and design a treatment that is measurable. An alternative is to measure other variables that may influence postsecondary remedial math enrollment and can be controlled in the analysis.
Analysis/Examine the Data
Once the data are collected, you should be able to determine what the results indicate. The type of analysis you choose can be as simple as tallying results, as in voting, or as sophisticated as computer statistical programs allow.
Better burger. In the burger battle, the data are simple and
Conclusion/Compare the Findings
Conclusions are tricky in that study managers tend to want to generalize beyond the scope of the study. Students may think that they have proven that
all burgers with high fat content taste better when they have just compared
two burger recipes. The remedial math researchers may want to recommend a senior math class to all students based on their findings. However, these researchers do not know whether all students would benefit from this program. In both cases, the researchers need to list the limitations to their study, its design, and the findings.
Better burger. If more students chose the burger with the higher fat content, then the hypothesis is correct. Students will most likely conclude that fat content is a contributor to taste in a burger.
Remedial math. The caution in this study as presented is that several external variables are unaccounted for in the design—student grades, student motivation, former teachers, home influences, outside tutoring, and more. If you find that students who took the extra math class their senior year did avoid remedial postsecondary math courses at a higher rate than students who did not, you can claim a possible link but not an absolute one.
Modifications for Education
The general ideas in these examples lay the foundation for the more specific education applications discussed in the rest of this chapter. You will learn how to plan a study, develop a logic model, and encounter a specific problem (college and career readiness, the default example used throughout).
Using Logic Models as Planning and Evaluation Tools
A program logic model is a picture of how your program works—the theory and assumptions underlying the program…. This model provides a road map of your program, highlighting how it is expected to work, what activities need to come before others, and how desired outcomes are achieved.
Logic models are useful in the planning stages of any new project because they require you to think through your assumptions, activities, and resources to indicate how these elements can lead to the desired intended outcomes. Without first exploring and explaining these logical linkages, your plans have a reduced chance at success and you have little opportunity to measure the cause and effect relationship between activities and outcomes (Schmitz & Parsons, 1999; Kellogg Foundation, 2004; Taylor-Powell & Henert, 2008).
Purpose
Logic models require that you thoroughly think through a proposed innovation, aligning resources with activities and activities with outcomes. Used purposively, logic models can prevent good intentions from leading to poorly conceived programs. Not only can they help ensure inclusion of the needed resources and appropriate activities, they can help you confirm with assurance the exclusion of unnecessary supports and actions.
Structure
Traditionally, logic models consist of five segments: inputs, activities, outputs, outcomes, and impact. Variations can include additional segments used by developers to suit specific needs.
Inputs are the resources available (or needed) to support the initiation of the plan. They directly support the activities, those actions and interventions at the heart of the plan that can (hopefully) produce the desired results. Together, the inputs and activities represent your key responsibilities. Inputs can be thought of as the “how” and the “what” of the plan, and the outputs, outcomes, and impact as the “why” of the plan—the results that you expect.
Outcomes are changes that can be expected over time because of increasing influence of the outputs. Outcomes represent the results of continuous improvement and eventually lead to the intended impact—the underlying “why” of the plan.
Visually, logic models are read from left to right, with each segment logically connecting to its predecessor through a series of if–then statements. For example, a list of needed inputs (resources) should allow you to say, if I gather these resources, then I can conduct these activities. And, if I conduct these activities, then I will achieve these outputs (results), and so on.
In exploring logic models in their simplest forms, one could argue that people plan vacations, buy cars, and make a number of major and minor decisions using logic models—even if the steps are never written down. For example, consider the thought process involved in picking a postsecondary institution. The resulting logic model might look something like Figure 1, if only in the mind of an anxious parent.
Inputs Activities
• Create a list of schools • Make site
visits • Review applications • Student records • Budget • Research Outputs • Acceptance notices • Decision • Enrollment Outcomes • Education • Experience • Career decisions Impact • Student prepared for career choices and options
Figure 1. Logic model for selecting a postsecondary school
In most cases, students meet with a school official, usually a guidance counselor, to verify that their records are ready and available to be included in college application packets. With their parents and counselor, they research their school options within a budget set by their parents. From these inputs, the activities emerge—developing a list of potential schools, planning site visits, and submitting applications. Assuming success, the expected outputs—immediate results—include receiving acceptance letters, making a final decision, and enrolling. In time, the outcomes and impact should occur.
The logic model becomes the visual tool for conveying the idea and showing its logical progression. Consider a simple logic model (Figure 2) for the desired outcomes of a new math program at a high school hoping to improve postsecondary enrollment for its graduates by reducing the need for remedial math. The proposers explain that with the inputs shown, they can provide the activities listed, such that the students in the program will experience the outputs, outcomes, and impact suggested in the model.
Inputs Activities Outputs Outcomes Impact
• Develop course • Recruit
students • District
support • Staff • Funds • Materials • Students
• Students: – enroll – actively
participate – demonstrate
proficiency
• High school graduation • College entry • No remediation
• Postsecondary persistence • Postsecondary
graduation or certification • Entry into
workforce
Figure 2. Logic model for developing a new high school math class
There is no guarantee that every if leads to its intended then; but, in this example, the authors’ thought process is clear. They suggest that if the proposed math course has district support, available staff, funding, and materials, then the school staff can proceed with developing the course and recruiting eligible students. If the activities are communicated effectively, then the students will actively participate in the program and complete and submit college applications. If these outputs continue to foster the students’ development, then they will graduate from high school, be accepted into college, and avoid remedial courses. If this happens, then they will persist at the postsecondary level, graduate with a diploma or certification, and be positioned to enter the workforce prepared to succeed.
Types and Uses
assess. This model is one that is particularly useful for new programs because it can measure the short-term results in the early years of a program and begin to measure the longer-term outcomes in the later years. For example, districts that initiate new programs at the middle school level can measure 7- to 10-year results for their students as they enter postsecondary education. It can also be revisited throughout the program as a dynamic tool and can be the foundation from which theory and activity models (discussed below) are developed.
Based on the work of the Kellogg Foundation (2004), other logic models include the theory approach and the activities approach. Theory models are most appropriate in designing studies where you are trying to articulate underlying problems and assumptions about solutions. The model’s structure may include problems (issue being addressed), assumptions (solution
strategies), inputs (resources available), activities (based on solution strategies), and outcomes (expected results). Theory models are intended to facilitate program planning, persuade funding decisions, and demonstrate that you have researched not only the problem, but also the current literature and best practices directed at similar problems. They often address an overarching local problem (low graduation rates), provide assumptions about the target population (students), reference what is known about programs that work, and propose evidence-based activities for the population.
The activities approach focuses on implementation and may contain several activities segments, with implied links between activities as they grow across the life of a program. This type of model is helpful for managing and monitoring programs. If activities in one phase do not build upon the activities in a previous phase as planned, you can investigate the initial implementation and make adjustments accordingly. By thinking through how activities can influence each other, you can design activities to occur in phases, rather than all at once, and take advantage of these influences.
For example, in expanding on “high school graduation” as an outcome, you could say “increased high school graduation” and even set a target percentage by which you expect it to increase. You can also consider whether your goal is for all students or whether you want to focus on certain kinds of students, as in “high school graduation rates of high-needs students will increase by 5 percent.”
Summary
Logic models are planning tools that should not be forgotten after you start your study, nor should they be considered static. It is appropriate to revise logic models throughout the life of a project, just as it is appropriate to have several types of models with different attributes for the same project—one for planning, one for evaluating, and one for managing. Logic models can guide all three of these important project activities. Examining the notion of college and career readiness as a persistent problem can be addressed by using a logic model as the foundation for developing a comprehensive analysis plan.
Developing a Comprehensive Analysis Plan
With a firm grasp of the role of logic models in designing a study, you are ready to create an analysis plan for your study. For example, if you decide to study the effectiveness of a new program and plan for its continuous improvement, your study can also be called a program evaluation—“an individual systematic study conducted . . . to assess how well a program is working” (Small, 2012). Because one goal of program evaluation is to focus on program improvement (i.e., studying activities and assessing value), it is an effective tool for program-related decision making.
A good initial step in planning a study involves developing a comprehensive analysis plan that includes the kind of data you plan to use, the information the proposed analysis will provide, and how this information can be used to make program improvements. You should consider how you will conduct the study as well. This section expands on the earlier discussion about the scientific method and experimental design, with explicit emphasis on educational applications.
UP is administered by the US Department of Education to provide funds to districts and states to improve postsecondary opportunities for high school graduates. Districts use the funds to develop academic support programs for middle and high school students. Typical GEAR UP services are often related to college and career readiness: tutoring, mentoring, coaching, designated classes, counseling, parent sessions, college visits, summer “bridge” programs, and financial aid guidance. Examining how and why a district might design a GEAR UP service provides a meaningful context for the following discussion.
Descriptions, Analyses, and Evaluations
Identifying and articulating specific concerns, questions, or interests is the first step in developing a comprehensive analysis plan. Your logic model presents the desired goals for the program and the processes by which the program should help students. Formulating questions helps you decide what specific things to examine. You may want to describe your program, analyze its components, or evaluate it.
Describing a program means reporting about what is happening, and descriptive reports provide a foundation for other types of questions. Descriptive questions could include:
• How many of your students used each service? How many students of different racial or ethnic groups used the services?
• Which students in your program were on track for graduation at the end of ninth grade?
• How many parents participated in financial aid counseling sessions?
Analysis questions link causes to results. Your logic model states some relationships to test in the analysis phase, with questions such as:
• Which services or combinations of services (e.g., tutoring, mentoring, coaching, counseling) are associated with increased high school persistence and graduation? Does this relationship persist for different racial or ethnic groups?
• Are summer bridge programs associated with students being on track for graduation at the end of ninth grade?
Evaluations make a judgment and come to a conclusion about the value or usefulness of something. Ultimately, evaluation questions ask if your program is succeeding. In this example, are students better off for having participated in your program? Evaluations build on analyses by trying to isolate the influence of a particular component on the outcome and determining whether that component is associated with the outcome of interest. You may find an association between the summer bridge program and being on track at the end of ninth grade, but is the relationship strong enough to say that students benefitted from the summer bridge program? Evaluation questions address that. The following are examples of evaluation questions:
• Is this set of services effective in helping students graduate from high school? Is it equally effective for males and females?
• Are students who took the summer bridge program more likely to be on track for graduation at the end of ninth grade than students who did not? • Are students whose parents participated in financial aid counseling
sessions more likely to have received financial aid than those who did not?
Evaluations can be formative or summative depending on when they occur. Formative evaluations take place during the course of the program and focus on the implementation process. Formative evaluations may provide information leading to immediate corrections or revisions to the services currently offered. Consider implementation of a new online math tutoring program for students taking Algebra I. Formative evaluation questions might include: “Are students able to navigate through the program online? Do students understand the content as it is being presented online?” If answers to these questions are negative, adjustments can be made to the online tutoring program.
and algebra classes are complete. However, lessons learned may benefit future cohorts or other programs.
Both formative and summative strategies can yield information that leads to improved services. Which strategy to use is influenced by timing and what you want to know. A formative evaluation requires sufficient time to implement the service, gain information, evaluate it, and use those results to enhance the service. A summative evaluation occurs after service delivery is complete but requires access to data about events that occurred. If data about services and outcomes were not collected or maintained properly, you cannot conduct a summative evaluation.
Both formative and summative evaluation questions are based on analytic questions, which in turn build upon descriptive questions. Each type of question can be used to inform decisions about your program. If answers to your descriptive questions show that some services are undersubscribed, you could examine why students did not participate and what changes you could make to increase participation. If your analyses show that a given service is weakly correlated with high school graduation, you might find ways to improve the service or drop it and reallocate resources to services with a stronger relationship to high school graduation. If your evaluation finds that students in the program have, for example, better math scores than those who did not participate, you can use that information to expand or promote the program.
Whatever type of questions you choose to address, your analysis plan should describe the measures you will use to answer them. For example, how would you define and measure being “on track”? How would you define and measure “taking and completing college preparatory coursework”? In the latter question, would you focus on all academic subjects including foreign language? Would you limit it to math and science? You should clearly specify the questions to be answered and describe the type of information you need to answer them.
Developing a Hypothesis
likely to apply to and attend college? Your hypothesis states your anticipated outcome and is structured in a way that will help you answer your original question. It is a prediction that can be tested and supported or rejected with data. Recall the if–then examples from the logic model discussion. For example, “If [this is done], then [this] will happen.”
• If students attend tutoring sessions in math 1 hour per week, then they will place out of remedial math courses in college.
• If we implement a graduation coach program, then students will graduate at a higher rate than in the past.
• If we compare student survey responses to college enrollment data, then we will find that students followed through with their postsecondary enrollment plans.
Collecting Data
You must think through and describe the data you need to answer your questions, where the data reside, and how you can obtain the data (see Chapter 2). You also need to determine what you need to collect directly and what you need to acquire from outside sources. Some data providers require users take steps to get permission to use the data, and you can contact them to ensure that you can access the data and that you understand the permission protocols. Permission includes investigating the need for approval from an institutional review board (IRB) and informed consent. You need to take care to collect enough data and utilize the full potential of the data systems that you access.
Planning Your Analysis
Your project may offer a range of services to students, and an analysis plan should describe the treatment that the cohort of interest experienced. Your proposed question is designed to study the outcomes of your services and activities (or a select subset of services). In your analysis, you should describe the specific treatment you are studying and the characteristics of the cohort that received or is receiving the service. Some example questions to consider include:
However, you may choose to elaborate on your questions by selecting a comparison group that did not receive the same services as your program cohort. If your hypothesis is stated as a comparison, you need to find a comparison group. These could be students from a previous year or students in schools that are similar to yours, except that they do not participate in your program. You can access student-level information from your statewide longitudinal data system (SLDS) to find a comparison group by requesting permission from the data provider. For example, if your hypothesis is “Students attending one hour of tutoring per week will place out of remediation classes in college at a higher rate than those who did not,” you need to compare rates of remedial classes for students who attended tutoring with rates of students who are similar, except that they did not attend tutoring.
Once you have decided whether you need a comparison group, you need to describe how you plan to conduct your study. You should explain your design in enough detail so that it can be duplicated. Thus, you should include answers to the following questions:
• How many student records will you access?
• What kind of data do you need to answer your question? • Can you link your student academic data to service data? • Why are these data key to your study?
• What procedures do you use to create files for analysis? • What methods will you use to analyze data?
• Are you using retrospective data, current data, or data you will collect in the future?
Making Program Improvements
Managing the Study
Finally, conducting the study requires adequate resources in terms of time, funds, and personnel. In looking at your plan, consider the following
questions: How much time will it take to collect or acquire the data you need? How much time will it take to analyze the data? Do you have staff who can manage and analyze data or do you need to hire a consultant for that work? How much will it cost to collect or acquire needed data? How much will it cost to analyze data and report findings?
The answers to these questions may require you to revise your analysis plan. If you cannot do everything you would like to do, limit the study so that you can still get useful actionable information. If, for example, you do not have enough resources to follow your students past high school graduation, you may decide to focus on high school experiences and outcomes for now and do the postsecondary analysis later if funds become available. Similarly, perhaps you want to collect data from multiple sources (administrative records, surveys) but do not currently have the necessary resources. Here, you could identify and focus on which source of data is most relevant to your key research question.
Obtaining Data
Introduction
Now that you have identified the question you would like to address and have developed a plan to answer it, you can think about the data you need. You may already have the data. If you are in a classroom—elementary, secondary, or postsecondary—you probably have performance data about all of your students. But, addressing some questions requires data beyond that found in a single classroom. You might need data about your students before they entered the program or after they completed it. You might need data about similar students who did not participate in the program. You might need detailed information about the services each student received, or you might want to know students’ perceptions of the services.
Student-level data include information about each student in your analysis. These data permit more sophisticated analyses and allow you to account for different factors that may influence student outcomes. For example, with student-level data, you could examine whether patterns are the same for different demographic subgroups of students or whether students who received services differ from those who did not. Student-level data can be aggregated to the classroom, school, district, or state level. Aggregated data can provide information about the status of students in schools, but the richest analyses are derived from student-level data.
institutions or other organizations such as the National Student Clearinghouse. Perception data target what various stakeholders (students, parents, and teachers) think of the school environment and the services provided. You might collect these data in a survey, focus group, or interview. School process data focus on what schools and teachers do to get the desired results. School processes could include instructional strategies and classroom practices. Similarly, you might collect this information through surveys, interviews, or classroom observations.
Historically, some aspects of these data have resided at the school and district, but student information management systems and longitudinal databases are putting more data into a repository that protects the privacy and security of the data. You may need permission to access this information. Identifying, locating, and obtaining student data become more challenging as data files become larger and more robust. If you obtain student data, you must take care to protect students’ confidentiality. Such safeguards are discussed in the Identifying Data and Personally Identifiable Information sections of this chapter.
This chapter provides guidance on deciding what measures you need to collect, finding and accessing the data you need, and developing tools to gather data that can inform your study.
Collecting Student Data
Trying to get information about events that have occurred previously can be extremely difficult and unreliable. Delaying data collection until the end of your program makes it hard, if not impossible, to get complete, accurate records of your activities and student outcomes. Having a process for routinely collecting data about all of your students gives you flexibility to conduct multiple studies as questions arise. As you solicit applications and provide services, you can collect identifying data, application data, and procedural data for the duration of your program. Likewise, during the program you can collect student participation, attitude, and outcome data. These processes can help you build a dataset that contains demographic, performance, perception, and school process information.
Identifying Data
sources, such as data routinely collected by the state or the National Student Clearinghouse (n.d.). Being able to identify students can facilitate collecting additional data through surveys or interviews. Ideally, identifying data should include full legal name (with nickname variations if possible), state student identification number (or Social Security number [SSN] if that is what your state uses to track students), birth date, and permanent address. You also should collect the date of the application or entry into the program so you can group students accordingly and examine results based on how much exposure students have had to the program.
Although you may collect identifying data, note that when analyzing data, you need to protect the identities of your students (see Protecting the Privacy and Security of Student Data). You can protect the identities of your students by creating a randomized ID number for each student that should be the same for each school year, even if the student changes schools. Use this ID number to record service use, survey responses, and any other data collected. A separate protected file should contain this ID number as well as the student’s true identifying information. The file that connects the randomized ID number to the true identifying information should be kept separate from the analytic file. The person analyzing data should not be able to determine the identities of individuals in the dataset.
Application and Registration Data
Application and registration data are often good sources of demographic data. Whether students apply for a program or are automatically admitted based on program-defined criteria such as grades, you can put information that describes how the student joined the program into a data file. Application, registration, or program enrollment information includes measures of each student’s status on all of your eligibility requirements, whether these requirements are academic or demographic (e.g., your program might be targeted toward high-achieving students or first-time college students). Separately, you should document how students were admitted to the program. This might include reaching certain benchmarks, such as a grade point average (GPA) threshold, a teachers’ recommendation, or membership in a group, such as first-generation college students.
each student’s prior school experiences in the application or registration packet. For elementary school students, you could ask for information about their preschool experiences. If past academic performance is not counted in determinations of eligibility for the program, you may not need to collect detailed information about past performance on the application. However, simply knowing the identity of the prior school will make it much easier to get additional information from a district or state database if needed later.
Similarly, you might want to collect information about students’ families. For example, you might want to know the relationship of the student to his or her guardian (e.g., mother and father, single parent, stepparent, grandparent, foster parent). You might collect a combination of information about the guardian’s educational attainment, occupation, income, and other factors. Having insights about the student’s family life may explain differences in the kinds of support families can provide.
Save application data both for those who were admitted and for those who were not admitted to the program. You may want to compare the
characteristics of students served by the program to those who were not served to examine the program recruiting process. If you find that many applicants do not meet basic eligibility criteria, you could decide to modify the way you communicate the program requirements.
You may want to compare the students who were admitted to those who were not. All of the students who applied knew about the program and were interested and motivated enough to apply. Further, all applicants share certain qualities that may influence later academic success, such as motivation. The application data for students who were not accepted are potentially a rich source of information you can use to assess your admission policies. However, depending on the admission process and criteria, applicants who were not admitted may or may not comprise a valid comparison group for answering other research questions. Chapter 4 discusses comparison groups in more detail.
Service Data
activity. By recording the specific services and time spent participating, you can identify the relative influence of your services. For example, if you find that students who participated in a weekly math enrichment activity had higher grades in Algebra I than those who did not, you might conclude that the weekly math enrichment activity is effective. However, if you find no real difference in Algebra I grades between participants and nonparticipants in a summer math enrichment activity, you might conclude that you need to modify the summer activity or replace it with a weekly activity. By keeping track of which students participated in both of these services, you can gain insights into the relative effectiveness of each individual service.
You also want to collect information about how often each student participates. If you find, for example, that some students who enroll in a service miss several sessions, you would want to investigate why they were absent. Perhaps the time or location of the service is inconvenient, and students struggled to get there. Perhaps after attending a session, students decided the service was not relevant to their interests or needs. You could use that information to adjust the logistics, materials, or content of that service.
It is also important to collect attendance information to prevent incorrect conclusions because the amount of time a student spends in an activity can influence whether that activity is effective. Expanding on the example above, if the summer math enrichment activity met eight times and half of the students who signed up for it only attended once, then it may not be accurate to conclude that the summer math enrichment activity is not effective because Algebra I grades were not higher for the students who participated. You would expect that full participation would raise math scores, and if you know how often each student participated, your analyses could account for those differences. Having this participation data helps you make other decisions about services provided as well. In this example, why do half of the students only attend one time? You could interview these students to learn why they stopped attending the summer math enrichment activity. It could be due to schedule or transportation challenges, or perhaps they do not think the material is relevant to them. That information can help you improve your activity.
students are exempt from a required activity (e.g., taking Algebra I in ninth grade), why were they exempt?
Knowing the process by which students participate in various services can provide insights into your results. Suppose that students choose to participate in the weekly math enrichment activity. In that case, the most motivated and math-competent students might choose to participate, and their higher grades in Algebra I might reflect their motivation and ability independent of the enrichment activity. In contrast, perhaps teachers refer students to the weekly math enrichment activity if they think students might otherwise fail Algebra I. In that case, when you find no difference between test scores of participants and nonparticipants, you might conclude that the weekly math enrichment activity was effective because it helped these struggling students catch up to their peers. Ultimately, you need to compare the service-receivers to students most similar to them, and knowing the decision process helps you determine which students are comparable.
Summary
Consistently collecting and maintaining student-level data through
applications, registration documents, and program participation can provide information that is useful for ongoing program improvement. If you have sufficient identifying information for each of your students, you can link data from your program to data from district, state, or postsecondary sources. You can also collect data through surveys, interviews, focus groups, or observations. Routinely collecting such data increases the type of questions you can address.
Accessing State and District Data Systems
reduced-price lunch in a school without your program. Similarly, if you are studying a whole-school reform program, you need to compare your students to those in other schools.
To examine outcomes of students in other schools, you often need to obtain data from your state or district. To track student outcomes over time, you need longitudinal data that include multiple years. With longitudinal data, you can examine your students’ academic work before and after participating in a service or program. With consistently collected state-based or district-based data, you can compare your students to similar students in other schools who do not have the benefit of participation in your program.
This kind of information would help you address questions such as: • How do students in your program compare to similar students in different schools who do not participate in a comparable program? • How many students in your program are on track to graduate high school
at the end of their freshman and sophomore years compared to similar students in another school that does not have a comparable program? • Are achievement gaps smaller for students receiving your services than
for similar students who do not receive your services or comparable services?
Statewide Longitudinal Data Systems
Many states have created robust statewide longitudinal data systems (SLDSs). With longitudinal data, you can track an individual student’s academic progress and not only examine proficiency within a year but also academic growth over time. Table 2 provides an example of data from a longitudinal database that contains information about student performance on end-of-grade exams in middle school.
Table 2. Longitudinal dataset tracking students’ progress through middle school
Student 6th grade math score
6th grade reading
score 7th grade math score
7th grade reading
score 8th grade math score
8th grade reading score
Rosa 67 75 62 74 82 80
Derrick 74 72 70 68 66 64
The Data Quality Campaign (DQC), founded in 2005 as a national
advocacy group, monitors and reports on each state’s progress toward building systems to manage student data that can generate information useful for improving student achievement. One of the DQC’s first actions was to identify and describe what it referred to as the 10 essential elements of SLDSs and to support states in their efforts “to improve the collection, availability, and use of high quality education data” (DQC, 2006). The DQC provides information about each state’s progress in collecting high-quality longitudinal student data and policies for using such data. Information contained on the DQC’s website1
can help you understand your state’s status in these general areas.
The DQC provides a national platform for state directors and policy makers to talk, share, and learn from each other as they build their longitudinal data systems and implement the elements deemed to be essential for a robust SLDS. The essential elements describe features needed in a fully functional SLDS for it to provide specific longitudinal student-level information, such that it is possible for states to:
• follow students’ academic progress as they move from grade to grade; • determine the effectiveness of specific schools and programs;
• identify consistently high-performing schools so that educators and the public can learn from best practices;
• evaluate the effect of teacher preparation programs on student achievement; and/or
• focus school systems on preparing a higher percentage of students to succeed in rigorous high school courses, college, and challenging jobs (DQC, 2006).
As described, SLDSs include far more information than just test scores. With SLDSs, states create student identifiers that allow you to follow a student who changes schools and to link information from various data sources, such as school enrollment, course taking and completion, scores from multiple assessments, attendance, and dropout status. SLDSs also include students’ demographic data and may include information about their participation
in programs, such as special education or the free and reduced-price lunch program.
Your state’s department of education may have enhanced its data system through the SLDS Grant Program or through another initiative. The federal SLDS Grant Program has awarded competitive, cooperative agreement grants to states since 2005. These grants provide funds over a period of 3 to 5 years to foster the successful design, development, and implementation of longitudinal data systems. Through the six rounds of funding (2005, 2007, 2008, 2010, 2012, and 2015), 47 states, the District of Columbia, Puerto Rico, American Samoa, and the Virgin Islands have received at least one SLDS grant (US Department of Education, n.d.). You can review different states’ objectives in creating their SLDS online.2 Additionally, most states provide some policy and funding
support to develop data systems and to create publicly available reports about schools and students (DQC, 2013).
Student-Level Data Collected by States
Although all states have included certain key elements in their SLDSs, they differ in the kinds of data they collect, the way they link files from other sources, and the extent to which they permit stakeholders to analyze that data. Before requesting data from your state’s department of education, you should become familiar with your state’s data collection and reporting processes.
By 2011, most states had incorporated the essential elements into their data systems (Table 3). All states have a statewide identifier and maintain annual student-level enrollment, graduation, and dropout status. Additionally, all states maintain information on student participation in some kinds of school programs and have a state audit system to assess data quality and reliability. All but one state maintains information on students who are not tested under the state’s accountability system (DQC, 2011).
The America COMPETES Act of 2007 and the American Recovery and Reinvestment Act (ARRA) of 2009 led to the development of federal guidelines for SLDSs, which absorbed most of the recommendations put forth by DQC. Given that most states had made progress on these elements, DQC shifted its focus to recommending 10 actions that states should take to further this development (Table 4). These actions include linking K–12 data with early learning, postsecondary education, social services, and workforce data; developing governance structures to guide data collection, sharing, and use; and creating reports using longitudinal statistics to guide system-wide improvement efforts. Most states have developed data repositories, created reports using longitudinal data, and developed governance structures to guide data collection.
Table 3. Number of states adopting new Data Quality Campaign actions
DQC’s 10 essential elements Purpose Number of states*
A unique statewide student identifier Follow individual students 52 Student-level enrollment, demographic,
and program participation information
Study relationship between demographics, participation, and performance
52
The ability to match individual students’ test records from year to year to measure academic growth
Provide diagnostic information to
teachers and principals 52
Information on untested students Study patterns in student subgroups 51 A teacher identifier system with the ability
to match teachers to students
Study teacher preparation programs and teaching assignments, especially with regard to low-performing populations
44
Student-level transcript information, including information on courses completed and grades earned
Study relationship between course-taking patterns and college/work readiness
41
Student-level college readiness test scores Study the transition from high school to
postsecondary 50
Student-level graduation and dropout data Follow students who drop out of school 52 The ability to match student records
between the P–12 and postsecondary systems
Provide high schools with feedback on the success rates and course-taking patterns of graduates
49
A state data audit system assessing data quality, validity, and reliability
Monitor and ensure accuracy and
validity of data 52
Finding State-Specific Information
Once you have a sense of your state’s general policies for data collection and analysis, you can turn to your state’s department of education website. This website can serve as a tremendous resource for learning more specifically about the kind of student data the state maintains. Under the Every Student Succeeds Act, each state is required to produce annual report cards with information about student achievement. State department of education websites post this information, which can by searched by district and school. Each state produces annual report cards that provide information about student achievement. The school report cards and other annual reports describe how each state defines certain measures. For example, a measure of “days absent” may refer to excused absences, unexcused absences, or both.
You can also search your state’s department of education website for evaluation reports conducted or commissioned by your state. These reports Table 4. States taking additional steps to develop statewide longitudinal data systems (SLDSs)
DQC’s 10 State Actions
Number of states accomplishing the action by 2015 Link state K–12 data systems with early learning, postsecondary education,
workforce, social services, and other critical agencies 19 Create stable, sustained support for a robust SLDS 41 Develop governance structures to guide data collection, sharing, and use 42 Build state data repositories (e.g., data warehouses) that integrate student,
staff, financial, and facility data 46
Implement systems to provide all stakeholders with timely access to the
information while protecting student privacy 11 Create progress reports with individual student data that provide
information that educators, parents, and students can use to improve student performance
35
Create reports using longitudinal statistics to guide system-wide
improvement efforts 45
Develop a purposeful research agenda 41
Promote educator professional development and credentialing around the
access, analysis, and use of data 18
Promote strategies to raise awareness of available data and ensure that all
stakeholders can access, analyze, and use data appropriately 33
provide information about the kind of data the state policy makers are using to address certain kinds of questions. In addition to tracking the information about the data, you should note the names of any report authors, who may become helpful contacts for you.
To find evaluation reports, you can use search terms such as evaluation, research, data, or statistics. You can also search within specific divisions or programs of the department, such as accountability, academic reform, or dropout prevention. Because states develop their own approaches to organizing and presenting materials, you have to be creative as you search these websites.
Accessing Your SLDS
Once you have determined what data you need to facilitate project improvement, you will need to determine how to access the data. As noted above, the DQC website presents actions each state is taking to facilitate effective data use. States can facilitate data use by implementing the following practices: (1) a governance structure to clarify the procedures for sharing data, (2) data repositories that store and integrate data from multiple sources, (3) systems for providing stakeholders with access to information, and (4) practices to ensure educators can use the data properly. Not all states have taken these actions yet, so you have to plan accordingly. For example, if your state does not have procedures for sharing data, you need to spend more time developing a memorandum of understanding or a memorandum of agreement for data use. A memorandum of understanding is a general statement of understanding between two parties, but it is not a legally binding contract and is not appropriate if funds are to be exchanged. Here, both parties outline and agree to expectations and responsibilities. A memorandum of agreement is a legally binding agreement. If the state you work with does not have procedures in place, you could use the memorandum of agreement templates from states that do have them as a guide. If your state does not have a repository for linking data from multiple sources, you need to include someone on your team with sufficient computer programming skills to accomplish that.