Abstract: Background/Objectives: The purpose of this study is to develop Debate Dashboard to promote learners’ online debate activities and provide suggestions that could be adopted to improve the online debate dashboard. Methods/Statistical analysis: Debate dashboard was developed by computer scientists, and usability test and user experience evaluation were conducted to identify and usability problems and determine the participants’ satisfaction with the dashboard. The usability questionnaires were 9 items and 35 students and 6 instructors were participated. User experience evaluation was performed to determine how users perceived when experiencing the dashboard, the questionnaires were 26 items and 34 students and 6 instructors were participated. Findings: Based on the characteristics of the learning analysis, the debate dashboard was developed by applying the visualization guidelines such as comparability, implicity, and overview-detail. The usability test and user experience evaluation were conducted for students and instructors. The results of the usability test showed that the average score of ease of learning and ease of use was high. As a result of user experience evaluation, perspicuity and efficiency were found to be the highest among students and instructors. These findings show that Debate Dashboard seemed useful to both learners and instructors in identifying debate status. This study sought to support learners debate activities by visualizing debate status on Debate Dashboard by applying comparability, which is a unique characteristic of learning analysis, rather than programming or visualization techniques. The results of this study will help to develop a dashboard to support various learning situations in the future.Improvements/Applications: It is necessary to investigate the effect of Debate Dashboard on learner participation in debate activities and provide intervention by analyzing quality of the debate contents.
Keywords: Learning Analysis, Debate Dashboard, Visual Dashboard, Usability Test, User Experience
I.INTRODUCTION
Due to the development of computer technology and the Internet, online learning has been widely applied to learning environment [1]. One of the most widely used online learning is the online debate forum. Forums are text-based communication methods that can increase the quality of the learning experience and facilitate the development of argument formation capabilities, increased written
Revised Manuscript Received on January 03, 2019.
Mina Yoo, Research Professor, Research and Information Center for Innovative Engineering Education, Inha University, Incheon, Republic of Korea.
Sung-Hee Jin, Corresponding author, Assistant Professor, Division of Humanities and Liberal Arts, Hanbat National University, Daejeon, Republic of Korea.
Yujie Han, Department of Education, College of Education, Seoul National University, Seoul, Republic of Korea.
communication skills, greater complex problem solving abilities, and increased opportunities for reflective deliberation [2-5]. Among many different kinds of forum, especially, debate helps improve the ability of decision making, a thoughtful process of choosing among a variety of options for action or thinking. Debate is defined as the process of inquiry and support to find a rational basis for argument. Debate activities essentially require two types of competitors to participate in a bipolar clash of support for and against that proposition [6]. These debate activities help improve decision-making skills. The ability of decision making to make good, reasoned, and ethical decisions relies on the ability to think critically. Critical thinking enables one to break argumentation down to its component parts in order to evaluate its relative validity and strength [7]. Although online debate forum has its strengths, there are several potential weaknesses such as an overwhelming number of messages to read, increased chance of misunderstandings, and reduced students’ social awareness [8]. Also, online debate leaves users blind to a range of information that is commonly readily available in face-to-face interaction and this hampers the level of users' acceptance of these technologies [9]. In the case of online debate, users lose information of crucial elements that aid to make debate easier [10]; that is: 1) distribution of pros and cons, 2) participants (who is in pros and who is in cons), 3) the content of the debate.
A few previous studies suggested a tool to visualize and present debate activities to increase social awareness of students and to improve understanding of the debate situation. They have been focused on the analysis of the impact of the provision of conversational feedback and hidden information, by using visualization tools, on quality of debate, its outcome and interaction processes among users [11]. It is a kind of visual feedback that visual presentation of information about online debate. Visual feedback on learners’ online learning activities can improve presence and co-presence in online learning environment by helping learners clearly recognize their own and other learners’ debate activities [12]. Visual feedback can be provided on the visual dashboard. Visual feedback about online debate on the dashboard presents the debate process and results by analyzing and presenting participation, interaction, keywords, and message type, which are difficult to grasp by learners due to characteristics of learning environments in which online debate are performed [13].
Development and Usability Testing of Online
Debate Dashboard based on Learning Analytics
Approach
1
The tool for providing the visual feedback proposed in the previous research can be provided through the debate dashboard [14].
It is essential that the debate dashboard is developed based on the visual design guidelines with learning analysis approach. Learning analysis is the measurement, collection, analysis and reporting of data about learners and their contexts, for purposes of understanding and optimizing learning and the environments in which it occurs [15]. Previous studies have suggested that visualization guidelines for presenting visual feedback on dashboard based on learning analysis approach [13,14]. In the debate forum, it is necessary to present the opinions of the pros and cons easily in a debate situation [16]. Also, it is necessary to express the relationship between the pros and cons with different symbols or colors [17]. In order to provide at-a-glance visibility into the distribution status of the opinions (affirmative-opposed) of the entire participant, the analysis results of the debate forum should be presented on a single screen [16]. The visualization guidelines proposed in previous studies can be summarized as comparability, implicity, and overview-detail, respectively. Although the visualization guidelines have been proposed, previous studies that dashboard development were conducted based on researchers' intuition, computer science and big data analysis techniques without applying such visualization guidelines. In addition, several previous researches have attempted to develop debate dashboard and test usability, and they suggest that the usefulness of dashboard should be analyzed before verifying whether dashboard are effective as a learning intervention [18].
In this research, we developed an Online Debate Dashboard aimed at providing visual feedback of the debate status and its participants based on visualization guidelines, and evaluate whether it can be widely used by usability test and user experience evaluation.
II.MATERIALSANDMETHODS
2.1. Research Method and Procedures
As the purpose of this study is to develop the online debate dashboard, this study applied Richey & Klein [19]'s Design and Development Research (DDR) Methodology – Product Research (Type I). Design and development research is defined the systematic study of design, development and evaluation processes with the aim of establishing new products, tools and or enhanced models based on specific needs analysis [19]. The systematic collection of data regarding the design and development process is conducted in such a way that would allow others to replicate it. The research procedure implemented in this study is as shown in [Table 1]. Five computer scientists and two educational technology experts participated in the development of the dashboard, with 35 students and six instructors participating in the usability test and 34 students and six instructors participating in the user experience evaluation.
Table 1. Research Procedures
Stages Participants
Dashboard development 5 Computer scientists
Usability testing 35 Students 6 Instructors User experience evaluation 34 Students
6 Instructors
2.2. Dashboard Development
The visual dashboard has been coded and developed with Java by five computer programming experts which was derived from dashboard prototype research. The developing period of the dashboard was from January to April 2018 and correcting and supplementing of usage errors for two months after that. In design and development studies, researchers also act as designers and developers. However, there are precautions such that researchers should be involved with several study participants to act as research participants [20]. In this study, seven experts including researchers participated in the development of the dashboard to ensure the validity of the research on the products and tool research. To develop a dashboard to support the debate forum, developing online debate system that enables debate activities was required. Therefore, prior to the development of the dashboard, an online debate system was developed where learners' online debate activities were conducted and data could be collected.
2.3. Usability Test
To investigate the usability test of the dashboard, 35 graduate students and six instructors participated in this study. They were enrolled in an “Educational Technology” course at a university in South Korea. As a phase of design and development research, the formative evaluation phase was primarily intended to examine the usability of the interface and the effectiveness of the visual dashboard as it was conducted using a 5-point Likert scale. The instrument was composed of 9 items: 2 items for the ‘ease of learning,’ two items for the ‘ease of use,’ 3 items for the ‘usefulness,’ two items for the ‘Satisfaction’ of the dashboard. The average and standard deviation were calculated for the usability of learners.
2.4. User Experience Evaluation
for new products with large-sample results for other commonly used products. They set the measured scale means to exist values from a benchmark dataset, and the benchmark was included in the data analysis sheet that Schrepp et al. [23] provided and is thus automatically calculated together with the other statistics. This study intended to evaluate the relative quality of user experience by using the benchmark analysis. The user experience evaluation was conducted on 34 students and six instructors, and it consisted of 26 items for evaluating experiences from various perspectives that users feel using the dashboard.
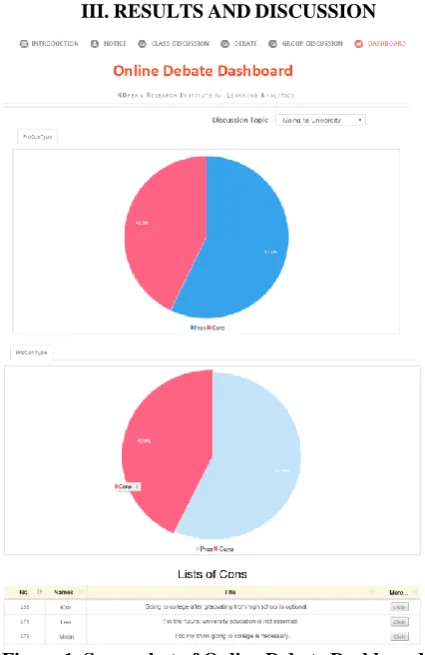
[image:3.595.319.532.161.229.2]III.RESULTSANDDISCUSSION
Figure 1. Screenshot of Online Debate Dashboard As the results of this study, online debate dashboard was developed that helps the learners to see at a glance how many people are in the pros and cons, who wrote the pros and cons, and what they wrote about it [Figure 1]. It shows that a list of the students who submitted the comments when clicking the part of the cons-type pie chart.
The result of the usability test, the responses of 35 students was analyzed. According to the [Table 2], the average of the ease of learning was 4.43 (SD=.75), the average of the ease of use was 4.29 (SD=.85), the average of the usefulness was 3.97 (SD=.85), and the average of satisfaction was 3.90 (SD=.99). The results showed that the dashboard is easy to learn and use, but students are not quite satisfied with the current version of the dashboard.
Table 2. The results of usability test - Students
Usability M SD
Ease of learning 4.43 .75
Ease of use 4.29 .85
Usefulness 3.97 .85
Satisfaction 3.90 .99
[image:3.595.56.269.199.527.2]The results of the usability test, the responses of 6 instructors were analyzed. According to the [Table 3], the average of the easy of learning was 5 (SD=0), the average of the ease of use was 5 (SD=0), the average of the usefulness was 4.69 (SD=.49), and the average of satisfaction was 4.69 (SD=.49). The results showed that six instructors feel that the debate dashboard is very easy to learn and use. Compared to the results of the students' usability test, the score of overall items were analyzed to be high.
Table 3. The results of usability test - Instructors
Usability M SD
Ease of learning 5.00 0
Ease of use 5.00 0
Usefulness 4.67 .49
Satisfaction 4.67 .49
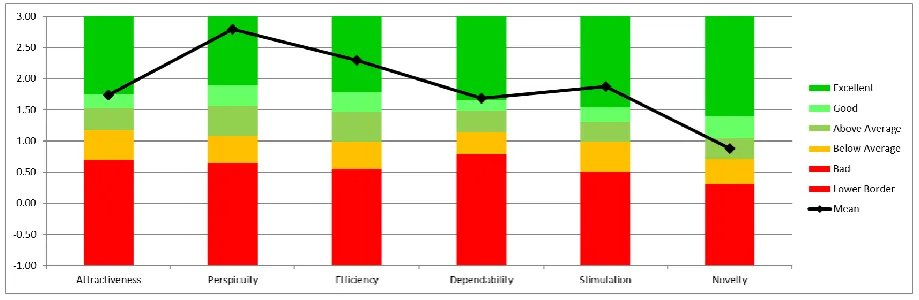
The result of the user experience evaluation of the students was reported as shown in [Figure 2]. The perspicuity and efficiency both were highest. The perspicuity scale measures how efficiently the user could get familiar with the dashboard. The efficiency scale measures the degree to which a user can solve a task without unnecessary effort. Relatively, the attractiveness and dependability were low. The attractiveness scale measures the user's overall impression of the dashboard. The dependability scale measures the degree to which a user can control an interaction.
[image:3.595.315.534.364.428.2]The result of the user experience evaluation of the instructors was reported as shown in [Figure 3]. The perspicuity was the highest. Followed by efficiency, stimulation, and dependability, attractiveness was good, and novelty was above average.
[image:3.595.65.547.613.808.2]Figure 3. The results of user experience evaluation - Instructors The usability test results of the dashboard were consistently
shown in the user experience evaluation results, and both the students and instructors most positively evaluated the easy and efficient method of using the dashboard. The students, on the other hand, rated the attractiveness and dependability relatively lower than those of other items. This result is considered that the pie graph may not be attractive because it is too familiar to the students, and students can interact with the dashboard in a limited way.
IV.CONCLUSION
This study developed a Debate Dashboard to support learners’ debate activities in online learning environments, and investigated the availability of the dashboard through usability test and user experience evaluation. This study is significant in that the dashboard was developed in accordance with visualization guidelines reflecting the characteristics of learning analytics. The visualization guidelines applied to dashboard development were comparability, implicity, and overview-detail. As a result of the usability test on the debate dashboard, the students and instructors recognized that the dashboard was easy to use and learn. This result is also confirmed in the user experience evaluation results. Learners can intuitively grasp the ratios of the pros and cons and identify who has agreed or disagreed on topics through the Debate Dashboard. Based on learning analysis, it is not just about analysis technology and fancy visualization techniques. The main purpose of learning analysis is to support learning and improve teaching by helping learners and instructors to easily recognize important information relating to debate activities. Therefore, this study sought to support learners debate activities by visualizing debate status by applying comparability, which is a unique characteristic of learning analysis, rather than programming or visualization techniques. This study analyzed only quantitative data such as the number of learners who participated in the debate forum and visualized the debate status. Further research is needed on the development of dashboards that can provide an intervention for learners and investigate the effect of the dashboard on learners’ participation in debate activities and quality of the contents through experimental research.
ACKNOWLEDGMENT
This work was supported by the Ministry of Education of
REFERENCES
1. Moore JL, Marra RM. A comparative analysis of online discussion
participation protocols. Journal of Research on Technology in Education. 2005 Feb;38(2):191-212.
2. Abrami PC, Bures EM. Computer‐supported collaborative learning and
distance education. American Journal of Distance Education. 1996 Jan;10(2):37-42.
3. Garrison DR, Anderson T, Archer W. Critical inquiry in a text-based environment: Computer conferencing in higher education. The Internet
and Higher Education.1999 Spring;2(2-3):87-105.DOI:
10.1016/S1096-7516(00)00016-6
4. Hawkes M. Variables of interest in exploring the reflective outcomes of
network-based communication. Journal of Research on Computing in Education. 2001 Mar;33(3):299-315.
5. Kanuka H. An exploration into facilitating higher levels of learning in a
text-based Internet learning environment using diverse instructional strategies. Journal of Computer-Mediated Communication [Internet]. 2005 April [cited 2018 August 31]; 10(3): JCMC1032. Available from: https://academic.oup.com/jcmc/article/10/3/JCMC1032/4614486 DOI: 10.1111/j.1083-6101.2005.tb00256.x
6. Angen MJ. Evaluating Interpretive Inquiry: Reviewing the validity
debate and opening the dialogue. Qualitative Health Research. 2000 May;10(3):378-95.
7. Freeley AJ., Steinberg DL. Argumentation and debate: Critical thinking
for reasoned decision making. 13th ed. Boston, MA:
Wadsworth/Cengage Learning; 2014.
8. Rovai AP. Facilitating online discussions effectively. The Internet and
Higher Education. 2007;10(1):77-88.
9. Smith M, Fiore A. Visualization components for persistent
conversations. Proceedings of the SIGCHI conference on Human factors in computing systems [Internet]. 2001 April [cited 2018 August 30] ;136-43. Available from: https://dl.acm.org/citation.cfm?id=365073 DOI: 10.1145/365024.365073
10. Iandoli L, Quinto I, De Liddo A, Buckingham Shum S. A debate
dashboard to enhance online knowledge sharing. VINE. 2012 Feb;42(1):67-93.
11. Lambropoulos N, Faulkner X, Culwin F. Supporting social awareness in
collaborative e‐learning. British Journal of Educational Technology. 2012 Mar;43(2):295-306.
12. Iandoli L, Quinto I, De Liddo A, Buckingham Shum S. Socially
augmented argumentation tools: Rationale, design and evaluation of a debate dashboard. International Journal of Human - Computer Studies. 2014 Mar;72(3):298-319.
13. Yoo M, Jin S. An analytic review of dashboard based on learning
analysis for online discussion activities. The Journal of Educational Information & Media. 2017 Sep; 23(3): 345-377.
14. Yoo M. Development of visualization principles for online discussion
activities based on learning analysis. Journal of Educational Technology. 2017 Dec;33(4):901-941
15. Siemens G, Long P. Penetrating the fog: Analytics in learning and education. EDUCAUSE review. 2011 Oct;46(5):30-40.
https://s3.amazonaws.com/academia.edu.documents/30907222/ksv2.p df?AWSAccessKeyId=AKIAIWOWYYGZ2Y53UL3A&Expires=1537 109173&Signature=qdkNobzP4Sn2MpjiEP5mPlUgtbw%3D&respons e-content-disposition=inline%3B%20filename%3DThe_Knowledge_S pace_Visualizer_A_tool_fo.pdf
17. Hara N, Bonk CJ, Angeli C. Content Analysis of Online Discussion in
an Applied Educational Psychology Course. Instructional Science. 2000 Mar;28(2):115-52.
18. Ha K, Jo IH, Lim S. Usability study of visual dashboard as learning analytics interventions. Proceedings of the Korean Society for Educational Technology Conference. 2013;(1):249-255.
19. Richey RC, Klein JD. Design and development research: Methods,
strategies, and issues. New York: Routledge Press; 2014. p.62.
20. McKenny S, Van Den Akker J. Computer-based support for curriculum
designers: A case of developmental research. Educational Technology Research and Development. 2005 June; 53(2):41-66.
21. Nielsen D, Norman J. The definition of user experience (UX) [Internet].
Nielsen Norman Group. [cited 2018 September 1]. Available from https://www.nngroup.com/articles/definition-user-experience/
22. Cleveland WS, McGill R. Graphical perception: Theory,
experimentation, and application to the development of graphical methods. 1984 March; 79(387):531-54.
23. Schrepp M, Hinderks A, Thomaschewski J. Applying the User
Experience Questionnaire (UEQ) in different evaluation scenarios. In: Marcus, A. (ed.), Design, User Experience, and Usability. Theories, Methods, and Tools for Designing the User Experience. Lecture Notes in Computer Science, Berlin: Springer International Publishing. 2014
June; 8517: 383-392. Available from: