International Journal of Innovative Technology and Exploring Engineering (IJITEE) ISSN: 2278-3075, Volume-8 Issue-9, July 2019
Abstract: An essential diagnostic tool in identifying heart rhythm irregularities, known as arrhythmias, is the ECG (Electrocardiogram). Accurate identification of arrhythmias in clinical environments is critical to patient well-being, as both acute and chronic heart conditions are typically reflected in these measurements. This is known to be a severe problem even for human experts, due to variability between individuals and inevitable noise. In this research, we have proposed an effective ECG arrhythmia classification method using a hybrid classifier with SVM (Support vector machine) and ANN (Artificial neural network) which recently shows outstanding performance in the field of pattern recognition. Every ECG beat was transformed into two-dimensional data as input data for the hybrid classifier. Optimization of the proposed hybrid classifier includes various optimization techniques such as GA (Genetic algorithm) and CS (Cuckoo search) algorithm with an optimal objective function. Also, we have compared our proposed hybrid classifier with well-known optimized ANN based ECG arrhythmia classification models. ECG recordings from the MIT-BIH arrhythmia database are used for the evaluation of the classifier. To precisely validate the hybrid classifier, cross-validation was performed at the evaluation, which involves every ECG recording as a test data with GA and with CS. The experimental results have successfully validated that the proposed hybrid classifier with the GA and CS has achieved excellent classification accuracy without any requirement of manual pre-processing of the ECG signals such as noise filtering, feature extraction, and feature reduction.
Keywords: ECG, SVM, ANN, GA, CS, Accuracy
I. INTRODUCTION
ECG (electrocardiogram) is considered as the heart’s electrical activity at rest. It is the graphical representation of the dissimilarity of the bio-potential and time[1]. The positioning of leads is at the correct body place for ECG recording, which can be on a monitor or in the graph paper. In the Human heart, there are four chambers such asright Atrium, left Atrium, Right Ventricle, and Left Ventricle.The upper chamber has two Atria's, while the lower chamber has two ventricles. The start of heartbeat in the excellent condition is at the right atrium known as the SA (Sino Atria) node, and some sections of the cells pass electrical signal. Signal motion is from the atria to the AV (Atrio Ventricular) nodelower chamber has two ventricles.
Revised Manuscript Received on July 05, 2019.
Pooja Sharma , Assistant professor, IT Deptt,Seth Jai Parkash MukandLal institute of Engineering & technology(JMIT), Radaur, Haryana, India
Dr.D.V Gupta, Professor,Department of mathematics,College of Engineering,Roorkee(COER),Roorkee,India
Dr.Surender Jangra, Assistant professor Department of computer Science, Guru Teg bahadur college , Bhawanigarh , Punjab, India
AV node joins the ventricle fiber band that utilizes electrical signals and sends the impulse to each portion of the ventricle and lower chambers. To ensure that the heart works perfectly, the propagation route should be traced correctly[2].
This research has proposed a hybrid optimization technique for the optimization of R-R interval with the combination of GA (Genetic Algorithm) and CS (Cuckoos Search). The features obtained from GA are then optimized with CS that has provided the best features as per its healthy function. For the classification and training of the features, SVM (Support vector machine) with NN (Neural network) has been used as hybridization techniques for the detection of QRS complex. Hybridization has been done to enhance the detection sensitivity with the processing of RR intervals [3].
II. ECG SIGNAL ANALYSIS
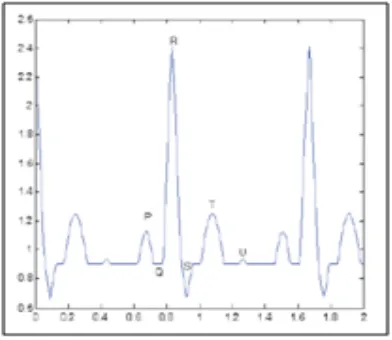
Every beat of the heart is an electrical wave sequence categorized by valleys and peaks. ECG usually gives two types of information. The initial one is an electrical wave duration that passes from the heart and decides that either the electrical activity is slow, irregular, or standard [4]. The subsequent one is an electrical activity amount that passes from the heart muscles and discovers that either the heart is overworked or huge.The frequency range for an ECG signal is 0.05–100 Hz, whereas the dynamic range differs from 1– 10 mV. The characterization of the ECG signal is the five valleys and peaks shown by P, Q, R, S, and T. Sometimes there's also a U wave. ECG analysis performance is dependent on exact and consistent QRS complex with T and P waves’ detection. A general illustration of an ECG wave is depicted below [5]:
Ecg Signal Based Arrhythmia Detection System
Using Optimized Hybrid Classifier
Fig.1ECG Signal with its components
The P wave indicates the activation of two atriums (the heart's upper chamber), while the QRS complex and the T wave represent the excitation of the heart's lower chamber (ventricle). P, QRS, and T waves represent rhythmic electrical depolarization, while myocardium repolarization connected with atrial and ventricular contractions[6].The usual heart rate ranges from 60 to 100 times a minute. The rate is called bradycardia (slow heart) slower than the normal range, and the higher rate is called tachycardia (heart disease). If the ECG signal is not standard, this implies arrhythmia. The waveforms of the typical ECG waveform and the abnormal waveforms are shown in Figures 2(a), 2(b), and 2(c)[7].
Fig. 2(a) Normal sinus rhythm
Fig. 2(b)Sinus Bradycardia
[image:2.595.312.542.322.698.2] [image:2.595.72.268.484.654.2]International Journal of Innovative Technology and Exploring Engineering (IJITEE) ISSN: 2278-3075, Volume-8 Issue-9, July 2019
A. Detection of R-R peaks
The R peak is the positive peak of the QRS region and is detected by relative amplitude assessment in every QRS region [8]. The search for the maximum value on the relative size of every window to remove errors because of baseline drift is usually done [9].
For every detected QRS window, minimum and maximum amplitude values of the ECG data array are computed.
The averages of minimum and maximum values are subtracted from each data point of that window to have relative magnitudes.
The position of the maximum relative size is the R point position of the equivalent QRS window. Do not select the absolute maximum value of the QRS window as the R point position to remove the possibility of detecting the S point.
Figure 3 shows the R-R interval with general ECG waveform [10].
Fig.3 R-R interval
III. METHODOLOGY
This research aims to propose a hybridization method for the detection of R peaks automatically. R-peaks havethe highest amplitude in other ECG signal waveform [11]. For the hybridization, optimization algorithms, GA and CS are used, and for the classification,SVM and NN are used. ECG signals are pre-processed by utilizing a pre-processing technique that removes unwanted signals. For high-frequency signals and for removing low-high-frequency signal, use of high pass filter is considered. The feature extraction algorithm is used for the extraction of pre-processed wave [12]. GA and CS are utilized for reducing the undesired features, whereas ANN and SVM are utilized for classification and to find the normal and abnormal RR peaks.
A. GA (GENETIC ALGORITHM)
It is a heuristic search being inspired via the theory of Charles Darwin of natural evolution. It utilizes the procedure of natural selection in which the selection of fittest individual is by reproduction for producing offspring of subsequent generation [13]. The initialization of algorithm is with a set of solutions known as Population and the solutions from one population are considered and utilized for producing novel Population. It
is inspired by the hope that a different population can be better than the previous one. The solutions which are chosen to develop a novel solution than offsprings are
chosen as per the fitness function.The algorithm for R-peak of GA algorithm is defined below:
Input: R-peaks and R-R intervals
Output: Enhance R-peaks and R-R interval
Initialize GA parameters- Iterations (I), Population_size (PS), Crossover Function, Mutation Function, Fitness Function and Selection Function (SF and st)
Compute I =Input_Size
Fitness_function=f_fit= For evert I,
Variable amount=1
End
While I=Maximum = Return;
( End
B. ANN (ARTIFICIAL NEURAL NETWORK)
NN is a type of connected system with several neurons that are connected [14]. The neuronal network does not execute in the linear phase and does not work in parallel. The basic architecture of the neural network is represented as follows in an architectural form:
Input: Training_data, Target (T) and Neurons (n) Output: Trained Network_Structure
Initialize ANN parameters: E(Epochs), n (Neurons)
Performance_parameters: MSE, Gradient, Mutation and Validation Points
Method: Levenberg_Marquardt (train_LM), data Division: Arbitrary
For every set of T
Group=Training_data categories End
Initialize ANN with training_data of group Net=Newff (training_data, T, n)
Set training_parameters as per requirements and train the system
Net= Return;
Net as ANN trained_ structure End
C. CS (CUCKOO SEARCH)
CS is a nature-inspired algorithm which is based on the strategy of brood reproduction of cuckoo birds for enhancing the population [15]. Though CS is more efficient as compared to another nature-inspired algorithm. It is generally based on below three rules:
Every cuckoo chooses nest arbitrarily and lays the eggs. The best nest with egg’s best quality would be carried on
[image:3.595.66.270.295.464.2] For a fixed amount of nests, host cuckoo discovers the foreign egg having probability . In this scenario, the host cuckoo may throw the eggs or leave the nest and develop a novel one.
Input: R-peaks and R-R intervals
Output:Improve R-peaks and R-R interval
Generate an initial population of R-R interval ECG wave While (t<max population)
Compute fitness function
Select a nest among n number of R-R peaks Evaluate R-R peak’s fitness
If (
Swap j by the novel solution; End
The worse_nest are modified, and the novel solution is created a new position via levy fights;
Store the best solutions;
Arrange the solution and determine the current best; End while
Post processing
D. SVM (Support Vector machine)
In general, a support vector machine is considered a classification method, but they can be used for both types of classification and regression problems. It can easily handle multiple continuous and categorical variables. SVM constructs hyperplanes in multi-dimensional space to separate different classes [16]. The SVM generates the optimal hyperplane iteratively to minimize errors. The core idea of SVM is to find the best marginal hyperplane (MMH), and it is best to divide the dataset into classes. The support vector is the data point closest to the hyperplane. These points will better define the separation line by calculating the margins. These points are more related to the construction of the classifier.
The main goal is to isolate the given data set in the best way. The distance between the closest points is called the margin. The goal is to select the hyperplane with the largest possible boundary between the support vectors in a given data set. The SVM searches for the largest marginal hyperplane in the following steps:
1. Generate a hyperplane that best isolates the class. The left image shows three hyperplanes in black,
blue, and orange. Here, blue and orange have higher classification errors, but black correctly separates the two classes.
2. Select the right hyperplane that is the most isolated from the most recent data point, as shown in the image to the right.
IV. RESULT AND DISCUSSION
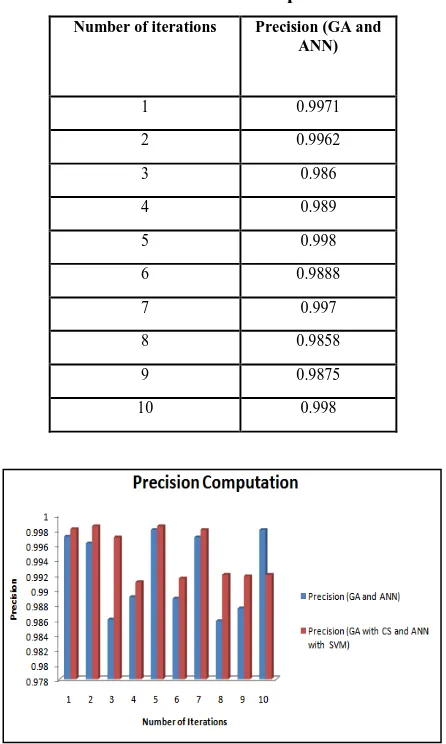
[image:4.595.315.538.226.598.2]This section explains the result obtained after the simulation of the research work. For theexperimentation, parameters such as Precision, Recall, and F-measure are computed. The results have been shown in the tabular and graphical form
Table I. Precision Computation Number of iterations Precision (GA and
ANN)
1 0.9971
2 0.9962
3 0.986
4 0.989
5 0.998
6 0.9888
7 0.997
8 0.9858
9 0.9875
10 0.998
[image:4.595.68.274.608.722.2]Fig. 5 Precision evaluation
Fig. 4Support vector machine
International Journal of Innovative Technology and Exploring Engineering (IJITEE) ISSN: 2278-3075, Volume-8 Issue-9, July 2019
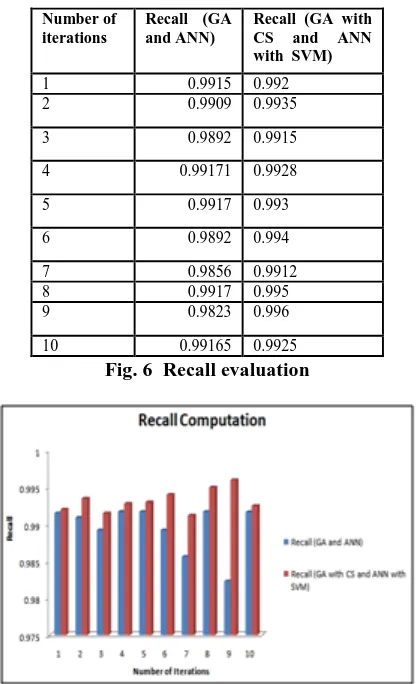
Table II. Recall Computation Number of
iterations
Recall (GA and ANN)
Recall (GA with CS and ANN with SVM)
1 0.9915 0.992
2 0.9909 0.9935
3 0.9892 0.9915
4 0.99171 0.9928
5 0.9917 0.993
6 0.9892 0.994
7 0.9856 0.9912
8 0.9917 0.995
9 0.9823 0.996
10 0.99165 0.9925
Fig. 6 Recall evaluation
[image:5.595.65.275.68.410.2]Above figure(6) and table depicts the comparison of Recall (GA and ANN) and Recall (GA with CS and ANN with SVM) for R peak detection in ECG. The blue bar in the figure shows the result of GA with ANN and red bar shows the results of GA with CS and ANN with SVM. The average value of Recall (GA and ANN) is 0.9895, whereas the average value of Recall (GA with CS and ANN with SVM) is 0.9931.
Table III. F-measure Computation
Number of iterations
F-measure (GA and ANN)
F-measure (GA with CS and ANN with SVM)
1 0.9951 0.996
2 0.9854 0.9958
3 0.99815 0.9985
4 0.9926 0.9968
5 0.9917 0.9925
6 0.9952 0.996
7 0.9948 0.9958
8 0.9949 0.9968
9 0.9939 0.994
10 0.9945 0.9952
Fig. 7 F-measure evaluation
Above figure(7) and table depicts the comparison of F-measure (GA and ANN) and F-F-measure (GA with CS and ANN with SVM) for R peak detection in ECG. The blue bar in the figure shows the result of GA with ANN and red bar shows the results of GA with CS and ANN with SVM. The average value of F-measure (GA and ANN) is 0.9936, whereas the average value of F-measure (GA with CS and ANN with SVM) is 0.9957.
Table IV. Accuracy Computation Number of
iterations
Accuracy (GA and ANN)
Accuracy (GA with CS and ANN with SVM)
1 92.9555 93.805
2 93.1885 94.502
3 92.988 93.995
4 93.188 94.295
5 93.184 94.258
6 93.196 94.285
7 93.188 94.929
8 92.189 93.562
9 92.192 94.256
[image:5.595.319.532.365.696.2]10 93.1953 94.456
[image:5.595.72.264.534.709.2]Above figure(8) and table depicts the comparison of Accuracy (GA and ANN) and Accuracy (GA with CS and ANN with SVM) for R peak detection in ECG. The blue bar in the figure shows the result of GA with ANN and red bar shows the results of GA with CS and ANN with SVM. The average value of Accuracy (GA and ANN) is 92.94, whereas the average value of Accuracy (GA with CS and ANN with SVM) is 94.23.
V. CONCLUSION
ECG signal detection is associated with cardiac analysis and diagnosis. It can be indicated as an iteration of P-QRS-T waves. The main objective behind ECG signal analysis is to discover the QRS complex. R peak detection is the first and chief step for finding the QRS complex. So, this research work has proposed an efficient ECG arrhythmia classification technique with the hybrid classifier (SVM and ANN). For the optimization of the research work, optimization methods (GA and CS) are used using an optimal objective function. The comparison has been drawn of the proposed hybrid classifier with ANN. The computation has been performed using performance parameters like Precision, Recall, F-measure, and accuracy. The average value of Precision (GA and ANN) is 0.9923, whereas the average value of Precision (GA with CS and ANN with SVM) is 0.9948. The average value of Recall (GA and ANN) is 0.9895, whereas the average value of Recall (GA with CS and ANN with SVM) is 0.9931. The average value of F-measure (GA and ANN) is 0.9936, whereas the average value of F-measure (GA with CS and ANN with SVM) is 0.9957. The average value of Accuracy (GA and ANN) is 92.94, whereas the average value of Accuracy (GA with CS and ANN with SVM) is 94.23. From the experimentation, it has been concluded that the GA with CS has shown enhanced results.
REFERENCES
1. Al Rahhal, M. M., Bazi, Y., AlHichri, H., Alajlan, N., Melgani, F., & Yager, R. R. (2016). Deep learning approach for active classification of electrocardiogram signals. Information Sciences, 345, 340-354. 2. Chunyan, X. U., Wang, T., Hou, J., Feng, H., Guo, Z., Wang, Z., ... &
Zhen, R. (2017). Analysis of abnormal electrocardiogram index among residents in Keshan disease areas. Chinese Journal of Endemiology, 36(4), 284-287.
3. Acharya, U. R., Fujita, H., Oh, S. L., Hagiwara, Y., Tan, J. H., & Adam, M. (2017). Application of deep convolutional neural network for automated detection of myocardial infarction using ECG signals. Information Sciences, 415, 190-198.
4. Kumar, M., Pachori, R. B., & Acharya, U. R. (2017). Characterization of coronary artery disease using the flexible analytic wavelet transform applied on ECG signals. Biomedical signal processing and control, 31, 301-308.
5. Acharya, U. R., Fujita, H., Lih, O. S., Adam, M., Tan, J. H., & Chua, C. K. (2017). Automated detection of coronary artery disease using different durations of ECG segments with a convolutional neural network. Knowledge-Based Systems, 132, 62-71.
6. Adam, M., Oh, S. L., Sudarshan, V. K., Koh, J. E., Hagiwara, Y., Tan, J. H., ... & Acharya, U. R. (2018). Automated characterization of cardiovascular diseases using relative wavelet nonlinear features extracted from ECG signals. Computer methods and programs in biomedicine, 161, 133-143.
7. Zheng, G., Fang, G., Shankaran, R., Orgun, M. A., Zhou, J., Qiao, L., & Saleem, K. (2017). Multiple ECG fiducial points-based random binary sequence generation for securing wireless body area networks. IEEE Journal of biomedical and health informatics, 21(3), 655-663.
8. Jeppesen, J., Beniczky, S., Frederiksen, A. F., Sidenius, P., & Johansen, P. (2017, July). Modified automatic R-peak detection algorithm for patients with epilepsy using a portable electrocardiogram
recorder. In 2017 39th Annual International Conference of the IEEE Engineering in Medicine and Biology Society (EMBC) (pp. 4082-4085). IEEE.
9. Venkatesan, C., Karthigaikumar, P., & Varatharajan, R. (2018). A novel LMS algorithm for ECG signal preprocessing and KNN classifier based abnormality detection. Multimedia Tools and Applications, 1-10. 10. Linh, T. H. (2018). A SOLUTION FOR IMPROVEMENT OF ECG ARRHYTHMIA RECOGNITION USING RESPIRATION INFORMATION. Vietnam Journal of Science and Technology, 56(3), 335.
11. Acharya, U. R., Fujita, H., Oh, S. L., Hagiwara, Y., Tan, J. H., Adam, M., & Tan, R. S. (2018). Deep convolutional neural network for the automated diagnosis of congestive heart failure using ECG signals. Applied Intelligence, 1-12.
12. Li, R., Frasch, M. G., & Wu, H. T. (2017). Efficient fetal-maternal ECG signal separation from two-channel maternal abdominal ECG via diffusion-based channel selection. Frontiers in physiology, 8, 277. 13. Cabra, J. L., Mendez, D., & Trujillo, L. C. (2018, May). Vast Machine
Learning Algorithms Evaluation Applied to ECG Authentication and Gender Recognition. In Proceedings of the 2018 2nd International Conference on Biometric Engineering and Applications (pp. 58-64). ACM.
14. Martinek, R., Kahankova, R., Nazeran, H., Konecny, J., Jezewski, J., Janku, P., ... & Fajkus, M. (2017). Non-invasive fetal monitoring: A maternal surface ECG electrode placement-based novel approach for optimization of adaptive filter control parameters using the LMS and RLS algorithms. Sensors, 17(5), 1154.
15. Diker, A., Avci, E., & Gedıkpinar, M. (2017, May). Determination of R-peaks in ECG signal using Hilbert Transform and Pan-Tompkins Algorithms. In Signal Processing and Communications Applications Conference (SIU), 2017 25th (pp. 1-4). IEEE.
16. Tan, J. H., Hagiwara, Y., Pang, W., Lim, I., Oh, S. L., Adam, M., ... & Acharya, U. R. (2018). Application of stacked convolutional and long short-term memory network for accurate identification of CAD ECG signals. Computers in biology and medicine, 94, 19-26.
17. Sharma, M., San Tan, R., & Acharya, U. R. (2018). A novel automated diagnostic system for classification of myocardial infarction ECG signals using an optimal biorthogonal filter bank. Computers in biology and medicine.
18. Acharya, U. R., Oh, S. L., Hagiwara, Y., Tan, J. H., Adam, M., Gertych, A., & San Tan, R. (2017). A deep convolutional neural network model to classify heartbeats. Computers in biology and medicine, 89, 389-396.
19. Kumar, M., Pachori, R. B., & Acharya, U. R. (2018). Automated diagnosis of atrial fibrillation ECG signals using entropy features extracted from flexible analytic wavelet transform. Biocybernetics and Biomedical Engineering, 38(3), 564-573.
20. Sharma, T., & Sharma, K. K., (2017). QRS complex detection in ECG signals using locally adaptive weighted total variation denoising. Computers in biology and medicine, 87, 187-199.
21. Yildirim, O., San Tan, R., & Acharya, U. R. (2018). Efficient compression of ECG signals using deep convolutional autoencoders. Cognitive Systems Research, 52, 198-211.
![Figure 3 shows the R-R interval with general ECG waveform [10].](https://thumb-us.123doks.com/thumbv2/123dok_us/8195375.259215/3.595.66.270.295.464/figure-shows-r-r-interval-general-ecg-waveform.webp)