International Journal of Innovative Technology and Exploring Engineering (IJITEE) ISSN: 2278-3075, Volume-8 Issue-9, July 2019
Abstract: In present global scenario where time and cost have become synonymous with one another, it is important improve the overall performance of the industry. Heavy industries such as automobile industries invest a lot of time and money in establishing manufacturing facilities which demands effective utilization of resources to save time and money. This research is an attempt in an assembly line to analyze and expose the effect of sequencing based on the takt time and its impact over the performance of the line. Initial study involves monitoring and standardization of process time for all operations using Maynard Operation Sequencing Technique. Work is further extended to the concept of sequencing and simulation. Calculated process time are used to sequence the operations based on standard Priority Dispatching Rules such as Longest Processing Time, Shortest Processing Time, Potential Score Method, Followers Based Ranking and a custom developed model based on takt time. Discrete Event Simulation of the assembly line was run for all these sequences and it was found that the model developed based on takt time fetched the best results. The model also showed the maximum utilization, line efficiency among all models and had a much better smoothness index than other models.
Index Terms: Maynard Operation Sequencing Technique (MOST), Potential Score Method, Followers Based Ranking, Priority Dispatching Rules (PDR), Sequencing, Discrete Event Simulation (DES), ARENA, Simple Assembly Line Balancing Problem (SALBP), Takt time
I. INTRODUCTION
For a manufacturing organization to be dominant in the present competitive world, re-engineering is one of the efficient and proven options that could be adopted to increase the productivity using same resources [1]. In order to secure maximum profit and to sustain in the dynamic market, to be able to produce to outperform among the competitors is the only key for any organization [2]. Identification of critical functional areas of the industry would be helpful to increase the productivity [3]. Current working methods could be made more effective by elimination of idle time and down time. Inefficient planning is identified to be one of the major hindrances for any organization that reduces the utilization of resources and hence reduces the efficiency of many operations [4].
Revised Manuscript Received on July 05, 2019.
Hari Krishna Kaka, Department of Mechanical Engineering, Amrita School of Engineering, Coimbatore, Amrita Vishwa Vidyapeetham, India.
Pachigolla Kesava Sai Srujan, Department of Mechanical Engineering, Amrita School of Engineering, Coimbatore, Amrita Vishwa Vidyapeetham, India.
Narassima M. S., Department of Mechanical Engineering, Amrita School of Engineering, Coimbatore, Amrita Vishwa Vidyapeetham, India.
Anbuudayasankar S. P., Department of Mechanical Engineering, Amrita School of Engineering, Coimbatore, Amrita Vishwa Vidyapeetham, India.
This might affect the delivery made to the customer such as failure to meet the demand, delayed delivery, etc. Hence, it is always essential to maintain proper metrics for calculations to ensure reliability of planning [6]. This might affect the delivery made to the customer in several ways such as failure to meet the demand, delayed delivery, etc. Hence, it is always essential to maintain proper metrics for calculations to ensure reliability of planning [5]. Most of the manufacturing industries including the automobile industry involve a huge assembly process. It is important to identify bottlenecks along the assembly lines as it results in idleness of other successive resources and also increases the waiting time of jobs along the line [6]. Bottlenecks are easily identifiable through time study as those processes that have cycle time greater than the takt time to be defined to achieve the desired throughput [7]. Assembly line problems are broadly classified as SALBP which involves minimization of number of workstations for a fixed cycle time and SALBP-2 which involves minimization of cycle time for a fixed number of workstations [8, 9]. The current research could fit more into the SALBP problem as the focus is on improvement of the assembly line process efficiency and reducing the workforce to meet the demand [7].
II. BACKGROUND
Imbalance in material flow, unwanted movement, wastage of material might increase the inefficiency [7]. Time and motion study would help to differentiate among various performance parameters at different time instances [10]. Motion study could be made effective by adopting standardized techniques that define motion. One such system referred to as “Therbligs” has been adopted in this study. Therbligs indicates a system that classifies elemental motion into 18, which are used to study the motion economy and performance with respect to movement in any workplace [2]. Method time Measurement (MTM) and Maynard Operation Sequencing Technique (MOST) are some of the prominent techniques adopted for motion and time study. There are a lot of differences between MTM and MOST. MTM technique requires more investment of time compared to MOST [11]. Also, MOST remains to be the simpler technique between the two and is used to measure repetitive and non-repetitive operations in Manufacturing and administrative sectors [3, 11, 12]. MOST segregates tasks performed into Value Addition (VA), Essential Non Value Addition (ENVA) and Non Value Addition (NVA) and defines standard time for
Productivity Improvement of An Assembly Line
using MOST and Heuristic
various operations to be performed [2, 3]. All movements are recorded in Time Measuring Unit (TMU), a standard used to measure time in study of motion time systems [14]. One major factor that remains a hindrance in conventional stop watch study is the preciseness of the observer who is monitoring various time periods. This is overcome by implementing MOST technique by assigning appropriate values of time for various operations [15]. While implementing MOST technique, confidence interval may be defined to accommodate the deviations [3, 15]. It also sets time standards within the defined confidence interval [15]. Also, the captured time periods might not remain true at all instances as the workers cannot be presumed to work with a consistent pace throughout the day [12]. Production cycle time might also be reduced by properly following the takt time that is to be followed to obtain the desired productivity. This could possibly save manpower and reduce the number of resources employed for the task(s). The key advantage of this technique is that this requires minimal capital investment [7, 13, 16]. Utilization at different work stations/ areas and capacity planning might be well studied and interpreted by implementing this technique [12, 17]. This also leads to a standardized and a consistent work flow which in turn reduces the fatigue rate of operators and thereby increases their working efficiency [11]. TMU calculated using this approach is used in determination of process time at each station so as to determine the suitable sequence to attain maximum throughput. Sequencing plays an important role in balancing the line by maximizing the utilization of resources, reducing the Work In Progress (WIP) and by reducing the cycle time [18]. Standard rules for prioritizing jobs based on production parameters such as SPT, Earliest Due Date (EDD), Critical Ratio (CR), etc., are applicable in most of the scenarios but might be effective only in some of them depending on the operational nature of the industry. This mandates the implementation of hybrid, tailor-made rules for prioritizing jobs for specific industrial scenarios [19]. The performance of various rules can be compared by simulation as it is highly impossible to implement these in a real-time environment as it involves investment of huge amount of time and also affects productivity. Simulation helps in determining the high level functioning of systems for various production scenarios without actual investment of time and cost [20]. This paves way for simulation techniques as it is cost-effective and also saves time. Output parameters such as VA time, NVA time, wait time, number in, number out, utilization, etc., could be determined through simulation for various run parameters and the model that yields most desired output could be implemented [21]. Though theoretical results prove to be effective, there may be variations during practical implementation owing to various production constraints that are not included in the simulation model.
From the literature, it is understood that the productivity could be improved by developing standards for time. These values are arrived based on the tables developed by Maynard. These values help in determining the lower level time at operator levels. It is clear that standardizing time in an industry would help us to calculate the processing time for various processes and hence sequence the jobs accordingly so as to have a smoother work flow throughout, without exceeding the takt time defined for each station. This would increase the utilization of each of the resources. Not much work is being done after the time have been standardized and
optimized. Hence, this research extends the scope after standardizing time to PDR and simulation. One of the main objectives of this research is to analyze the impact of takt time on effectiveness of sequencing. This is achieved by developing multiple sequences of operations using standard PDRs and a custom developed model based on the takt time for simulation. The results of MOST are used to sequence operations based on different rules and use the obtained sequences for simulation. Process time that have been obtained are substituted for each process in each station. These processing times are substituted in different PDRs to find the corresponding sequences of operation obtained which are used to simulate the manufacturing environment. The results of simulation help us to determine the sequence of operations that would give the best result among those that are used.
III. METHODOLOGY
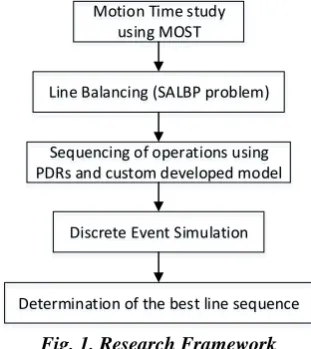
The research has been conducted in an automobile assembly unit in India. An assembly line containing 58 operations was chosen fort the study. It has been observed that the company was not able to meet the demand. Lack of standardization of scheduling process was a major hindrance for productivity. The key motive was to increase the throughput so as to meet demand. The research can be divided into various phases as described in the flow chart:
Motion Time study using MOST
Line Balancing (SALBP problem)
Sequencing of operations using PDRs and custom developed model
Discrete Event Simulation
[image:2.595.347.503.366.541.2]Determination of the best line sequence
Fig. 1. Research Framework
The initial study involved motion and time study such as observing the various processes in all stations, work flow movement, process time for each of the processes. From this, the sequence of work was determined and motion time was calculated based on the understanding of various processes and corresponding movements.
A. Motion and time study
This involved the use of MOST technique to estimate the time intervals for performing various tasks. This technique is governed by a set of standards that define specific time periods for performing operations. There are sequence models that give the time required to perform every operation such as free-hand movement (through space without any constraint), controlled movement (restricted), tool use movement (movement with tool on-hand), etc., and also general modes to define
International Journal of Innovative Technology and Exploring Engineering (IJITEE) ISSN: 2278-3075, Volume-8 Issue-9, July 2019
[image:3.595.302.527.45.673.2]of these would be used much in real-time scenarios. The below table indicates the notations for various movements considered in MOST.
Table I Classification of MOST movements
Movement Syntax Description
General move
ABG ABP A A – Distance
B - Body motion G - Gain control P - Placement Control
move
ABG MXI A M- Move in control
X - time taken I - Alignment Tool Use ABG ABP T* ABP A F/L - Fasten/Loosen
C - Cut S - Surface treat
M - Measure R - Record
T - think
For instance, consider a sequential operation of picking a job within reach, walking 3-4 steps, placing it on the table and returning to initial position. For this, the time would be generated as by segregating into the following phases:
Table II Phrases of General move
Get Put Return
Within reach, no body motion, grasp the bolt
Walk 3-4 steps, within reach, place the bolt on the table
Return to initial position.
A1B0G1 A6B0P3 A6
These values are to be summed up and multiplied by 10 and further with TMU to obtain the time in seconds.
Sum of all index values: 1+0+1+6+0+3+6 = 17 Time measuring unit (TMU): 17*10 = 170 Normal time (seconds): 170 * 0.036 = 6.12 s Standard time = Normal time + Allowances
Allowances Personal (4-7%), Fatigue (4%), Unavoidable delays (ILO Standards)
NOTE: Allowance of 11% is considered Standard time = 6.12 * 1.11 = 6.79 s
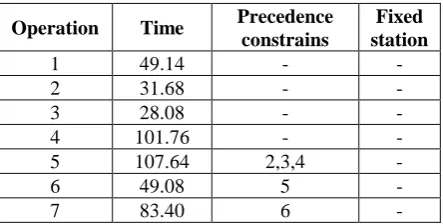
[image:3.595.47.269.671.783.2]Similarly, the time required to perform various operations were calculated. Various operations along with the precedence constraints, fixed stations, and processing time are tabulated below
Table III Constraints for the activities
Operation Time Precedence constrains
Fixed station
1 49.14 - -
2 31.68 - -
3 28.08 - -
4 101.76 - -
5 107.64 2,3,4 -
6 49.08 5 -
7 83.40 6 -
8 34.84 7 -
9 55.92 8 -
10 39.96 9 -
11 43.68 10 -
12 43.68 11 -
13 22.32 12,14 -
14 18.00 12 -
15 52.60 13 -
16 52.60 13 -
17 40.32 15, 16 -
18 13.68 17 -
19 24.12 18 -
20 41.64 - -
21 8.64 - -
22 60.28 21 -
23 47.92 22 -
24 39.80 23 -
25 72.36 - -
26 69.16 - 5
27 13.32 19 -
28 118.80 - 7
29 120.24 1 10
30 63.04 29 -
31 62.32 30 -
32 15.60 24 -
33 59.84 - 11
34 60.44 33 -
35 43.56 34 -
36 60.96 35 -
37 75.40 36 -
39 64.24 38 -
40 47.80 - -
41 68.16 40 -
42 62.92 41 -
43 30.60 - -
44 30.60 43 -
45 44.52 44 -
46 44.52 45 -
47 20.00 - -
48 57.96 46 -
49 40.56 - -
50 32.40 - -
51 41.64 48 -
52 51.32 25 -
53 83.28 - -
54 15.12 51 -
55 58.88 52 -
56 42.32 28 -
57 20.52 - -
58
120.24 All operations
from 1 to 57 -
B. Line Balancing (SALBP Problem):
This study fits better as an SALBP problem as it focuses on improving productivity for a given demand, which is fixed whereas the number of work stations could be altered. Total work time of the company per shift is 455 minutes. Demand per shift is 150units. Takt
which the job will be available at a station. Hence:
Takt time (C) = 455/150 = 3.033 minutes ~ 182 s Here, takt time indicates the cycle time for each station.
C. Sequence of operation:
Sequencing rules govern the order in which various operations would be performed on jobs. As indicated in table III, there are a few precedence constraints and fixed stations that are to be taken care during sequencing. Precedence constraints indicate the operations that are to be performed before the present operation. Fixed stations indicate the stations whose positions cannot be altered. The last station is the audit station which requires completion of all jobs in precedence. Upon calculation of time using MOST for all operations in all stations, the total time required was found to be 2964.38 s. From this, the total number of required stations (N) can be determined as:
N = Total time for all operations/ Takt time For N = 2964.38/ 182 = 16.28 ~ 17 stations
Owing to the losses due to efficiency of workers, uninvited happenings etc., a station is added to compensate the losses. Hence, the line requires 18 stations in total.
The processes are be grouped for each station in such a way that the summation of process time of all processes in any station does not exceed the takt time.
ti= Time required for operation i j = Working station
C = Takt time
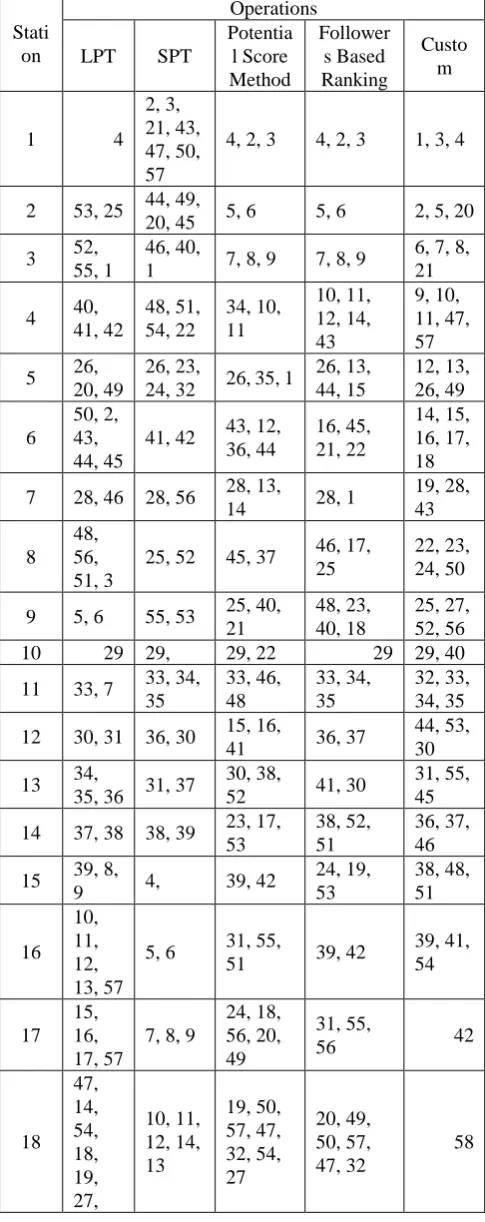
Some standard PDRs such as LPT, SPT, Potential Score Method, Followers Based Ranking, and a custom developed model were used for sequencing of operations. Sequencing logic of these rules are as follows:
i. LPT – highest preference to the operation with longest process time
ii. SPT – highest preference to the operation with shortest process time
iii. Potential Score Method – highest score is given the first priority. Score is the sum of time periods of all succeeding operations
iv. Followers Based Ranking – highest score if given the first priority. Score is obtained as the sum of all succeeding operations
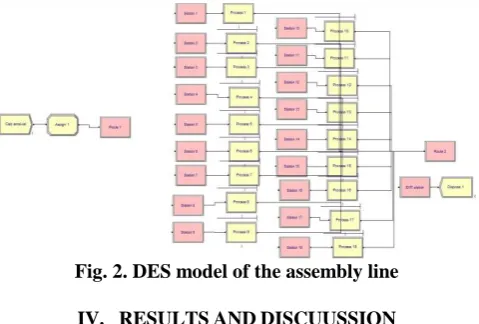
D. Discrete Event Simulation:
Based on the observations made from the assembly line, a DES model was developed. Some of the production related parameters to be known before designing a simulation model which include the process time of jobs for all operations, arrival rate of incoming jobs, sequence in which jobs undergo operations, etc., [22, 23]. All incoming jobs undergo same set and sequence of processes through the assembly line. Each incoming unit is considered as a single entity. Process times for the parts are given based on the calculated values from TMU in seconds. Takt time determines the time period for which the job would be available at each station. Simulation was run for the current sequence which is being followed by the company, for other sequences obtained by LPT, SPT, Potential Score Method, Followers Based Ranking, and for the custom developed sequence using takt time as reference to
[image:4.595.308.548.84.246.2]group processes [24]. Fig.2 represents the simulation model developed using ARENA.
Fig. 2. DES model of the assembly line IV. RESULTSANDDISCUUSSION
The results obtained from various phases such as MOST analysis, ARENA simulation and calculation of line performance parameters are discussed in this section. The operations were regrouped and arranged such that they do not violate precedence and fixed station constraints. The last station, being a quality assurance station cannot be altered. Also, it cannot be coupled with other operations. Hence, the time that is unused in this station cannot be accounted during computation of utilization.
International Journal of Innovative Technology and Exploring Engineering (IJITEE) ISSN: 2278-3075, Volume-8 Issue-9, July 2019
Table IV Maximum, minimum and average Process time for all sequences
LPT SPT
Potentia l Score Method Follower s Based Ranking Custom
Max 178.9 175 180.5 175.9 181
Min 101.8 101.8 119.9 120.2 62.9
[image:5.595.47.294.53.147.2]Avg 148.3 148.2 156 156.01 163.68
Table V Grouping of operations for various sequences Stati
on
Operations
LPT SPT
Potentia l Score Method Follower s Based Ranking Custo m
1 4
2, 3, 21, 43, 47, 50, 57
4, 2, 3 4, 2, 3 1, 3, 4
2 53, 25 44, 49,
20, 45 5, 6 5, 6 2, 5, 20
3 52,
55, 1
46, 40,
1 7, 8, 9 7, 8, 9
6, 7, 8, 21
4 40,
41, 42 48, 51, 54, 22 34, 10, 11 10, 11, 12, 14, 43 9, 10, 11, 47, 57
5 26,
20, 49
26, 23,
24, 32 26, 35, 1
26, 13, 44, 15 12, 13, 26, 49 6 50, 2, 43, 44, 45
41, 42 43, 12, 36, 44 16, 45, 21, 22 14, 15, 16, 17, 18
7 28, 46 28, 56 28, 13,
14 28, 1
19, 28, 43 8 48, 56, 51, 3
25, 52 45, 37 46, 17, 25
22, 23, 24, 50
9 5, 6 55, 53 25, 40,
21
48, 23, 40, 18
25, 27, 52, 56
10 29 29, 29, 22 29 29, 40
11 33, 7 33, 34, 35 33, 46, 48 33, 34, 35 32, 33, 34, 35
12 30, 31 36, 30 15, 16,
41 36, 37
44, 53, 30
13 34,
35, 36 31, 37
30, 38,
52 41, 30
31, 55, 45
14 37, 38 38, 39 23, 17, 53
38, 52, 51
36, 37, 46
15 39, 8,
9 4, 39, 42
24, 19, 53 38, 48, 51 16 10, 11, 12, 13, 57
5, 6 31, 55,
51 39, 42
39, 41, 54 17 15, 16, 17, 57
7, 8, 9
24, 18, 56, 20, 49
31, 55,
56 42
18 47, 14, 54, 18, 19, 27, 10, 11, 12, 14, 13 19, 50, 57, 47, 32, 54, 27 20, 49, 50, 57, 47, 32 58 21, 22
19 23, 24, 32
15, 16,
17, 18 58
54, 27,
58
20 58 19, 27,
[image:5.595.47.290.175.787.2]58
Fig. 3 represents the load chart which clearly indicates that the loading is not uniform in the current system. The uniformity of loading has been considerably improved by following the custom developed sequence. Current loading sequence indicates that the stations 2, 3, 4, 10, 11, 12 are loaded more than the takt time which lead to idleness of resources due to waiting. Contrarily, stations 1, 7, 8, 13, 15, 16 and 17 are loaded much lesser than the takt time. In order to load all the stations uniformly, the sequence in which the operations were performed was altered such that the loading happens much more uniformly in all stations, closer to the takt time defined to meet the demand.
Fig. 3. Comparison for the existing model and custom model
From the results of simulation obtained for the current sequence of operations, it is seen that only 50 units are produced per shift which is only 33.33% of the required throughput to meet the demand. The altered systems all showed a throughput of 142 which is 94.67% of the required productivity. It is observed that the current model has 51 jobs waiting on an average throughout the simulation time. In the alternate models, jobs are seen to have no waiting time which indicates a continuous flow throughout. Average utilization of resources was found to be 0.42 for the current model which was increased to 0.86 in the custom sequence model. This shows higher utilization of all resources. The last station, being an audit operation has no scope for alteration as it requires all operations to be completed before the job undergoes audit. Hence, the time period for which any incoming job is idle here cannot be accounted for loss as it accounts for rectifying any uninvited happenings during any of the preceding processes. Table VI compares various line related parameters for various rules that were used in the study. The following are the notations used in the tables for different measured parameters:
P1: Number of work stations P2: Number of workers P3: Utilization
[image:5.595.303.551.276.424.2]Table VI Comparison of line parameters for all the approaches
P1 P2 P3 P4 P5 P6
Current 18 35 34.96 386967 16.41 50
LPT 20 20 76.34 34528.5 82.86 142
SPT 20 20 76.43 31662.6 84.7 142
PWS 19 19 79.83 19930.9 86.42 142
FBR 19 19 80.29 17885.9 88.69 142
Custom 18 18 86.09 22878.2 91.01 142
Line efficiency and smoothness index values were calculated for various models and the results are presented in table VI. Line efficiency is the ratio of Standard Man Minutes (SMM) to the product of number of stations and cycle time. Smoothness index is the calculated as follows:
Smoothness index =
where, i = current working station T = Cycle time
A line with a lesser smoothness index value indicates a better balance; zero indicates a perfect line balance. Line Balancing Rate (LBR) is the ratio of total operation time to the product of highest operating time (of a station) and the number of operators. Line Balancing Loss Rate (LBLR) is the difference of unity and LBR. All the jobs are loaded below the takt time in the custom model and it gives the maximum line efficiency of 91.01% and has the maximum value of utilization compared to other models. Smoothness index of this model is also lesser than that of the current model, indicating that the line is well balanced than the current model.
V. CONCLUSIONANDSCOPEFORFUTUREWORK
The research shows a novel approach towards sequencing to improve the performance of an assembly line using takt time as a key factor for sequencing of operations. This approach proved to show an efficient performance than other approaches considered in this study. MOST analysis was useful in standardizing the process time for all operations. The overall process time was found to be 2964.38 s and the number of stations were identified to be 18. Takt time was found to be 182 s (for each station). These values were further used for prioritizing the jobs using some standard PDRs such as LPT, SPT, Potential Score Method and Followers Based Ranking. The same were also substituted in a custom developed sequence which grouped jobs in stations based on the average takt time that was defined for achieving the required demand. The sequences thus obtained from the above mentioned rules were used as inputs to run the simulation model that was developed for the assembly line. The results indicated that the throughput increased from 50 units per shift to 142 units per shift i.e., an increase from 33.33% to 94.67% of the total demand. Also, the system that was in practice had bottlenecks at stations 2, 3, 4, 10, 11, 12 which were all eliminated as represented in the load chart. On an average, 51 jobs waited at station 2 in the current model, which was also eradicated. Average utilization was increased from 0.42 to 0.86 which was the highest among all the models
considered. The custom developed sequence also showed the highest line efficiency of 91.01% and a smoothness index much lesser that of the current model. Hence, the custom developed model is suggested as the best model to be implemented in the system under consideration. This research can be extended by optimizing the sequencing process. Considering takt time as a player that influences idle time would be helpful in effectively utilizing the time for which the job would be available at each station of the assembly line. Make to order companies would be benefited by implementing this approach to meet the demand. This approach can also be extended for companies following make to order strategy. The total demand could be considered as the sum of current demand and stock available inventory. Safety Stock might also be included based on the company’s manufacturing strategy. Concept of active scheduling can be implemented to fetch better and optimized results, without the constraints being violated. This method would fit the current scenario as active scheduling eliminates all possible left shifts of any production on a Gantt chart. This might eliminate/ minimize the idle time to the extent possible at all stations. This might further improve the results by reducing the number of stations, reducing the total process time, improving line efficiency, smoothness index, etc.,
REFERENCES
1. E. A. H. Hanash, A. N. M. Karim, Saravanan Tanjong Tuan (2017). Throughput Enhancement of Car Exhaust Fabrication Line by Applying MOST. International Conference on Mechanical, Automotive and Aerospace Engineering, 184. 1-13
2. Ankit Mishra, Vivek Agnihotri, D. V. Mahindru. (2014) Application of Maynard Operation Sequence Technique at Tata Motors and Adithya Automotive Application Pvt Ltd . Lucknow for Enhancement of Productivity-A Case Study, Global Journal of Researches in Engineering: B Automotive Engineering, 14(2).
3. R. Jain, Sumit Gupta, G.S. Dangayach (2016) Optimization of Labour Productivity Using MOST Technique. International journal on productivity and quality Management. 19(4).
4. P. A. A. Karad, N. K. Waychale, and N. G. Tidke, (2016) Productivity Improvement By Maynard Operation Sequence Technique,” International Journal of Engineering Research and General Science, 4(2), 657–662.
5. A. N. Mustafizul Karim, Saravanan Tanjong Tuan, H. M. Emrul Kays, (2016) Assembly line productivity improvement as re-engineered by MOST, International Journal of Productivity and Performance Management 65(7). 977-994
6. F. Nurhanani, A. Bakar, M. F. Ramli, M. Z. Zakaria, T. C. Sin, and H. Masran (2018) Minimization of Bottleneck and Workstations for Assembly Line Balancing Problem in Power Transformer Manufacturing Using Heuristics. International Conference on Smart Instrumentation, Measurement and Applications Issue. 8. 29–30. 7. S. T. Tuan et al. (2014) Improvement of Workflow and Productivity
through Application of Maynard Operation Sequence Technique (MOST). Proceedings of the 2014 International Conference on Industrial Engineering and Operations Management Bali, Indonesia, 2162–2171.
8. M. Gansterer and R. Hartl, (2017) One- and two-sided assembly line balancing problems with real-world constraints, International Journal of Production Research, 56(8). 3025-3042.
9. Z. Li, I. Kucukkoc and Z. Zhang, (2018) Branch, bound and remember algorithm for U-shaped assembly line balancing problem, Computers & Industrial Engineering, 124. 24-35.
10. J. Senthil and G. Haripriya, (2016) time analysis with MOST technique, International Journal of Chem. Sci. 14(2). 519–526.
11. A. Cimino, F. Longo, G. Mirabelli, and E. Papoff, (2008) MOST and MTM for work methods optimization: A real case study based on modeling & simulation. 10th
International Journal of Innovative Technology and Exploring Engineering (IJITEE) ISSN: 2278-3075, Volume-8 Issue-9, July 2019
at the International Mediterranean and Latin American Modeling Multiconference. 35–41.
12. V. A. Deshpande, (2007) M. O. S. T. – The Most Advanced Work Measurement Technique,” Journal of Engineering & Technology, 20. 109-113.
13. Mehvish Jamil, Manisha gupta, Abhishek Saxena and Vivek
Agnihotri (2019) Optimization of productivity by work force management through ergonomics and standardization of process activities using MOST analysis - A case study, Global Journal of Researches in Engineering Mechanical and Mechanics Engineering, 13(6) 1–14.
14. D. Patel and P. Tomar, (2017) A Review on Optimization in Total Operation Time Through Maynard Operation Sequence Technique, International Journal of Science Technology & Engineering 3(9), 13–16.
15. A.P. Puvanasvaran, C.Z Mei, V.A. Alagendran (2013) Overall equipment eficiency improvement using time study in an Aerospace Industry”, Procedia Engineering. 68, 271–277.
16. T. K. Yadav, (2013) Measurement Time Method for Engine Assembly Line with Help of Maynard Operating Sequencing Technique ( MOST )”, International journal of innovations in Engineering and Technology, 2(2). 131-136
17. Anuja Pandey, Dr. V.S. Deshpande, Santhosh Gunjar, (2016) Application of Maynard Operation Sequencing Technique", International journal of innovations in Engineering and technology, 6(3). 39-44
18. Haile Sime, Prabir Jana, Deepak Panghal, (2019) Feasiblility of using simulation technique for line Balancing in apparel industry", Procedia Manufacturing, 30 300-307.
19. T. C. Chiang & L. C. Fu (2007) Using dispatching rules for job shop scheduling with due date-based objectives, International Journal of Production Research, 45(14), 3245-3262,
20. Melouk, S.H., Freeman, N.K., Miller, D., & Dunning, M.M. (2013). Simulation optimization-based decision support tool for steel manufacturing. International Journal of Production Economics. 141(1), 269-276.
21. Jilcha, K., Berhan, E. and Sherif, H. (2015). ‘Workers and Machine Performance Modeling in Manufacturing System Using Arena Simulation’. Journal of Computer Science and Systems Biology. 8(4), 185-190.
22. Narassima, M. S., Anbuudayasankar, S. P., and Shriram K. V. (Accepted for Publication) ‘Performance improvement in Cardiology department of a hospital by Simulation’. International Journal of Advanced Intelligence Paradigms.
23. Kartik Balkumar, Resmi Ann Thomas, Anbuudayasankar S. P., Ganesh, K., Silvian, S. P. and Joy, G. V. ‘Effective healthcare management in India – the role of knowledge management’. International Journal of Value Chain Management, 7(2), 97-123.
24. Sathish Kumar, V. R., Anbuudayasankar, S. P., and Thennarasu, M. (2016) ‘Design and development of simulation based model to rank job flow strategies’, ARPN Journal of Engineering and Applied Sciences, 11. 6082-6086.
AUTHORSPROFILE
Hari Krishna Kaka a postgraduate student in manufacturing engineering. His areas of interest are Operations management, Production scheduling, lean management, etc. He has worked on real-time systems to improve the overall performance of the systems. His works involve application of lean management principles, supply chain techniques, simulation, etc. He has started to venture into mathematical modelling of engineering systems.
Pachigolla Kesava Sai Srujan a postgraduate student in manufacturing engineering. His areas of research include production planning, scheduling of real-time systems, material science, lean management, etc. He has worked on industrial problems using discrete event simulation approaches, application of lean management principles and supply chain techniques, etc.
Narassima M S is a Research Scholar at Amrita School of Engineering, Coimbatore. He has researched in the area of Supply Chain, Data Analytics, Production Scheduling, Simulation, etc. He also has an industrial experience in the areas of Supply Chain, data analysis, etc. He has worked in areas such as production planning, scheduling, Discrete Event Simulation of real-time systems to improve the operational efficiency of systems, statistical analysis of industrial and organizational problems, healthcare, etc. Presently, he is inching towards engineering viewpoints on energy conservation to minimize the power consumption. He has published his works in international journals and has attended conferences.