City, University of London Institutional Repository
Citation:
Rangvid, J., Schmeling, M. & Schrimpf, A. (2014). Dividend predictability around the world. Journal of Financial and Quantitative Analysis, 49(5-6), pp. 1255-1277. doi:10.1017/S0022109014000477
This is the draft version of the paper.
This version of the publication may differ from the final published
version.
Permanent repository link:
http://openaccess.city.ac.uk/14116/Link to published version:
http://dx.doi.org/10.1017/S0022109014000477Copyright and reuse: City Research Online aims to make research
outputs of City, University of London available to a wider audience.
Copyright and Moral Rights remain with the author(s) and/or copyright
holders. URLs from City Research Online may be freely distributed and
linked to.
Dividend predictability around the world
∗Jesper Rangvid‡ Maik Schmeling∗∗ Andreas Schrimpf§
This version: October 2, 2012
∗We would like to thank an anonymous referee, Jules van Binsbergen, Long Chen, Joshua Coval, Zhi
Da, Magnus Dahlquist, Tom Engsted, Jack Favilukis, Ralph Koijen, Jochen Lawrenz, Lasse Pedersen, Tatjana Puhan, Christian Upper, Alexander Wagner, and participants at the CEPR European Summer Symposium in Financial Markets 2009, the EEA annual meeting 2010, the DGF annual meeting 2010, the VfS annual meeting 2010, the European Finance Association (EFA) meeting 2011, and seminars at Copenhagen Business School, the IE Business School, CREATES, and Rotterdam University for helpful comments. Schmeling gratefully acknowledges financial support by the German Research Foundation (DFG) and Schrimpf gratefully acknowledges support from the Danish Social Science Research Council as well as from CREATES funded by the Danish National Research Foundation when the paper was written. The paper was previously circulated under the title “Cash-flow predictability: Still going strong”. The views expressed in this paper are those of the authors and do not necessarily reflect those of the Bank for International Settlements.
‡Corresponding author. Department of Finance, Copenhagen Business School, Solbjerg Plads 3,
DK-2000 Frederiksberg, Denmark. Phone: (45) 3815 3615, fax: (45) 3815 3600, e-mail: [email protected].
∗∗Leibniz Universit¨at Hannover, K¨onigsworther Platz 1, D-30167 Hannover, Germany, and Faculty of
Finance, Cass Business School, City University London, e-mail: [email protected].
§Bank for International Settlements (BIS) and CREATES, Centralbahnplatz 2, CH-4002 Basel,
Dividend predictability around the world
Abstract
We show that dividend growth predictability by the dividend yield is the rule rather
than the exception in global equity markets. Dividend predictability is weaker,
how-ever, in large and developed markets where dividends are smoothed more, the typical
firm is large, and volatility is lower. Our findings suggest that the apparent lack of
dividend predictability in the U.S. does not uniformly extend to other countries.
Rather, cross-country patterns in dividend predictability are driven by differences in
firm characteristics and the extent to which dividends are smoothed.
JEL-Classification: G12, G15, F31
Keywords: dividend yield, predictability, dividend smoothing, international stock markets,
1
Introduction
A fundamental question in asset pricing is whether stock prices move because of news
to expected returns or news to expected dividend growth. For the aggregate U.S. stock
market, a large literature reports that news to discount rates (i.e. expected future returns)
account for the major fraction of variation in dividend yields.1 This is generally inferred
from the results of predictive regressions, which suggest that the dividend yield predicts
future returns and not dividend growth (e.g. Cochrane, 2008, 2011). However, recent
work has shown that this finding does not mean that aggregate U.S. dividend growth
rates cannot be predicted at all. For instance, Lettau and Ludvigson (2005) find that
U.S. dividend growth rates are predictable by an estimated consumption-dividends-labor
income ratio, but not by the dividend yield itself. Chen (2009) demonstrates that the
dividend yield did in fact predict aggregate U.S. dividend growth in early periods of the
industrialization but that the relationship reversed over the post-WWII period. Koijen
and van Binsbergen (2010) show that U.S. market-wide dividends are predictable by the
whole history of dividend yields in a present-value model.
We provide fresh evidence on this discussion. Instead of looking solely at U.S. data,
we study dividend predictability by the dividend yield in an international setting. This
allows us to extend and broaden the evidence on dividend predictability and to explore
new hypotheses regarding its underlying economic drivers.
1See, e.g., Campbell and Shiller (1988a,b), Campbell (1991), Cochrane (1991, 2008), Campbell and
Ammer(1993),Lettau and Ludvigson(2005),Ang and Bekaert(2007),Cochrane(2008),Cochrane(1992),
We provide three new findings. First of all, we systematically evaluate whether the
traditional finding from U.S. data – that market-wide dividends are not predictable by
the dividend yield on its own – also holds internationally. We find that it does not. This
finding is important because it affects how we understand price movements. As Cochrane
(2011) points out, evidence based on post-WWII U.S. data suggests that asset prices move
because of variation in expected returns only and that movements in expected dividends
do not matter. We find that this result does not uniformly extend to other countries.
Our findings suggest that expected dividends do move asset prices in many countries
around the world. Indeed, using a global sample of fifty stock markets over the period from
1973 to 2009, we show that market-wide dividends are highly predictable by the dividend
yield in smaller and medium-sized equity markets, but generally not in large markets
such as the U.S. To show this, we first run, country by country, traditional predictive
regressions of next-year dividend growth rates or returns on current dividend yield. We
find that in large markets, such as the U.S., dividends yields are insignificantly related
to future dividend growth rates, whereas in smaller markets, dividend yields are strongly
and significantly related to future dividend growth rates withR2s at times even exceeding
30%. Basically, our finding is that dividend growth predictability by the dividend yield
is the rule rather than the exception in international equity markets. Next, we form
two aggregate global stock portfolios, an equally-weighted (EW) and a value-weighted
(VW) portfolio of the market indices of the fifty countries in our sample. For each of
these two portfolios, we run predictive regressions of their future dividend growth rates
the equally-weighted portfolio but not predictable at all in the value-weighted portfolio.
Since the equally-weighted portfolio puts more weight on smaller markets than the
value-weighted portfolio by construction, the observed dividend growth predictability in the
equally-weighted portfolio arises because dividend growth is significantly more predictable
in countries with medium-sized or smaller equity markets compared to countries with large
market capitalization, such as the U.S.
After having documented that dividends are more predictable in countries with smaller
equity markets, we turn to possible explanations for this finding. We first investigate the
relation between dividend smoothing and dividend predictability. Chen, Da, and
Priest-ley (2012) find that dividend smoothing reduces dividend predictability because dividend
smoothing disconnects dividend payments from fluctuations in dividend yields. Based on
this argument and documenting that U.S. firms smooth dividends more today compared
to several decades ago, they offer an explanation for the finding of Chen (2009) that
div-idend growth was more predictable by the divdiv-idend yield in pre-WWII data. If this is a
valid explanation, one may expect to find a link between differences in dividend smoothing
across countries and the extent to which dividends are predictable by the dividend yield.
To verify this conjecture empirically, we show that dividends are indeed more smoothed
in large equity markets which feature less dividend predictability. Estimating a version of
the Lintner (1956) partial-adjustment model, we find that the estimated smoothing
pa-rameter is significantly higher in the value-weighted portfolio and even insignificant in the
equal-weighted portfolio. We also show that dividends react less to changes in earnings
findings confirm that dividends in large equity markets are smoothed more. Finally, we
relate smoothing to predictability and find that in those countries where dividends are
smoothed less, dividend predictability by the dividend yield is stronger.
Our third contribution is to examine the underlying factors driving these results and
to link dividend-predictability to differences in firm characteristics across countries. Our
hypotheses are motivated by two recent findings (both using U.S. data): First,Vuolteenaho
(2002) shows that dividends are highly predictable when looking at U.S. firm level data, and
that firm-level dividend predictability varies with firm size, but that aggregate market-wide
dividends are unpredictable because cash-flow predictability at the firm level is idiosyncratic
and washes out in the aggregate. Second, Leary and Michaely (2011) find that large and
mature U.S. firms and firms with stable cash-flow and return processes have a higher
tendency to smooth dividends. Based on these findings, a natural hypothesis in our global
investigation is that aggregate dividends are more difficult to predict by the dividend yield
in countries where the typical firm is large and/or has less volatile dividends and equity
returns. To analyze the relation between firm size and dividend predictability, we run panel
time-series regressions where we interact the dividend yield of the country with the size
of the typical firm in the country, measured for instance by average market capitalization.
We find strong evidence that dividend growth is less predictable in countries where the
typical firm is large. We next investigate the relation between idiosyncratic volatility (of
dividends and returns) and dividend predictability. We find that countries with more stable
(i.e. less volatile) returns and dividends feature less predictability of dividend growth by
yield are related to differences in firm characteristics across countries.
Finally, we should mention that a few papers have looked at the international
dimen-sion of dividend-growth predictability before us. For instance, in his survey, Campbell
(2003) reports dividend growth rate predictability for a few developed countries but not
for the U.S. equity market. Ang and Bekaert (2007) look at the U.S., the U.K., France,
and Germany, i.e. large equity markets, and conclude that “[...] the evidence for linear
cash-flow predictability by the dividend yield is weak and not robust across countries or
sample periods” (p. 670). A recent paper byEngsted and Pedersen(2010) investigates long
time series for four countries (U.S., U.K., Denmark, and Sweden) and shows that dividend
yields do not predict dividend growth rates in the U.K. and U.S. (i.e., large countries), but
do so in Denmark and Sweden (i.e., small countries). In relation toCampbell(2003), Ang
and Bekaert(2007), andEngsted and Pedersen(2010), we provide evidence for many more
countries, which allows us to verify systematic differences in predictability patterns across
countries. We also link dividend predictability across the globe to cross-country differences
in firm characteristics (such as firm size and cash-flow volatility) and dividend smoothing
to shed light on the mechanism driving dividend predictability by the dividend yield.
The structure of the remaining part of the paper is as follows: In the next section, we
describe our return and dividend data on international equity markets. Section3contains
the main finding of our paper, namely that dividends are more predictable by the dividend
yield in smaller capital markets. We show that dividends are smoothed more in larger
equity markets in Section4. In Section5, we show that predictability is higher in countries
size and volatility are related to dividend smoothing. Section6describes several robustness
checks and Section7 concludes.
2
Data
We analyze a total of 50 countries for which dividend yields, share prices, and total return
data are available.2 This sample covers the 32 industrialized countries as defined by the
IMF and 18 additional developing countries. We employ a quarterly frequency and the
total sample period runs from the first quarter of 1973 to the first quarter of 2009. Data
for some countries are available for the total sample period, whereas other countries enter
the sample at later points in time. We present the results from a host of robustness checks
later in the paper which verify that our main results are not affected by certain kinds of
countries being in the dataset throughout the whole sample period (mainly “advanced”
markets) and others not (mainly “emerging” markets).
We use the share price indices and total return indices from M.S.C.I. and dividends
and dividend yields from Datastream, as the available M.S.C.I data span a shorter
subpe-riod. All our results reported below are nearly unchanged when we also use returns from
Datastream, so that our results are not driven by combining the two data sources. The
advantage of using the Datastream data is that we do not have to back out dividends from
time series of total returns and price returns.3
The dividend yield in a specific equity market is calculated as the total amount of
dividends paid out by constituents of that country’s equity market index as a percentage
of the total market value of the constituents, i.e., as DYt = 100 ·
P
nDtNt/
P
nPtNt,
where DY = aggregate dividend yield on day t, Dt = dividends per share on day t, Pt =
unadjusted share price on day t, n indexes constituents, and Nt = number of constituents
of the index. The dividend yield is thus an average of the individual dividend yields of the
constituents weighted by market value where yields are calculated with trailing dividends
over the last four quarters.
Table 1 about here
Descriptive statistics for total returns, dividend growth, the average dividend yield,
and information on data availability for the individual countries are reported in Table 1,
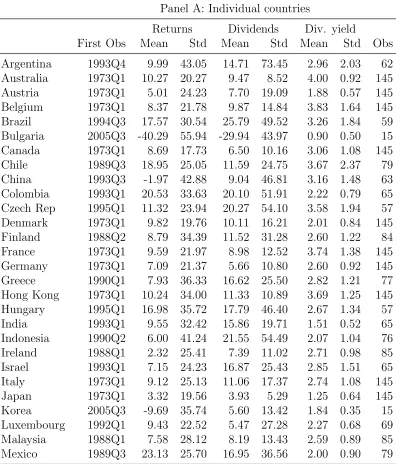
Panel A. There are large differences in the average dividend growth rates across countries.
For instance, among those countries for which we have full-sample information, we find the
highest average (annual) dividend growth rates in countries such as Denmark (10.11%),
Belgium (9.87%), and Hong Kong (11.33%), whereas the lowest average dividend growth
rates are found in Germany (5.66%), Japan (3.36%), and the U.S. (6.19%). For the
coun-tries that enter the sample at later points in time, there are very large spreads in the
average dividend growth rates, ranging from as high as 62.82% for Russia to as low as
-29.94% for Bulgaria (however, for Bulgaria, the sample is very short, too).4
For our empirical analysis below in section 3.2, we form two kinds of aggregate
port-folios from our individual country data: A value-weighted (VW) global portfolio and an
equally-weighted (EW) global portfolio. We use each market’s capitalization (at the end of
the previous quarter) as a fraction of total world-market capitalization (at the end of the
previous quarter) as weights in the VW portfolio. In other words, in the VW portfolio we
use dynamic weights, such that a market that grows in size relative to another market will
also be given a larger weight. The VW portfolio is highly dominated by large countries
such as the U.S. (roughly 40% market share on average), Japan (about 20%), or the U.K.
(roughly 10%) implying that results for the value-weighted portfolio should be expected to
closely resemble results from the earlier literature (see e.g. Ang and Bekaert, 2007, who,
as mentioned, find no clear evidence for linear cash-flow predictability in these countries).
Results for the EW portfolio, on the other hand, more closely resemble the behavior of the
bulk of smaller and medium-sized markets: In the equally-weighted portfolio, the share
given to the U.S. is only 1/15 = 6.67% in the beginning of the sample period (we have data
for 15 countries in 1973) versus 1/50 = 2% at the end of the sample period. Descriptive
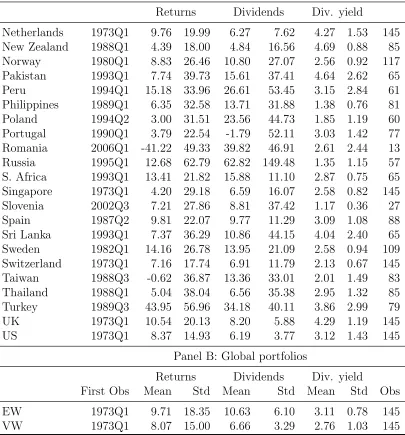
statistics are reported in Table1, Panel B. We see that the equally-weighted portfolio has
a higher standard deviation for returns and dividend growth, and a higher dividend yield
on average when compared to the value-weighted portfolio.
4We checked whether excluding countries for which we have less than 15 years of data (Brazil, Bulgaria, Czech Republic, Hungary, Korea, Romania, Russia, and Slovenia) changes our main findings; see Section
3
Dividend predictability in global equity markets
Our main question of interest is to investigate the drivers of fluctuations in equity valuations
in global capital markets. As is well-known, Campbell and Shiller (1988b,a) derive a
“dynamic Gordon formula” by log-linearizing the definition of returns:
dt−pt'const. +Et
" ∞ X
j=1
ρj−1(rt+j − 4dt+j)
#
(1)
wheredis the log of dividends, ptthe log of the stock price, rthe return, and ∆ddividend
growth. Eq. (1) shows that an increase in the dividend yield must imply that investors
have lowered their expectations about the future growth rates of dividends and/or have
raised their expectations about future returns (i.e. risk premia). Which of the two channels
(time-variation of expected dividend growth or risk premia) drives equity market valuations
is crucial for our theoretical understanding of stock markets.5 The remainder of the paper
explores empirically which of these two drivers dominates in international equity markets
and what the underlying economic drivers are.
3.1 Predictive regressions for individual countries
We first test – country-by-country – the implications of Eq. (1), i.e. whether the dividend
yield for a specific country forecasts high returns and/or low dividend growth in that
country. We run two time-series regressions of future values of dividend growth rates on
5Consider for instance the two leading paradigms for modeling equity markets, the habit formation
current dividend yields and future values of stock returns on current dividend yields:
4di,t+4 =αi,d+βi,d(di,t−pi,t) +εi,t+4 (2)
ri,t+4 =αi,r+βi,r(di,t−pi,t) +εi,t+4 (3)
where t indexes time and i refers to individual countries. In order to avoid potential
seasonality issues with the dividend growth series, we generally work with an annual, i.e.
four quarters, forecast horizon.6
In our regressions, we base our statistical inference about the regressions’ slope
coef-ficients on Newey and West (1987) HAC standard errors, Hodrick (1992) standard errors
which were found to be more reliable and accurate by Ang and Bekaert (2007), and a
moving-block bootstrap to account for potential finite sample biases (cf.Stambaugh,1999)
and moving average structure of regression errors due to overlapping observations.7
Cochrane (2008) points out that the coefficients from the predictive regressions in
Eqs. (2) and (3) are related via the definition of returns. Assuming that dividend yields
follow a first-order autoregressive process di,t+1 − pi,t+1 = αi,dp +φi(di,t −pi,t) + εi,t+1,
Cochrane(2008) shows that the coefficients are related as βi,r= 1−ρiφi+βi,d, where ρi is
a linearization constant which is close to one. Dividing with (1−ρiφi) on both sides, the
6We also checked our results for shorter forecast horizons of 1,2,and 3 quarters. In these (unreported)
estimations, we found very similar predictability results as for the annual forecast horizon reported below. We do not report these results to rule out any any seasonality issues.
implied restriction of the long-run coefficients is 1 = blrr −blrd, where bi,rlr =βi,r/(1−ρiφi)
and blr
i,d = βi,d/(1−ρiφi). Cochrane (2008) shows that – in the same spirit as a variance
decomposition – the long-run coefficientblr
r measures the fraction of dividend-yield variation
due to long-run movements in expected future returns while blrd measures the fraction of
variation due to long-run movements in expected dividend growth rates.
In Table2, we show the results from the regressions for those countries where we have
more than 10 years of quarterly data. In the table, we highlight the estimated coefficients
(βr and βd) that are significant according to Newey and West (1987) standard errors in
bold.8 We also show t-statistics based on moving-block bootstrapped standard errors, the
R2s from the regressions, and the long-run coefficients blrr and blrd. Furthermore, we also
report the share of unexpected return variation due to revisions in expected stock returns
(V(ηr)) and revisions in expected dividends (V(ηd)) based on the standard decomposition
of unexpected stock returnsrt+1−Et[rt+1] into news about future expected returnsηr,t+1,
and news about future expected dividends ηd,t+1 fromCampbell (1991):
ηr,t+1 = Et+1
Σ∞j=1ρjrt+1+j
−Et
Σ∞j=1ρjrt+1+j
(4)
ηd,t+1 = Et+1
Σ∞j=1ρj∆dt+1+j
−Et
Σ∞j=1ρj∆dt+1+j
(5)
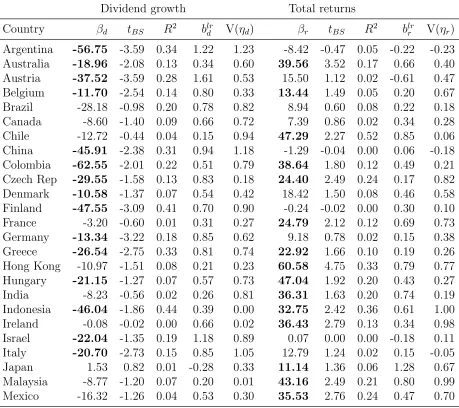
The results reported in Table 2 show that predictability of dividend growth by the
dividend yield is a ubiquitous phenomenon in international equity markets. To explain
the results in detail, consider first a relatively small market, such as the first country in
the table, Argentina. The predictive coefficientβd from the dividend growth regression is
large in absolute terms, highly significant using both Newey-West and block bootstrapped
t-statistics, and of the negative sign a-priori expected from the Campbell/Shiller
decompo-sition. The R2 of the predictive regression is large and around 34%. Almost all variation
in the dividend yield can be accounted for by long-run movements in expected dividend
growth rates as measured by the estimatedblr
d coefficient. In other words, dividend growth
is highly predictable by the dividend yield in Argentina and changing expectations about
dividend growth account for the largest fraction of dividend yield variation. Consider then
the results from the return predictability regression. In Argentina, returns are not
signif-icantly related to fluctuations in dividend yields. The estimate of βr is insignificant, the
R2 is low, and the long-run coefficient blrr is low, too. All in all, dividend growth is highly
predictable by the dvidend yield in Argentina whereas returns are not.
Table 2 about here
Results for other smaller and medium-sized markets generally speak a similar language.
As one further example, consider another small country for which full-sample information
is available, the third country in the table Austria. The conclusion for Austria is exactly
the same as for Argentina: Dividend growth is highly predictable by the dividend yield,
whereas returns are not predictable. The broad picture of Table2allows for the conclusion
that in global equity markets the largest fraction of the variation in dividend yields can
be accounted for by changes in expectations about future dividend growth rather than
changes in expected returns. In fact, only in 15 markets out of the 50 markets studied
in this paper do changes in expected returns explain a larger fraction of the variance of
dividend yields, i.e. does the estimated blr
markets worldwide, news about future dividends clearly dominate as the main drivers
of equity market valuations. These results run counter to the general impression in the
literature, based on U.S. data, that the dominant driver of equity market valuations is
variation of expected returns and not variation of expected future dividend growth (e.g.
Cochrane, 2008,2011).
Interestingly, those countries where dividend growth rates are not/less predictable are
mainly large countries. To illustrate, consider the U.S. capital market, which is in fact
the largest market in the sample. Table 2 shows that U.S. dividend growth rates are not
significantly predictable by the dividend yield. The fraction of variation in dividend yields
due to changes in expectations about long-run dividend growth rates is small. On the other
hand, returns are predictable by dividend yields (even if only marginally significant using
block bootstrap standard errors), and basically all of the variation in the dividend yield is
attributable to long-run variation in expected returns. Hence, the results we report here for
the U.S. are like those one is used to see from the U.S. based literature (see e.g.Cochrane,
2008; Chen,2009, taking into account that we have 1973-2009 data at our disposal here).
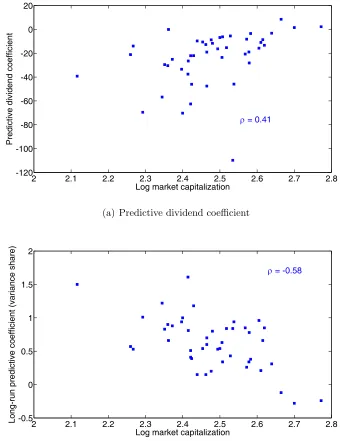
To provide a more general picture of the relation between the size of the country’s
equity market and dividend growth predictability, we show in Figure1 scatterplots of the
relation between the estimated predictive coefficient βd and market size (Panel a) and
between the long-run coefficients blrd and market size (Panel b). Market size is calculated
as the U.S. dollar value of the country’s aggregate stock market at the end of the sample
period. The point we want to make here is that dividend growth rates are more predictable
the size of the predictive coefficients (as the predictive coefficients are negative) in Panel (a)
of the Figure: The smaller the country in terms of market capitalization, the more negative
the predictive coefficient (i.e. the more predictable is dividend growth by the dividend
yield). This is indeed what the graph reveals: the correlation between the estimated
coefficients and log market capitalization is 0.41 and significant. In other words, Panel (a)
shows that the estimated predictive coefficient tends to be closer to zero when the market
in question is larger. Turning to Panel (b), we would expect to see a negative relation
between market size and blr
d if dividend growth is more predictable in smaller markets, as
blr
d measures the fraction of dividend yield variation due to long-run fluctuations in expected
dividend growth. This is what we find. Indeed, we see a negative relation between market
size and blr
d with a correlation coefficient of −0.58. In other words, the larger the market,
the closer to zero is blr
d. As illustrated by these two graphs in Figure 1, dividend growth
is generally highly predictable by the dividend yield in smaller and medium-sized capital
markets, but less so in larger equity markets.9
Figure 1 about here
3.2 Predictive regressions for global portfolios
As our next step, we turn to dividend and return predictability using our equal- (EW) and
value-weighted (VW) portfolios described in Section 2. The advantage of using the EW
and VW portfolios is that we can make some general statistical judgements about dividend
growth predictability in small and large markets. The regressions we run are:
4dt+h =α (h) d +β
(h)
d (dt−pt) +ε (h)
t+h (6)
rt+h =α(rh)+βr(h)(dt−pt) +ε (h)
t+h, (7)
i.e. compared to Eqs. (2) and (3) there are no subscriptsias we work on the portfolio level
including all countries. On the other hand, we now show results for different forecast
hori-zons h, i.e. h = 4, 8, 12, and 16 quarters. We also report the share of unexpected returns
variation due to changes in expected returns, V(ηr), and dividends, V(ηd), respectively, as
in Table2 above.10
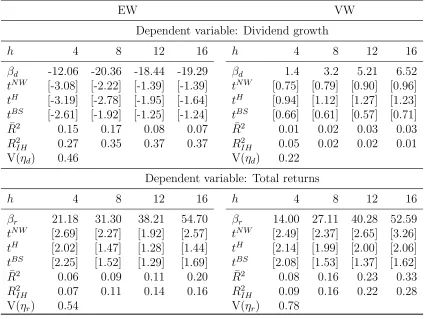
The results are reported in Table3. Consider the annual (h= 4) predictive regressions
first. The evidence is summarized by:
VW: ∆dt+4 = constant + 1.40
[0.75](dt−pt) R 2
= 0.01
EW: ∆dt+4 = constant−12.06
[−3.08](dt−pt) R 2
= 0.15,
where the numbers in brackets below the coefficient estimates are Newey-West HAC based
t-statistics. The results are clear-cut: When we use value-weights (VW), we cannot reject
that the predictive coefficient is zero and dividends consequently unpredictable by the
dividend yield. There is clear evidence of dividend growth predictability, however, in case
of the equal weighted portfolio (EW). The extent to which the dividend yield of the EW
portfolio predicts future dividend growth rates is noteworthy with an R2 of around 15%.
10These variance shares are obtained from estimating a VAR(1) which is based on an annual frequency
By construction, the strong difference between the results using the value-weighted and
the equally-weighted portfolio is due to larger weights given to the smaller markets in the
equally-weighted portfolio. Hence, confirming the results from the previous sub-section,
there is significant evidence for cash-flow predictability by the dividend yield. This is not
the case for very large markets such as the U.S., but for the vast majority of equity markets
worldwide, mostly medium-sized and smaller markets.
Table 3 about here
This conclusion is supported by the variance shares. The share of unexpected return
variation due to changes in expected dividends is higher in the equally-weighted portfolio
(0.44) compared to the value-weighted portfolio (0.22). We also see that the share due to
return variation is higher in the value-weighted portfolio (0.78) compared to its value for
the equally-weighted portfolio (0.54).
When we increase the horizon over which we measure dividend growth (increase h),
we see from Table 3that the associated t-statistics tend to decline.11 Hence, the dividend
predictability we document in the equally-weighted portfolio is large at the shorter horizons,
and stays large and significant up to two years out. Regardless of the horizon, dividend
growth is not predictable in the value-weighted portfolio.
It seems interesting that the predictability of dividend growth remains significant
after aggregating each individual country into a global portfolio. Chen, Da, and Zhao
(2012) argue that it does not seem to be a diversification effect that drives out
dividend-11In the table, we also reportR2s implied by a VAR(1) (denotedR2
growth predictability when moving from the firm-level to the aggregate level as reported
byVuolteenaho(2002). We also find that dividend predictability does not wash out in the
aggregate: Both indexes we study are highly diversified, but evidence for dividend growth
predictability is strongest when larger markets receive less weight, as in case of the global
equally-weighted portfolio.
Annual returns seem to be predictable both in the equally-weighted and the
value-weighted portfolios. Our findings for the value-value-weighted portfolio thus reflect the findings
in the literature that uses U.S. data: Dividend growth rates are not predictable by the
dividend yield, whereas returns are. When predicting long-horizon returns, the statistical
significance of our results depends on the choice of standard errors: The bootstrap standard
errors are much larger than Newey-West standard errors in the return regressions due to the
fact that we are dealing with relatively few observations here such that finite-sample biases
(Stambaugh,1999) become relevant. In fact, long-horizon returns seem to be predictable in
both the equal- and the value-weighted portfolios when judged via Newey-West or Hodrick
t-statistics, but predictive coefficients are insignificant when judged via block-bootstrapped
t-statistics.12
All in all, we have shown thus far that dividends are strongly predictable by dividend
yields in equity markets worldwide and that predictability is more pronounced in smaller
markets. The remainder of the paper explores which economic drivers may account for this
result.
4
Dividend predictability and dividend smoothing
In this section, we show that dividends are smoother in larger and more mature equity
markets. This is important because dividend smoothing makes dividends more difficult
to predict by the dividend yield as dividend fluctuations might get disconnected from
movements in the dividend yield.13 Hence, if dividends by firms are more smoothed in
countries with large equity markets, dividends will also be difficult to predict in these
markets. To show this, we proceed in two steps. We first show that dividends are indeed
smoother in countries with large equity markets. Afterwards, we directly explore the
relation between dividend smoothing and the strength of dividend growth predictability.
We use the equal- and value-weighted portfolios to show that dividend smoothing is
higher in countries with larger market capitalization. Our analysis is based on theLintner
(1956) partial-adjustment model:
∆Dt=β0+β1∆Et+β2∆Dt−1+εt, (8)
where ∆Dt is the annual change in the level of dividends and ∆Et the annual change
in earnings. In this model, 1−β2 measures the speed of adjustment towards the
long-run target dividend payout ratio that Lintner assumed managers partially adjust towards.
Hence, β2 measures the degree of smoothing.14 The results are:
EW: ∆Dt= 4.25
[2.40]+ 0[4..4268]∆Et+ 0[1..1956]∆Dt−1 R
2 = 0.40
VW: ∆Dt= 2.16
[2.28]+ 0[4..2438]∆Et+ 0[3..4044]∆Dt−1 R
2 = 0.47,
where the numbers in brackets below coefficient estimates are Newey-West t-statistics.
We thus find that the smoothing parameter is significant in the value-weighted portfolio
where larger countries dominate. We also find that we cannot reject that dividends are not
smoothed (the smoothing parameter is not statistically different from zero) in the
equally-weighted portfolio where smaller countries get a larger weight. Equally interesting, the
results show that dividends respond more to earnings in smaller countries, as seen through
the larger coefficient to ∆Et in the equally-weighted portfolio. When earnings increase,
dividends co-move to a larger extent in case of the EW portfolio compared to the VW
portfolio, suggesting that dividends are smoothed more in larger markets. In fact, a simple
test for equality of theβ coefficients in the two regressions leads us to reject equality of the
β1s with a p-value of 0.037 and to marginally reject equality of the β2s with a p-value of
0.082. This suggests that dividends co-move significantly more with earnings and are more
smoothed in the equally-weighted portfolio compared to the value-weighted portfolio.
An additional way of seeing this is by directly looking at the ratio between volatility
14Lintner specified his original model with the explanatory variables in levels (i.e. using E
of earnings and dividends:
S =σ(∆d)/σ(∆e), (9)
where S is defined as the “smoothing parameter” as in Chen, Da, and Priestley (2012).
Note that a higher value of S means less smoothing since dividend growth is more volatile
relative to earnings growth for higher values of S. If dividends are smooth in relation to
earnings,σ(∆d) is low relative toσ(∆e) andSis consequently small. We find thatS= 0.92
for the EW portfolio and S = 0.64 for the value-weighted portfolio, again indicating that
dividends are more smoothed in countries with larger equity markets.
Finally, we investigate the direct relation between the extent to which dividends are
smoothed and how strongly they are predictable by the dividend yield. To do so, we regress
the predictive R2 from the individual-country dividend predictability regressions in Table
2 on the smoothing parameter in a simple cross-sectional regression (with White (1980)
standard errors), i.e. we estimate:
R2∆d,i =α+βSi+εi. (10)
We obtain an estimate of β equal to 0.11 with a t-statistic of 2.32 and a R2 of 12%,
that is, there exists a positive relation between the smoothing parameter and
predictabil-ity of dividends across countries: In those countries where there is less smoothing (i.e.
high volatility of dividends relative to the volatility of earnings), predictability of dividend
growth by the dividend yield is stronger.15These are generally countries with smaller equity
15We acknowledge that the predictiveR2 is measured with error. For this reason, we interpret these
markets.
5
Dividend predictability and firm characteristics
So far, we have shown that dividends are more predictable in smaller countries and that
dividends are less smooth in these countries, too. But what economic mechanism drives
these empirical patterns? Dividend policies are the results of decisions taken by individual
firms, so why are the dividends of firms in smaller countries less smooth and more
pre-dictable by the dividend yield? Motivated by the results inLeary and Michaely(2011) that
large and mature U.S. firms and U.S. firms with less volatile cash flows tend to smooth
dividends more, we investigate two hypotheses in this section: Whether (i) dividends are
more predictable in smaller markets since the typical firm in these countries is smaller
(if small firms smooth less, as Leary and Michaely (2011) document for the U.S., their
dividends might be more predictable), and whether (ii) dividends are more predictable in
smaller markets since the volatility of firms’ dividends or returns is higher in smaller equity
markets.16
5.1 Firm size and dividend predictability
We use two measures of firm size in a country to investigate whether differences in firm size
(via the link to dividend smoothing) can explain the differences in dividend predictability
across countries: the average size of firms in the country and – in order to capture the
size of the right tail of the firm size distribution – the 90% quantile of the country’s
firm-size distribution. To calculate the average size of firms in a country, we divide a
country’s total stock market capitalization (converted to USD) by the number of firms
in the country. To calculate the 90% quantile of the country’s firm-size distribution, we
calculate the 90% quantile of the cross-sectional firm size distribution of all available firms’
market capitalizations (in USD) in a given country in a given quarter. The latter measure is
used since it is robust to extreme outliers and better captures the firm size of the top decile
of companies in a country. This could be potentially important since large firms usually
account for the bulk of dividend payments, at least in the U.S. (DeAngelo, DeAngelo, and
Skinner,2004). Finally, since market capitalizations are growing more or less steadily over
time we deflate both firm size measures in each quarter by the cross-sectional average (log
deviations). Hence, for each country and each quarter, our firm size proxies are capturing
the percentage deviation from the average value of all countries.
To test whether dividend growth is more predictable in countries where the typical firm
is relatively small, we run fixed-effects, unbalanced predictive panel regressions based on
all countries and observations. We extend the setup with an interaction term between firm
size in countryi, F Si (whereF Si thus represents either the average market capitalization
the dividend yield in country i:
4di,t+h =α (h) i,d +β
(h)
d (di,t−pi,t) +β (h)
size,d(di,t−pi,t)F Si,t+ε (h)
i,t+h (11)
ri,t+h =α (h) i,r +β
(h)
r (di,t−pi,t) +β (h)
size,r(di,t−pi,t)F Si,t+ε (h)
i,t+h, (12)
whereiindexes countries and βsize measures how the interaction term affects the left-hand
side variables. As outlined in Section 3.2, we expect dividend yields to forecast dividend
growth with a negative sign. Hence, if firm size is associated with less strong dividend
predictability, we would expect βsize,d(h) to be positive.
We show the results in Table4.17 Panel A shows results where we use the average firm
size as the measure of the size of the typical firm in the country (interaction coefficient
labeledβf size), and Panel B shows results from using the 90% quantile of the firm-size
dis-tribution within a country (interaction coefficient labeledβq90). Regardless of the measure
of the typical size of a firm in a country, the results are clear cut: Firm size has a positive
impact on the predictive coefficient, i.e. the larger is the typical firm in a country, the closer
to zero is the predictive impact of dividend yields on future dividend growth rates (i.e. the
less strong is dividend predictability). We also see that the interaction term is statistically
significant for forecast horizons of up to h= 12 using Newey-West based t-statistics.
Table 4 about here
In contrast to the clear effect of firm size on dividend predictability, the effect of firm
size on return predictability is less clear. There are two possible reasons for this. First,
Chen, Da, and Priestley (2012) show theoretically and using simulations that the effect of
dividend smoothing on return predictability is unclear (in contrast to the negative effect of
dividend smoothing on dividend predictability) making it difficult to establish a clear link
between firm size and return predictability. Second, and given our findings from Tables
2 and 3, as returns are predictable in both large and small countries, it is also not too
surprising that we do not find a clear effect of firm size on return predictability.
5.2 Volatility and dividend predictability
The next question we deal with is whether dividends are more predictable in markets
populated by firms whose volatility of fundamentals and returns is high. These tests again
draw on the finding documented byLeary and Michaely(2011) that young and less stable
firms tend to smooth their dividends less. If dividend smoothing matters for the extent
to which dividend growth is predictable by the dividend yield as argued in Chen, Da, and
Priestley (2012), one would expect to find stronger evidence for dividend predictability in
markets dominated by firms with more volatile fundamentals and returns.
We use three measures of volatility: raw dividend volatility, idiosyncratic dividend
volatility, and idiosyncratic return volatility. Raw dividend volatility is computed as the
sum of absolute quarterly log changes of dividends over the last year, while idiosyncratic
dividend volatility is calculated from a regression of each country’s log dividend growth on
the aggregate, global dividend growth rate, and then summing the absolute residuals over
country’s total market return on the aggregate, global stock return, and then summing the
absolute residuals over the last four quarters. We include idiosyncratic return volatility
here to capture the general information environment of a market and since it has been
shown to be related to the volatility of fundamental cash-flows (see Irvine and Pontiff,
2009, on the latter point).
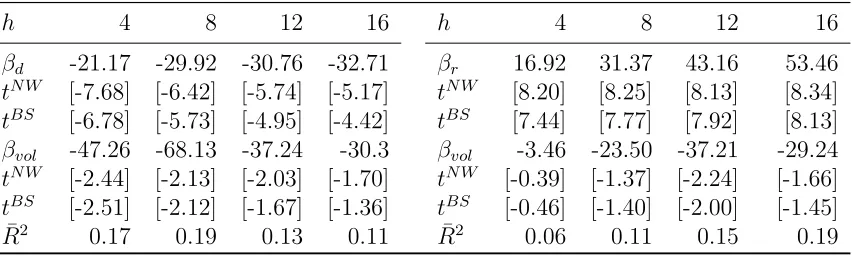
In Table 5, we present the results from predictive panel regressions (for returns and
dividends) where we interact dividend yields with one of the measures of dividend volatility
or return volatility, respectively. If dividend growth predictability is stronger in equity
markets populated by firms with higher volatility of fundamentals and equity returns, we
would expect a negative sign to the interaction term, as this implies an even stronger
predictive effect of the dividend yield for future dividend growth in countries with higher
volatility.
Our results clearly indicate that dividend growth rates are more predictable by
div-idend yields in countries where volatility of firms’ returns and cash flows is higher. For
returns, on the other hand, there is generally no relation between volatility and return
predictability. Hence, both the typical size of a firm in a country (Table 4) and volatility
(Table 5) affect dividend predictability, but not return predictability.
Table 5 about here
To shed some more light on the relative importance of dividend versus return volatility
for dividend predictability, we regress Cochrane’s long-run dividend betas (from Table
2) on one of our measures of dividend and return volatility and average firm size. As
that in (unreported) regressions, all three measures of volatility are significant even when
controlling for average firm size, but - importantly - when including both idiosyncratic
return volatility and one of the two dividend volatility measures in the regression, dividend
volatility always drives out return volatility. Hence, based on this admittedly simple test,
dividend volatility seems to be more important than return volatility in explaining the
cross-country patterns.
5.3 Firm characteristics and smoothing
We have shown in Section3that dividends are more predictable in smaller equity markets.
We have also shown in Section 4that dividends are less smoothed in smaller markets. In
addition, we have shown that dividends are more predictable in countries where the typical
firm is small and uncertainty is high. These are exactly the characteristics of firms that
tend to smooth their dividends less, as shown empirically by Leary and Michaely (2011)
for U.S. firms.
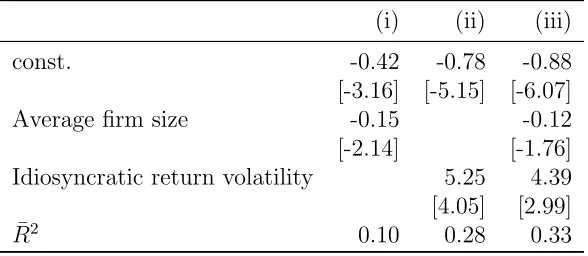
Now we close the circle and deal with the question of whether dividends are more
smooth in those countries where the typical firm is small and volatility is large. To do so, we
calculate the smoothing parameterSi =σi(∆di)/σi(∆ei) for each countryiand regress the
smoothing parameter on the typical size of the firm in a country in a simple cross-sectional
regression (withWhite(1980) standard errors which are robust to heteroscedasticity). We
employ average firm size here but using the 90% quantile measure yields very similar results.
We also run the same regression with volatility instead of average firm size. We employ
between our explanatory variable and the dependent variable which clearly depends on
(raw) dividend volatility itself.
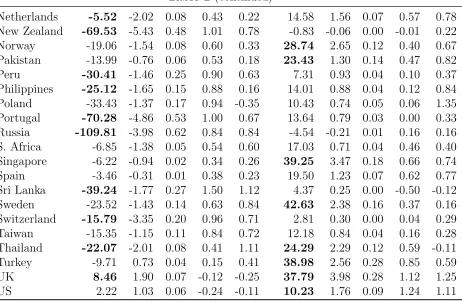
Table 6 about here
The results are shown in Table6. We find that dividend smoothing is more pronounced
in countries with larger typical firm size and lower idiosyncratic return volatility. The fact
that we find less dividend predictability by the dividend yield in countries populated by
large and stable firms, and that smoothing is related to dividend predictability, extends
and lends further support to the results in Chen, Da, and Priestley (2012) andLeary and
Michaely(2011).
6
Robustness
We have tested whether our results are robust along several different dimensions. In this
section, we briefly indicate what we have done as well as the main findings.
First of all, we took special care in evaluating the robustness of our results with respect
to special kinds of countries. For instance, we excluded the U.K. and the U.S. from the
equal- and value- weighted portfolios and ran the regressions in Table 3 in order to see
whether these two very large common law countries drive our results. We found that even
after excluding the U.K. and the U.S., there is still more dividend predictability in the EW
portfolio.18
Second, we check whether our results are driven by recently added small emerging
markets. They are not. To verify this, we conduct our time-series regressions using a
dataset consisting exclusively of countries for which we have more than 15 years of data.
The main result from these exercises is that dividends are more predictable in the EW
portfolio than in the VW portfolio, but the results are naturally somewhat less pronounced
than the ones reported in the paper itself, as a result of the reduction in number of countries
included in these tests. We also took a second approach to this issue: Instead of excluding
countries for which we only have less than 15 years of data, we investigate what happens
if we run the regression over a period where we have data for basically all countries. For
instance, if we start the analysis in 1995, we have data for all 50 countries except Bulgaria,
South Korea, Rumania, and Slovenia. Of course, when using data from 1995 and onwards,
we have much fewer observations if running our regressions for the EW and VW portfolio,
so we run a panel-regression instead. In this panel-regression, we add an interaction term
between the size of the equity market in the country and the dividend yield. We found
results as above, i.e. more predictability in small markets, although the results are not as
strong as those in the paper itself which is probably due to the short sample period.
We have focused on regression results in this paper. In order to evaluate the economic
importance of our findings more directly, and to derive the results using other methods
than univariate time-series regressions, we sorted countries into five portfolios based on
their (lagged) dividend yields (see Cochrane, 2011, for a discussion of how results from
portfolio sorts relate to results from predictive regressions). In these (unreported) tests we
dividend yield for dividend growth across countries as well.
7
Conclusion
The common finding in the literature is that dividend yields do not predict dividend growth
rates in the standard predictive regression setting based on U.S. aggregate data post-war
data. We show that the picture painted by U.S. data changes quite a bit when using
ag-gregate data from other countries worldwide. Indeed, we show that dividend growth
pre-dictability accounts for a sizeable fraction of dividend yield variability in the vast majority
of countries outside the United States. Dividend growth predictability by the dividend yield
is most pronounced in countries with smaller and medium-sized market capitalization.
To explain these findings, we show that dividends are more predictable in countries
where the typical firm is smaller and returns and dividends are more volatile. We also show
that dividends are less smooth in such markets. We note that dividend smoothing reduces
dividend predictability because it breaks the link between fluctuations in the dividend yield
and future dividends (as shown in Chen, Da, and Priestley, 2012). The extent to which
firms in different markets smooth dividends thus emerges as a key mechanism that may
explain why the dividend yield does predict dividend growth in the majority of countries
worldwide (typically smaller and medium-sized markets) but does not predict dividend
growth in some other important countries (typically large markets such as the U.S.).
Taken together, our findings indicate that the apparent lack of dividend predictability
in the U.S. does not, in general, extend to other countries. Rather, dividends are in general
countries. These results suggest that aspects such as cross-country differences in firm
characteristics and dividend smoothing also matter for aggregate asset pricing phenomena
such as dividend growth predictability by the dividend yield.
Our main contribution in this paper has been to extend upon the U.S.-based literature
that relates dividend yield fluctuations to dividend growth rate news. An interesting
ques-tion for future research would be to extend this research by exploring the predictability of
measures of total cash-flows (i.e. including share repurchases) instead of dividends only.
Using U.S. data, Chen, Da, and Priestley (2012) show that expectations of future
cash-flow fluctuations, as opposed to dividend growth fluctuations that might be influenced by
dividend smoothing, account for a larger fraction of dividend yield fluctuations than
expec-tations of dividend growth rate fluctuations. Hence, it would be interesting to see whether
the findings ofChen, Da, and Priestley(2012) extend to an international setting with a rich
cross-country dimension. To do so, however, one needs international time-series data on
share repurchases in many countries spanning sufficiently long periods of time. Collecting
such data and testing whether alternative measures of cash flow news perhaps account for
even larger fractions of dividend yield fluctuations than reported in this paper seems to be
References
Ang, A., 2002, “Characterizing the Ability of Dividend Yields to Predict Future Dividends in Log-Linear Present Value Models,” Working Paper, Columbia University.
Ang, A., and G. Bekaert, 2007, “Stock Return Predictability: Is it there?,” Review of Financial Studies, 20(3), 651–707.
Bansal, R., and A. Yaron, 2004, “Risks for the Long Run: A Potential Resolution of Asset Pricing Puzzles,”Journal of Finance, 59(4), 1481–1509.
Campbell, J. Y., 1991, “A Variance Decomposition for Stock Returns,”Economic Journal, 101, 157–179.
, 2003, “Consumption-Based Asset Pricing,” in Handbook of the Economics of Fi-nance, ed. by G. Constantinides, M. Harris, and R. Stulz. Amsterdam: North Holland, vol. IB, chap. 13, pp. 803–887.
Campbell, J. Y., and J. Ammer, 1993, “What Moves the Stock and Bond Markets? A Variance Decomposition for Long-Term Asset Returns,”Journal of Finance, 48, 3–37.
Campbell, J. Y., and J. H. Cochrane, 1999, “By Force of Habit: A Consumption Based Explanation of Aggregate Stock Market Behavior,”Journal of Political Economy, 107(2), 205–251.
Campbell, J. Y., and R. J. Shiller, 1988a, “The Dividend-Price Ratio and Expectations of Future Dividends and Discount Factors,”Review of Financial Studies, 1(3), 195–228.
, 1988b, “Stock Prices, Earnings, and Expected Dividends,” Journal of Finance, 43(3), 661–676.
Campbell, J. Y., and S. B. Thompson, 2008, “Predicting the Equity Premium Out of Sample: Can Anything Beat the Historical Average?,”Review of Financial Studies, 21, 1509–1531.
Chen, L., 2009, “On the Reversal of Return and Dividend Growth Predictability: A Tale of Two Periods,”Journal of Financial Economics, 92, 128–151.
Chen, L., Z. Da, and R. Priestley, 2012, “Dividend Smoothing and Predictability,” Man-agement Science, forthcoming.
Cochrane, J. H., 1991, “Volatility Tests and Efficient Markets: Review Essay,”Journal of Monetary Economics, 27(3), 463–485.
, 1992, “Explaining the Variance of Price-Dividend Ratios,”The Review of Financial Studies, 5(2), 243–280.
, 2008, “The Dog That Did Not Bark: A Defense of Return Predictability,”Review of Financial Studies, 21, 1533–1575.
, 2011, “Discount Rates,”Journal of Finance, 66, 1047–1108.
DeAngelo, H., L. DeAngelo, and D. J. Skinner, 2004, “Are Dividends Disappearing? Divi-dend Concentration and the Consolidation of Earnings,”Journal of Financial Economics, 72, 425–456.
Engsted, T., and T. Q. Pedersen, 2010, “The Dividend-Price Ratio does predict Dividend Growth: International Evidence,”Journal of Empirical Finance, 17, 585–605.
Goyal, A., and I. Welch, 2003, “Predicting the Equity Premium with Dividend Ratios,”
Management Science, 49, 639–654.
Hodrick, R. J., 1992, “Dividend Yields and Expected Stock Returns: Alternative Proce-dures for Inference and Measurement,”Review of Financial Studies, 5(3), 357–386.
Irvine, P. J., and J. Pontiff, 2009, “Idiosyncratic Return Volatility, Cash Flows, and Product Market Competition,”Review of Financial Studies, 22, 1149–1177.
Koijen, R., and J. H. van Binsbergen, 2010, “Predictive Regressions: A Present-Value Approach,”Journal of Finance, 65, 1439–1471.
Larrain, B., and M. Yogo, 2008, “Does Firm Value Move too Much to be Justified by Subsequent Changes in Cash Flow?,”Journal of Financial Economics, 87, 200–226.
Leary, M. T., and R. Michaely, 2011, “Determinants of Dividend Smoothing: Empirical Evidence,”Review of Financial Studies, 24, 3179–3249.
Lettau, M., and S. C. Ludvigson, 2005, “Expected Returns and Expected Dividend Growth,”Journal of Financial Economics, 76(3), 583–626.
Lewellen, J., 2004, “Predicting Returns with Financial Ratios,”Journal of Financial Eco-nomics, 74(2), 209–235.
Newey, W. K., and K. D. West, 1987, “A Simple, Positive Semi-Definite, Heteroskedasticity and Autocorrelation Consistent Covariance Matrix,”Econometrica, 55(3), 703–708.
Stambaugh, R. F., 1999, “Predictive Regressions,” Journal of Financial Economics, 54, 375–421.
Vuolteenaho, T., 2002, “What Drives Firm-Level Stock Returns?,”Journal of Finance, 57, 233–264.
Table 1: Descriptive statistics
This table shows descriptive statistics for all 50 countries in our sample (Panel A) and for an equal- as well as a value-weighted portfolio of these countries (Panel B). The second column shows the date of the first observation in our sample, the next six columns show means and standard deviations of annualized (log) returns (total returns), (log) dividend growth, and the dividend yield. The final column reports the number of available quarterly observations.
Panel A: Individual countries
Returns Dividends Div. yield
First Obs Mean Std Mean Std Mean Std Obs
Argentina 1993Q4 9.99 43.05 14.71 73.45 2.96 2.03 62 Australia 1973Q1 10.27 20.27 9.47 8.52 4.00 0.92 145 Austria 1973Q1 5.01 24.23 7.70 19.09 1.88 0.57 145 Belgium 1973Q1 8.37 21.78 9.87 14.84 3.83 1.64 145 Brazil 1994Q3 17.57 30.54 25.79 49.52 3.26 1.84 59 Bulgaria 2005Q3 -40.29 55.94 -29.94 43.97 0.90 0.50 15 Canada 1973Q1 8.69 17.73 6.50 10.16 3.06 1.08 145 Chile 1989Q3 18.95 25.05 11.59 24.75 3.67 2.37 79 China 1993Q3 -1.97 42.88 9.04 46.81 3.16 1.48 63 Colombia 1993Q1 20.53 33.63 20.10 51.91 2.22 0.79 65 Czech Rep 1995Q1 11.32 23.94 20.27 54.10 3.58 1.94 57 Denmark 1973Q1 9.82 19.76 10.11 16.21 2.01 0.84 145 Finland 1988Q2 8.79 34.39 11.52 31.28 2.60 1.22 84 France 1973Q1 9.59 21.97 8.98 12.52 3.74 1.38 145 Germany 1973Q1 7.09 21.37 5.66 10.80 2.60 0.92 145 Greece 1990Q1 7.93 36.33 16.62 25.50 2.82 1.21 77 Hong Kong 1973Q1 10.24 34.00 11.33 10.89 3.69 1.25 145 Hungary 1995Q1 16.98 35.72 17.79 46.40 2.67 1.34 57 India 1993Q1 9.55 32.42 15.86 19.71 1.51 0.52 65 Indonesia 1990Q2 6.00 41.24 21.55 54.49 2.07 1.04 76 Ireland 1988Q1 2.32 25.41 7.39 11.02 2.71 0.98 85 Israel 1993Q1 7.15 24.23 16.87 25.43 2.85 1.51 65 Italy 1973Q1 9.12 25.13 11.06 17.37 2.74 1.08 145 Japan 1973Q1 3.32 19.56 3.93 5.29 1.25 0.64 145 Korea 2005Q3 -9.69 35.74 5.60 13.42 1.84 0.35 15 Luxembourg 1992Q1 9.43 22.52 5.47 27.28 2.27 0.68 69 Malaysia 1988Q1 7.58 28.12 8.19 13.43 2.59 0.89 85 Mexico 1989Q3 23.13 25.70 16.95 36.56 2.00 0.90 79
Table 1 (continued)
Returns Dividends Div. yield
Netherlands 1973Q1 9.76 19.99 6.27 7.62 4.27 1.53 145 New Zealand 1988Q1 4.39 18.00 4.84 16.56 4.69 0.88 85 Norway 1980Q1 8.83 26.46 10.80 27.07 2.56 0.92 117 Pakistan 1993Q1 7.74 39.73 15.61 37.41 4.64 2.62 65 Peru 1994Q1 15.18 33.96 26.61 53.45 3.15 2.84 61 Philippines 1989Q1 6.35 32.58 13.71 31.88 1.38 0.76 81 Poland 1994Q2 3.00 31.51 23.56 44.73 1.85 1.19 60 Portugal 1990Q1 3.79 22.54 -1.79 52.11 3.03 1.42 77 Romania 2006Q1 -41.22 49.33 39.82 46.91 2.61 2.44 13 Russia 1995Q1 12.68 62.79 62.82 149.48 1.35 1.15 57 S. Africa 1993Q1 13.41 21.82 15.88 11.10 2.87 0.75 65 Singapore 1973Q1 4.20 29.18 6.59 16.07 2.58 0.82 145 Slovenia 2002Q3 7.21 27.86 8.81 37.42 1.17 0.36 27 Spain 1987Q2 9.81 22.07 9.77 11.29 3.09 1.08 88 Sri Lanka 1993Q1 7.37 36.29 10.86 44.15 4.04 2.40 65 Sweden 1982Q1 14.16 26.78 13.95 21.09 2.58 0.94 109 Switzerland 1973Q1 7.16 17.74 6.91 11.79 2.13 0.67 145 Taiwan 1988Q3 -0.62 36.87 13.36 33.01 2.01 1.49 83 Thailand 1988Q1 5.04 38.04 6.56 35.38 2.95 1.32 85 Turkey 1989Q3 43.95 56.96 34.18 40.11 3.86 2.99 79 UK 1973Q1 10.54 20.13 8.20 5.88 4.29 1.19 145 US 1973Q1 8.37 14.93 6.19 3.77 3.12 1.43 145
Panel B: Global portfolios
Returns Dividends Div. yield
First Obs Mean Std Mean Std Mean Std Obs
Table 2: Predictive regressions for individual countries
This table shows results for predictive regressions of dividend growth (left panel) and total returns (right panel) on the log dividend yield for each individual country in our sample that has at least 10 years of data. The forecast horizon is four quarters. A predictive coeffi-cient (βd,βr) is highlighted in bold when the absolutet-stat (Newey/West HAC) indicates
significance at the 5% level or better. tBS shows the t-statistic based on a moving block
bootstrap with 5,000 repetitions. The blr coefficients are long-run predictive coefficients
and measure variance shares (based on a VAR(1) of dividend growth, total returns, and the log dividend yield as in Cochrane (2008)). V(ηd) and V(ηr) denote the share of
un-expected return variation attributable to news about future dividends and discount rates, respectively.
Dividend growth Total returns
Country βd tBS R2 blrd V(ηd) βr tBS R2 blrr V(ηr)
Argentina -56.75 -3.59 0.34 1.22 1.23 -8.42 -0.47 0.05 -0.22 -0.23 Australia -18.96 -2.08 0.13 0.34 0.60 39.56 3.52 0.17 0.66 0.40 Austria -37.52 -3.59 0.28 1.61 0.53 15.50 1.12 0.02 -0.61 0.47 Belgium -11.70 -2.54 0.14 0.80 0.33 13.44 1.49 0.05 0.20 0.67 Brazil -28.18 -0.98 0.20 0.78 0.82 8.94 0.60 0.08 0.22 0.18 Canada -8.60 -1.40 0.09 0.66 0.72 7.39 0.86 0.02 0.34 0.28 Chile -12.72 -0.44 0.04 0.15 0.94 47.29 2.27 0.52 0.85 0.06 China -45.91 -2.38 0.31 0.94 1.18 -1.29 -0.04 0.00 0.06 -0.18 Colombia -62.55 -2.01 0.22 0.51 0.79 38.64 1.80 0.12 0.49 0.21 Czech Rep -29.55 -1.58 0.13 0.83 0.18 24.40 2.49 0.24 0.17 0.82 Denmark -10.58 -1.37 0.07 0.54 0.42 18.42 1.50 0.08 0.46 0.58 Finland -47.55 -3.09 0.41 0.70 0.90 -0.24 -0.02 0.00 0.30 0.10 France -3.20 -0.60 0.01 0.31 0.27 24.79 2.12 0.12 0.69 0.73 Germany -13.34 -3.22 0.18 0.85 0.62 9.18 0.78 0.02 0.15 0.38 Greece -26.54 -2.75 0.33 0.81 0.74 22.92 1.66 0.10 0.19 0.26 Hong Kong -10.97 -1.51 0.08 0.21 0.23 60.58 4.75 0.33 0.79 0.77 Hungary -21.15 -1.27 0.07 0.57 0.73 47.04 1.92 0.20 0.43 0.27 India -8.23 -0.56 0.02 0.26 0.81 36.31 1.63 0.20 0.74 0.19 Indonesia -46.04 -1.86 0.44 0.39 0.00 32.75 2.42 0.36 0.61 1.00 Ireland -0.08 -0.02 0.00 0.66 0.02 36.43 2.79 0.13 0.34 0.98 Israel -22.04 -1.35 0.19 1.18 0.89 0.07 0.00 0.00 -0.18 0.11 Italy -20.70 -2.73 0.15 0.85 1.05 12.79 1.24 0.02 0.15 -0.05 Japan 1.53 0.82 0.01 -0.28 0.33 11.14 1.36 0.06 1.28 0.67 Malaysia -8.77 -1.20 0.07 0.20 0.01 43.16 2.49 0.21 0.80 0.99 Mexico -16.32 -1.26 0.04 0.53 0.30 35.53 2.76 0.24 0.47 0.70
Table 2 (continued)
Table 3: Predictive regressions
This table shows estimates of the following (long-horizon) predictive regressions
4dt+h =α (h) d +β
(h)
d (dt−pt) +ε (h) t+h
rt+h =α(rh)+β (h)
r (dt−pt) +ε (h) t+h
for two global portfolios, namely the equal-weighted (left part of the table) or value-weighted market portfolio constructed from aggregating all individual sample countries. Numbers in brackets are t-values based on Newey-West (1987, tN W), Hodrick (1992, tH),
or moving block bootstrap standard errors (tBS). ¯R2 denotes the adjusted regression R-squared whereas R2
IH denotes the R-squared implied a VAR(1) as in Hodrick (1991).
EW VW
Dependent variable: Dividend growth
h 4 8 12 16 h 4 8 12 16
βd -12.06 -20.36 -18.44 -19.29 βd 1.4 3.2 5.21 6.52
tN W [-3.08] [-2.22] [-1.39] [-1.39] tN W [0.75] [0.79] [0.90] [0.96]
tH [-3.19] [-2.78] [-1.95] [-1.64] tH [0.94] [1.12] [1.27] [1.23]
tBS [-2.61] [-1.92] [-1.25] [-1.24] tBS [0.66] [0.61] [0.57] [0.71]
¯
R2 0.15 0.17 0.08 0.07 R¯2 0.01 0.02 0.03 0.03
R2IH 0.27 0.35 0.37 0.37 R2IH 0.05 0.02 0.02 0.01
V(ηd) 0.46 V(ηd) 0.22
Dependent variable: Total returns
h 4 8 12 16 h 4 8 12 16
βr 21.18 31.30 38.21 54.70 βr 14.00 27.11 40.28 52.59
tN W [2.69] [2.27] [1.92] [2.57] tN W [2.49] [2.37] [2.65] [3.26]
tH [2.02] [1.47] [1.28] [1.44] tH [2.14] [1.99] [2.00] [2.06]
tBS [2.25] [1.52] [1.29] [1.69] tBS [2.08] [1.53] [1.37] [1.62]
¯
R2 0.06 0.09 0.11 0.20 R¯2 0.08 0.16 0.23 0.33
R2
IH 0.07 0.11 0.14 0.16 R2IH 0.09 0.16 0.22 0.28
Table 4: Predictive panel regressions with firm size measures
This table shows results for panel predictive regressions of future dividend growth or total returns (over forecast horizonh= 4,8,12,16 quarters) on lagged (log) dividend yields and an interaction term of (log) dividend yields and average firm size (upper part) or the 90% quantile of the cross-sectional firm size distribution (lower part):
4di,t+h =α (h) i,d +β
(h)
d (di,t−pi,t) +β (h)
size,d(di,t−pi,t)F Si,t+ε (h) i,t+h
ri,t+h =α (h) i,r +β
(h)
r (di,t−pi,t) +β (h)
size,r(di,t−pi,t)F Si,t+ε (h) i,t+h
T-statistics are based on Newey-West (tN W) or bootstrapped standard errors (tBS) and the panel regressions employ fixed-effects to focus on time-series effects within countries.
Dividend growth Total returns
Panel A: Interaction of dividend yield with average firm size
h 4 8 12 16 h 4 8 12 16
βd -16.27 -21.19 -23.21 -25.95 βr 11.68 25.68 33.46 37.79
tN W [-4.49] [-4.02] [-3.76] [-3.62] tN W [4.33] [5.98] [5.69] [5.18]
tBS [-3.75] [-2.93] [-2.54] [-2.53] tBS [3.92] [4.81] [4.31] [3.93]
βf size 3.56 5.66 5.13 3.92 βf size -3.01 -3.37 -4.11 -7.58
tN W [2.13] [2.53] [1.99] [1.48] tN W [-2.64] [-1.89] [-1.79] [-2.73]
tBS [1.97] [1.86] [1.36] [0.97] tBS [-2.34] [-1.47] [-1.25] [-1.91]
¯
R2 0.16 0.19 0.15 0.12 R¯2 0.08 0.14 0.17 0.22
Panel B: Interaction of dividend yield with 90% quantile of firm size distribution
h 4 8 12 16 h 4 8 12 16
βd -16.73 -23.29 -24.92 -28.25 βr 15.63 31.19 40.49 46.36
tN W [-5.15] [-4.93] [-4.60] [-4.27] tN W [6.46] [7.82] [7.03] [6.43]
tBS [-4.15] [-3.65] [-3.25] [-3.01] tBS [5.87] [6.29] [5.57] [5.09]
βq90 3.61 4.33 3.68 1.88 βq90 -1.46 -0.59 -0.40 -3.47
tN W [2.18] [2.19] [1.83] [0.78] tN W [-1.33] [-0.31] [-0.14] [-1.03]
tBS [1.93] [1.57] [1.12] [0.46] tBS [-1.17] [-0.25] [-0.11] [-0.77]
¯