DRO
Deakin Research Online,
Stability, consistency and performance of distribution entropy in analysing short
length heart rate variability (HRV) signal
Citation:
Karmakar, Chandan, Udhayakumar, Radhagayathri K., Li, Peng, Venkatesh, Svetha and Palaniswami,
Marimuthu 2017, Stability, consistency and performance of distribution entropy in analysing short
length heart rate variability (HRV) signal
, Frontiers in Physiology
, vol. 8, pp. 720-734.
DOI:
10.3389/fphys.2017.00720
©2017, The Authors
Reproduced by Deakin University under the terms of the
Creative Commons Attribution Licence
Downloaded from DRO:
ORIGINAL RESEARCH published: 20 September 2017 doi: 10.3389/fphys.2017.00720
Edited by:
Zbigniew R. Struzik, The University of Tokyo, Japan
Reviewed by:
Paolo Castiglioni, Fondazione Don Carlo Gnocchi Onlus (IRCCS), Italy Christopher Clemens Mayer, Austrian Institute of Technology, Austria *Correspondence: Chandan Karmakar [email protected] Peng Li [email protected] Specialty section:
This article was submitted to Computational Physiology and Medicine, a section of the journal Frontiers in Physiology Received:09 October 2016 Accepted:06 September 2017 Published:20 September 2017 Citation: Karmakar C, Udhayakumar RK, Li P, Venkatesh S and Palaniswami M (2017) Stability, Consistency and Performance of Distribution Entropy in Analysing Short Length Heart Rate Variability (HRV) Signal. Front. Physiol. 8:720. doi: 10.3389/fphys.2017.00720
Stability, Consistency and
Performance of Distribution Entropy
in Analysing Short Length Heart Rate
Variability (HRV) Signal
Chandan Karmakar1*, Radhagayathri K. Udhayakumar2, Peng Li3*, Svetha Venkatesh4 and Marimuthu Palaniswami2
1School of Information Technology, Deakin University, Melbourne, VIC, Australia,2Department of Electrical and Electronics
Engineering, The University of Melbourne, Melbourne, VIC, Australia,3School of Control Science and Engineering, Shandong
University, Jinan, China,4Centre for Pattern Recognition and Data Analytics, Deakin University, Geelong, VIC, Australia
Distribution entropy (DistEn) is a recently developed measure of complexity that is used to analyse heart rate variability (HRV) data. Its calculation requires two input parameters—the embedding dimensionm, and the number of bins Mwhich replaces the tolerance parameterrthat is used by the existing approximation entropy (ApEn) and sample entropy (SampEn) measures. The performance ofDistEncan also be affected by the data lengthN. In our previous studies, we have analyzed stability and performance of
DistEnwith respect to one parameter (morM) or combination of two parameters (Nand
M). However, impact of varying all the three input parameters onDistEnis not yet studied. Since DistEn is predominantly aimed at analysing short length heart rate variability (HRV) signal, it is important to comprehensively study the stability, consistency and performance of the measure using multiple case studies. In this study, we examined the impact of changing input parameters on DistEn for synthetic and physiological signals. We also compared the variations ofDistEnand performance in distinguishing physiological (Elderly from Young) and pathological (Healthy from Arrhythmia) conditions withApEnand
SampEn. The results showed thatDistEnvalues are minimally affected by the variations of input parameters compared to ApEn and SampEn. DistEn also showed the most consistent and the best performance in differentiating physiological and pathological conditions with various of input parameters among reported complexity measures. In conclusion,DistEnis found to be the best measure for analysing short length HRV time series.
Keywords: distribution entropy, heart rate variability, short-term analysis, sample entropy, approximate entropy, aging, arrhythmia
1. INTRODUCTION
Fluctuations in RR intervals is termed heart rate variability (HRV) (Acharya et al., 2006). Parameters to quantify HRV are important diagnostic markers to determine pathological cardiac conditions (Estela et al., 1995). HRV is known to change with age, gender, disease and many such conditions (Huikuri et al., 1999; Sandercock et al., 2005). In order to quantitatively evaluate HRV, various linear methods have been proposed and shown to be effective. However, these linear techniques are not sufficient and may fail in capturing important diagnostic information since
the physiological systems are highly non-linear in nature (Huikuri et al., 1999; Acharya et al., 2004). Therefore, approaches that are able to discover the non-linear dynamics within HRV are required. With such an aim, a couple of entropy measures, e.g., approximate entropy (ApEn) and sample entropy (SampEn), that reflect the complexity or irregularity of HRV have been developed (Pincus et al., 1991; Richman and Moorman, 2000; Acharya et al., 2004; Chen et al., 2009). However, these entropy measures are found to be highly parameter-dependent. Specifically, their estimations depend on data length N, dimensionm (required in the delay embedding reconstruction process) and tolerance
r (used to determine whether two vectors are similar) (Pincus, 1991; Yentes et al., 2013; Mayer et al., 2014). An incorrect choice of these parameters may lead to inconsistent results (Castiglioni and Di Rienzo, 2008; Lu et al., 2008; Liu et al., 2011; Mayer et al., 2014). Therefore, current entropy-related studies emphasize on techniques for the optimal selections of entropy parameters, thereby increasing the accuracy of complexity results (Lu et al., 2008).
Among the three parameters, the tolerance parameter r is considered the most critical since a small variation in the choice ofrleads to a large difference in the assessments of complexity (Castiglioni and Di Rienzo, 2008; Lu et al., 2008; Liu et al., 2011; Mayer et al., 2014). Thus, failure to make right choice of
rresults in highly misleading results and there is no simple and reliable method for choosing the value of r. In an attempt to eliminate the use ofrfrom entropy calculations, we have recently developed a new entropy method named distribution entropy (DistEn) (Li et al., 2015). Instead of binning all the vectors into similar and dissimilar categories, DistEn employs directly the distribution characteristics of the inter-vector distances. It introduces a bin number parameter M in order to estimate the empirical probability density function (ePDF). Unlike the tolerancerinApEnorSampEnmeasurement,Mis observed to be less influential onDistEn.
The influence of parametersNandMonDistEnin the case of logistic time series data is tested in previous studies and results showed that the variation ofDistEnwithNandMwas negligible and thereby DistEn can be considered stable with respect to
N and consistent with regard to M (Li et al., 2015). However, in those experiments either N orM was kept constant while varying the other. In our previous study (Udhayakumar et al., 2015), we have investigated the combined effect ofNandMon
DistEnand found that a problem-specific selection ofN andM
is important to achieve the best classification performance. We have also found that a random choice ofM inDistEnprovides better results thanApEnandSampEnin classifying arrhythmic subjects from healthy subjects (Karmakar et al., 2015) especially for short length HRV signal. However, the effect of embedding dimensionmon the performance ofDistEnis yet to be analysed for both synthetic and physiological time-series.
This study focuses on evaluating the combined impact of data length N, embedding dimension m and number of bins
M onDistEn for both synthetic and physiological time-series. The complete DistEn space was revealed by varying N, m
and M for each signal. The assessment was performed by examining the classification performance ofDistEnas a feature
for differentiating—(i) different levels of complexity in synthetic data; (ii) Young vs. Elderly, using RR interval signal; and (iii) Arrhythmia vs. Healthy, using RR interval signal. In the same context, performance of DistEn is compared with the earlier methods ofApEnandSampEn.
2. DATA AND METHODS
2.1. Data and Subjects
Synthetic data based on logistic time-series and physiological data extracted the Physionet fantasia, MIT-BIH arrhythmia, and MIT-BIH normal sinus rhythm databases were used in this study. Data in Physionet databases are fully anonymized and thus can be used without IRB approval.
Synthetic data—Logistic time series at two different levels of complexity were used for the study. Two sets of signals with an increasing order of complexity were named as “Periodic” and “Chaotic.” In order to eliminate random factors, we generated 10 realizations (corresponding to different initial values) of the same type using the logistic map given byxn+1 = axn(1−xn).
The constantawas set at 3.5 (or 4) with an initial value randomly chosen between 0.1 and 0.2 in order to generate a “Periodic” and “Chaotic” level signal respectively. Although larger number of realizations is better for eliminating random factors, we believe 10 realizations are well enough for this study since the domain of initial values were restricted in a small range. We only used logistic map to produce time-series with chaotic and periodic regimes since it has been the simplest and most widely used synthetic data examples to demonstrate entropy level variations (Kaplan et al., 1990; Pincus, 1991; Xie et al., 2008; Chen et al., 2009; Li et al., 2015). All synthetic signals are generated using MATLAB R2014b.
Physiologic data—RR interval data of twenty healthy “Young” (21–34 years old) and twenty healthy “Elderly” (68– 85 years old) subjects were obtained from the Fantasia module of the PhysioNet database (Goldberger et al., 2000). Each data corresponds to a 120 min recording of the subject’s electrocardiogram (ECG) when in continuous supine resting, sampled at a frequency of 250 Hz. Each group of subjects has an equal number of men and women. Each RR interval is computed by an automated algorithm from annotated heartbeats of subjects (Iyengar et al., 1996) . After extraction of RR series of all subjects from the database, each signal segment was selected from the beginning by varying length from 50 to 1,000 beats (total 8 different lengths—50, 100, 200, 300, 400, 500, 750, and 1,000 beats corresponding to average time durations of 0.78, 1.60, 3.23, 4.88, 6.52, 8.17, 12.30, and 16.44 min, respectively) for each subject.
RR interval time-series of “Arrhythmia” and “Healthy” subjects were obtained from the MIT-BIH module of the PhysioNet database (Goldberger et al., 2000). The Arrhythmia Database contains 48 ECG recordings obtained from 47 subjects (Moody and Mark, 2001). The subjects included 25 men aged 32 to 89 years and 22 women aged 23 to 89 years. The recordings were digitized at 360 samples per second per channel with 11-bit resolution over a 10 mV range. Each beat of every record was then annotated independently using a slope sensitive QRS detector (Moody and Mark, 2001). From this, the RR interval
Karmakar et al. DistEn for short length HRV
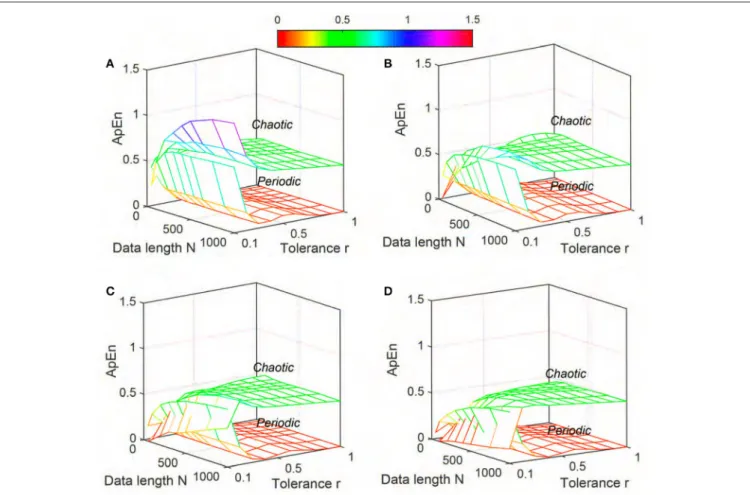
FIGURE 1 |Variation of Approximate entropy (ApEn) for Synthetic signal (“Chaotic” and “Periodic” ) varying parametersNandrfor(A)m=2,(B)m=3,(C)m=4, and(D)m=5.
was then computed for each subject. The Normal sinus rhythm database contains 18 long-term ECG recordings of subjects who were found to have no significant arrhythmia; they include 5 men, aged 26 to 45, and 13 women, aged 20 to 50. After extraction of RR series of all subjects from the database, each signal segment was selected from the beginning by varying length from 50 to 1,000 beats (total 8 different lengths as mentioned in previous paragraph, which corresponds to average time durations of 0.69, 1.34, 2.67, 3.98, 5.23, 6.16, 9.89, and 13.24 min, respectively ) for each subject.
2.2. Entropy Measures
In this study, we compared the characteristics and performance of DistEn as a entropy measure with ApEn and SampEn. The reason thatApEn and SampEn were used for comparison was becauseDistEnwas initially proposed to address the dependence of the existingApEnandSampEnmethods on tolerancer.
2.2.1. Approximate Entropy (ApEn)
ApEnis an approximation of the conditional probability (Pincus, 1991; Pincus and Goldberger, 1994) of two segments matching at a length ofm+1 if they match atm. The embedding dimensionm
is the length of compared segments of the input time series and
ris the threshold of distance, which is fixed to match segments when they are compared with each other. Let a time series of lengthNbe defined as
x(n):1≤n≤N . For a given value of the embedding dimensionmand tolerancer,ApEnis calculated using following steps:
1. Form (N−m+1) vectors of lengthmeach, given by
Xim:1≤i≤(N−m+1) where
Xim=x(i+k):0≤k≤m−1 (1) 2. Take eachXmi vector of step 1 as a template vector and find its distance from every vector ofXmj , where the distance is given by dmij ={max|Xmi −Xmj |: 1≤j≤(N−m+1)} (2) 3. Then we define 8m(r)= 1 N−m+1 XN−m+1 [i=1] lnC m i (r) (3)
where,Cim(r) is the probability of a vectorXjmto lie within a distancerof the vectorXim
FIGURE 2 |Variation of Sample entropy (SampEn) for Synthetic signal (“Chaotic” and “Periodic” ) varying parametersNandrfor(A)m=2,(B)m=3,(C)m=4, and(D)m=5.
4. The above steps are repeated for m+1, resulting in8m+1(r) from whichApEnis defined as
ApEn=8m(r)−8m+1(r) (4) In this study, we usedm=2, 3, 4, 5 andr=0.1∗SDto 1∗SDwith a step size of 0.1∗SDto calculateApEnfor all signals, where SD denotes standard deviation of the signal. For ease of calculation and visualization, each RR time-series was normalized to unitary variance before calculatingApEn.
2.2.2. Sample Entropy (SampEn)
SampEnis a modified version ofApEnto find the irregularity of a given signal (Richman and Moorman, 2000). Here, self matches between vectors are avoided from the calculation and the same number of template vectors are used inmandm+1 dimensions. For a given time series data of length N, sample entropy is calculated as SampEn=ln 8 m(r) 8m+1(r) (5) where 8m(r)= 1 N−m N−m X i=1 Cmi (r) (6)
Cmi (r) being the probability of a vectorXjmto lie within a distance
rof the vectorXim,1≤j≤(N−m),j6=i.
Similar toApEn, we used m = 2, 3, 4, 5 andr = 0.1∗SD
to 1∗SDwith a step size of 0.1∗SDto calculateSampEnfor all signals, where SD denotes standard deviation of the signal. For ease of calculation and visualization, each RR time-series was normalized to unitary variance before calculatingSampEn.
2.2.3. Distribution Entropy (DistEn)
DistEn is initially developed from SampEn with an aim of improving the inconsistency and minimizing the dependence on input parameters. The novelty behindDistEnis the assumption that the inconsistency and parameter-dependence ofSampEn -based measures come from the incomplete assessment of the distribution of inter-vector distances, and that they can be eliminated by taking full advantages of the distribution property (Li et al., 2015). By quantifying the Shannon entropy of the probability density of inter-vector distances—an assessment that completely and globally quantifies the distribution property, the so-developedDistEndisplayed improved performance as we expected (Li et al., 2015).
For a given time series data of lengthN, embedding dimension
mand bin numberM the distribution entropy is calculated as follows.
Karmakar et al. DistEn for short length HRV
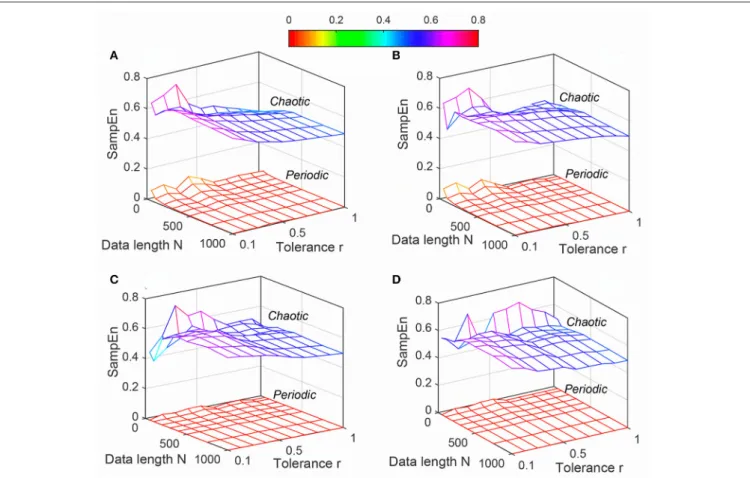
FIGURE 3 |Variation of Distribution entropy (DistEn) for Synthetic signal (“Chaotic” and “Periodic”) varying parametersNandMfor(A)m=2,(B)m=3,(C)m=4 and(D)m=5.
1. Form (N−m) vectors of lengthmeach, given by
Xim:1≤i≤(N−m) where
Xmi =
x(i+k):0≤k≤m−1
2. Take eachXimvector of step 1 as a template vector and find its
distance from vectorXmj , where the distance is given by
dmij ={max|Xmi −Xjm|: 1≤j≤(N−m),j6=i}
A distance matrixDof size (N−m)∗(N−m−1) is formed by repeating this calculation for allithtemplate vectors, where
1≤i≤(N−m).
3. The elements of distance matrix D are now divided into
M number of equally spaced bins and the corresponding histogram is obtained.
4. Now, at each bintof the histogram, its probability is estimated aspt= total number of elements in matrixcount in bint D; 1≤t≤M.
5. By the definition of Shannon entropy, the normalizedDistEn
of a given time series x(i), is defined by the expression
DistEn(m,M) = M −1 log2(M) P ptlog2(pt) t=1 ,where pt is the probability of each bin in the histogram.
In this study, we used m = 2, 3, 4, 5 and M =
50, 100, 200, 300, 400, 500, 750, 1000, 1500, 2000 to calculate
DistEnfor all signals.
2.3. Statistics
In our study, we used area under the ROC curve (AUC) to test the efficiency ofDistEnas a feature to distinguish signals of different levels of complexity (synthetic) and RR time series belonging to different classes (physiologic). The AUC is the probability that a classifier ranks a randomly chosen instanceX higher than a randomly chosen instanceY,XandYbeing samples taken from two independent populations. An AUC value of 0.5 indicates that the distributions of the features are similar in the two groups with no discriminatory power. Conversely, an AUC value of 1.0 means that the distribution of the features of the two groups do not overlap at all. The AUC value was approximated numerically using the trapezoidal rules (Hanley and McNeil, 1982) where the larger the AUC value, the better the discriminatory performance. MATLAB R2014b Statistics toolbox was used to perform all statistical operations.
3. RESULTS
The results of this study are divided into two subsections to summarize—(i) the effect of parameters on entropy values;
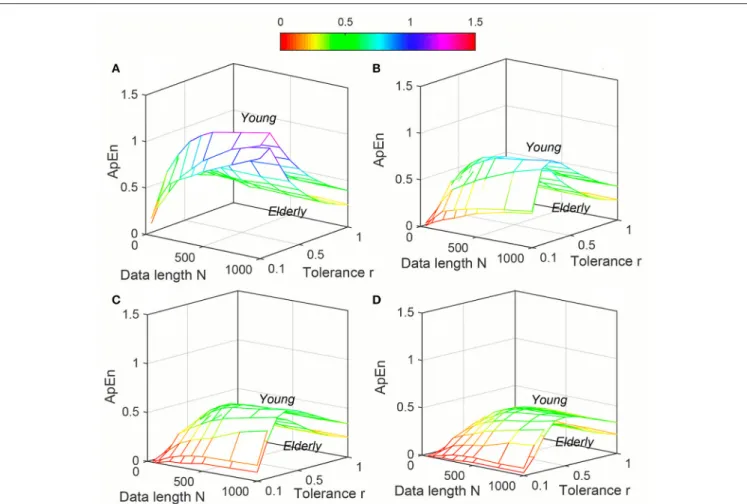
FIGURE 4 |Variation of Approximate entropy (ApEn) for physiological signal (Elderly and Young subjects) varying parametersNandrfor(A)m=2,(B)m=3,(C)
m=4, and(D)m=5.
and (ii) the performance of the entropy measurements in distinguishing various synthetic signals and physiological conditions.
3.1. Entropy Values with Varying
Parameters
3.1.1. Synthetic Signal
The variation of mean values of ApEn, SampEn and DistEn
by varying N , m and r (for ApEn and SampEn) or M (for
DistEn) for “Periodic” and “Chaotic” synthetic signals are shown inFigures 1–3, respectively.ApEnvalues of both “Periodic” and “Chaotic” signals were rapidly changing at low values of tolerance
r (Figure 1). For smaller data length, such rapid variations resulted in lower mean ApEn value of “Chaotic” signal than “Periodic.” These characteristics ofApEnvalues remained similar for all embedding dimensions m = [2, 5] used in this study. Moreover, with increasingmvalues the range of data lengthN
and toleranceralso increased for which meanApEnvalues were unstable (Figure 1). Although averageSampEnvalues varied with variation of parameters N, r and m, the value of “Periodic” signal always remained smaller than “Chaotic” signal (Figure 2). Moreover, the variation was more pronounced for “Chaotic”
signal than “Periodic.” In contrast to ApEn, SampEn showed more variation with respect to tolerancerthan the data length
Nfor synthetic signal. In addition, similar toApEn, the variation inSampEnvalues especially for “Chaotic” signal increased with increasing embedding dimensionm. Similar toSampEn, average
DistEnvalue was always lower in “Periodic” signal than “Chaotic” (Figure 3). However, in contrast to SampEncharacteristics the variation in average DistEn values were more pronounced in “Periodic” signal than “Chaotic.” For the “Periodic” signal,
DistEnvalues were affected by variations in bin numberM for all values of data lengthN. On the other hand, for “Chaotic” signal although there was subtle variation in DistEn value, it was mostly due to changes in data length N rather than bin number M. Therefore, in general, the influence of N is more pronounced than the influence ofMonDistEnof synthetic data. In addition, these characteristics ofDistEnremained similar over all embedding dimensionsm=[2, 5].
3.1.2. Physiological Signal
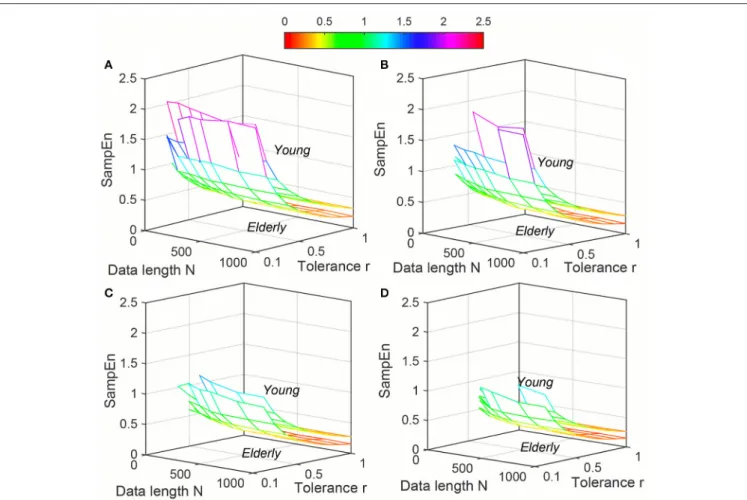
Variation of average ApEn, SampEn and DistEn values with varying parameter values for HRV signals of Young and Elderly population were shown inFigures 4–6, respectively. ForApEn
Karmakar et al. DistEn for short length HRV
FIGURE 5 |Variation of Sample entropy (SampEn) for physiological signal (Elderly and Young subjects) varying parametersNandrfor(A)m=2,(B)m=3,(C)
m=4, and(D)m=5.
andSampEn, effect of parameterr(tolerance) was predominantly higher than that of data lengthNfor all embedding dimensions
m, which was quantified as the average variance acrossrandN
as shown inTable 1 (Columns 1 and 2 of ApEn and SampEn
measures). It is obvious thatσNis less thanσr/mfor all embedding
dimensions, thus the variations of ApEn and SampEn values across differentr-values are larger than those across differentN
values. However, in contrast to ApEn, SampEn was undefined for smaller data length either for Young or Elderly population. This undefined SampEn region increased with decreased N, decreasedrand increasedm(Figure 5).Table 2(Column “Case study 1:Elderly and Young subjects”) showed the ranges of N
andrthat resulted in validSampEnvalues for each embedding dimension m. It is obvious that with increasing m, higher r
values were required for shorter data length (N) to obtain valid
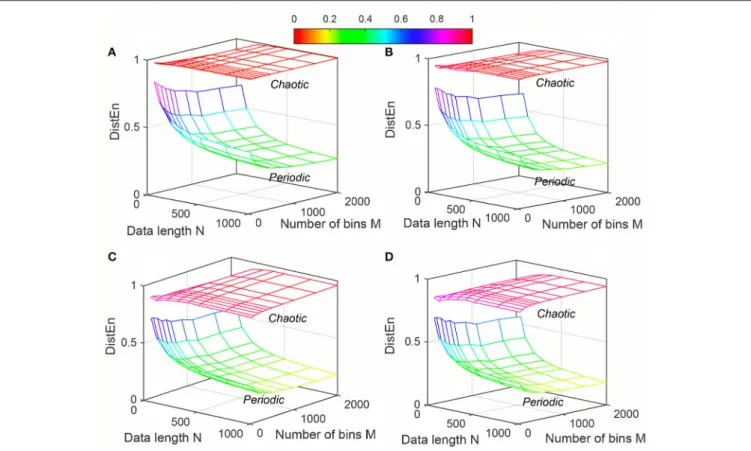
SampEnvalues. This indicates that theSampEnsurface is sparser compared to bothApEnandDistEn, since they are both defined for all values ofNandrorM. The variation ofDistEnvalues with change ofMwas higher than variation ofN, which indicates that the effect of bin numberMonDistEnvalues for both Elderly and Young subjects were higher than that ofN (Figure 6).Table 1
supported this observation quantitatively where theσNwas lesser
thanσr/m for all embedding dimensions (see columns 1 and 2
forDistEnmeasure). This is opposite to the behavior observed for Synthetic signal and this pattern remained similar over all embedding dimensionsm=[2, 5] (Figure 6).
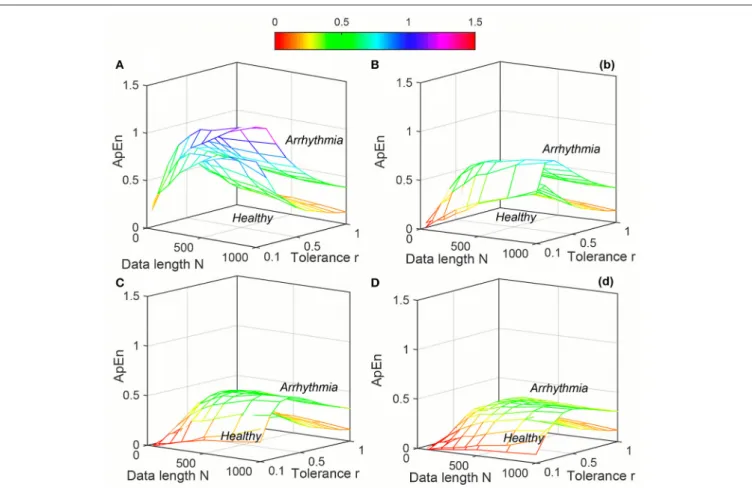
The variation of average entropy (ApEn, SampEn and
DistEn) values with varying parameter values for Healthy and Arrhythmia population were shown inFigures 7–9, respectively. Similar to the previous case study (Young and Elderly population), SampEn was the only entropy measure that was undefined for different combinations ofN, mandr, especially at lower N, r and higher m (Table 2- Column “Case study 2: Healthy and Arrhythmia subjects”). In addition, variation of entropy values was higher with respect to the change ofr than that ofmfor bothApEnandSampEn(Columns 3 and 4 ofTable 1
forApEnandSampEnmeasures). On the other hand, although
DistEnvalues changed with varyingNandM, the changes were relatively small for both of them (Table 1). Moreover, in contrast toApEn, there was no crossover inSampEnandDistEnvalues for any combination ofN,mandrorM.
3.2. Performance by Varying Parameters
Table 3 summarized the performance of the three entropy measures for classifying i) Elderly from Young and ii) Healthy (Normal Sinus Rhythm) from Arrhythmia subjects. For “CaseFIGURE 6 |Variation of Distribution entropy (DistEn) for physiological signal (Elderly and Young subjects) varying parametersNandMfor(A)m=2,(B)m=3,(C)
m=4 and(D)m=5.
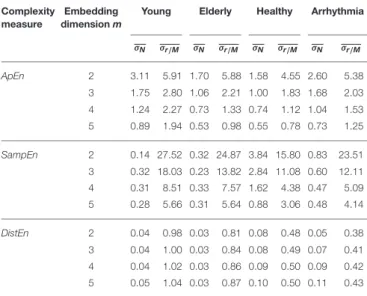
TABLE 1 |Average variance across data length (N) and tolerarance (r- forApEn
andSampEn) or bin number (MforDistEn) for all embedding dimension (m) to quantify the sensitivity of each entropy measure with respect to their parameters.
Complexity measure
Embedding dimensionm
Young Elderly Healthy Arrhythmia
σN σr/M σN σr/M σN σr/M σN σr/M ApEn 2 3.11 5.91 1.70 5.88 1.58 4.55 2.60 5.38 3 1.75 2.80 1.06 2.21 1.00 1.83 1.68 2.03 4 1.24 2.27 0.73 1.33 0.74 1.12 1.04 1.53 5 0.89 1.94 0.53 0.98 0.55 0.78 0.73 1.25 SampEn 2 0.14 27.52 0.32 24.87 3.84 15.80 0.83 23.51 3 0.32 18.03 0.23 13.82 2.84 11.08 0.60 12.11 4 0.31 8.51 0.33 7.57 1.62 4.38 0.47 5.09 5 0.28 5.66 0.31 5.64 0.88 3.06 0.48 4.14 DistEn 2 0.04 0.98 0.03 0.81 0.08 0.48 0.05 0.38 3 0.04 1.00 0.03 0.84 0.08 0.49 0.07 0.41 4 0.04 1.02 0.03 0.86 0.09 0.50 0.09 0.42 5 0.05 1.04 0.03 0.87 0.10 0.50 0.11 0.43
This is a quantitative summary of variations shown inFigures 4–9.σN, Average variance
measured accross data length (N);σr/M, Average variance measured across tolerance (r)
or bin numbers (M) (tolerance for ApEn and SampEn, bin number for DistEn). Values of σNandσr/Mpresented in this table are multiplied by102for removing leading zeros.
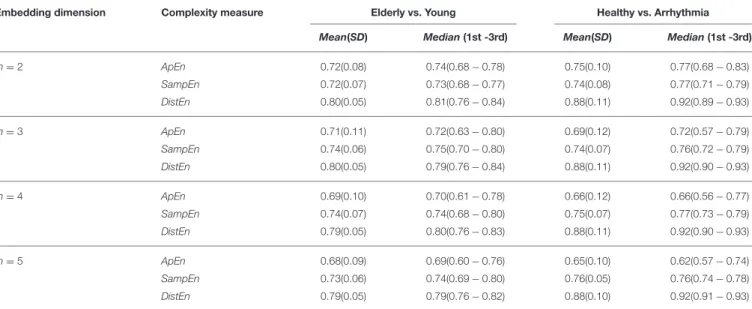
study 1” (Elderly vs. Young) the change in average AUC was maximum forApEn(0.72, 0.68) and minimum forDistEn(0.80, 0.79) with respect to embedding dimensionm. Similarly, change in median AUC was also minimum for DistEn (0.81, 0.79) along withSampEn(0.75,0.73). However, the standard deviation (SD) and inter-quartile range of DistEn was the lowest for each embedding dimensionmamong all entropy measures. In addition,DistEnshowed the highest average and median AUC values for each embedding dimensionm, which indicate that
DistEn is a better measure to distinguish Elderly from Young subjects thanSampEn andApEn. For “Case study 2” (Healthy vs. Arrhythmia), although the average AUC value ofApEnand
SampEnchanged with the variations of embedding dimension
m, it remained constant forDistEn. Similarly, the median AUC values ofDistEnalso remained same (0.92) over the variations of embedding dimension. Interestingly, althoughSampEnshowed the lowest SD of AUC values for each embedding dimension
m, the inter-quartile range was the lowest for DistEn. Since performance ofSampEn was calculated only for the range of parameters defined in Table 2, this reduced number of AUC values might lead to such small SD values. Similar to ”Case Study 1," DistEn was also found to be the best measure for distinguishing Healthy from Arrhythmia subjects (average and median AUC values were 0.88 and 0.92, respectively).
Karmakar et al. DistEn for short length HRV
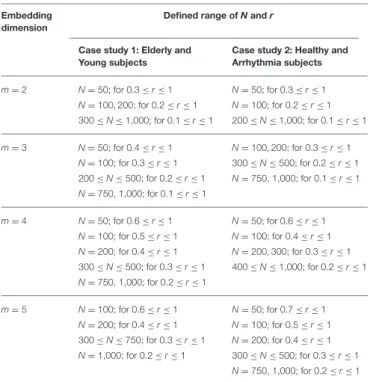
TABLE 2 |Range of parameter values for which Sample entropy (SampEn) measure are defined for both case studies (Case study 1: Elderly and Young subjects, Case study 2: Healthy and Arrhythmia subjects).
Embedding dimension
Defined range ofNandr Case study 1: Elderly and
Young subjects
Case study 2: Healthy and Arrhythmia subjects m=2 N=50; for 0.3≤r≤1 N=50; for 0.3≤r≤1 N=100, 200; for 0.2≤r≤1 N=100; for 0.2≤r≤1 300≤N≤1,000; for 0.1≤r≤1 200≤N≤1,000; for 0.1≤r≤1 m=3 N=50; for 0.4≤r≤1 N=100, 200; for 0.3≤r≤1 N=100; for 0.3≤r≤1 300≤N≤500; for 0.2≤r≤1 200≤N≤500; for 0.2≤r≤1 N=750, 1,000; for 0.1≤r≤1 N=750, 1,000; for 0.1≤r≤1 m=4 N=50; for 0.6≤r≤1 N=50; for 0.6≤r≤1 N=100; for 0.5≤r≤1 N=100; for 0.4≤r≤1 N=200; for 0.4≤r≤1 N=200, 300; for 0.3≤r≤1 300≤N≤500; for 0.3≤r≤1 400≤N≤1,000; for 0.2≤r≤1 N=750, 1,000; for 0.2≤r≤1 m=5 N=100; for 0.6≤r≤1 N=50; for 0.7≤r≤1 N=200; for 0.4≤r≤1 N=100; for 0.5≤r≤1 300≤N≤750; for 0.3≤r≤1 N=200; for 0.4≤r≤1 N=1,000; for 0.2≤r≤1 300≤N≤500; for 0.3≤r≤1 N=750, 1,000; for 0.2≤r≤1
Table 4 showed the best performance obtained for each entropy measure by varying parametersmandr/Mfor minimum (50 beats) and maximum (1,000 beats) data lengths. It is obvious thatDistEnoutperformedApEnandSampEnfor minimum data length (50 beats) in both case studies (AUC for DistEn (0.82, 0.94), ApEn (0.75, 0.67) andSampEn(0.75, 0.66)). In contrast to minimum data length,DistEnshowed a comparable performance in both case studies for maximum data length (1,000 beats) (Table 4).
4. DISCUSSION
Several studies have shown that HRV is capable of tracking cardiovascular disease development (Thayer et al., 2010), assessing mental disorders (Kemp and Quintana, 2013), and reflecting autonomic dysregulation (Sgoifo et al., 2015). The recent emergence of wearable devices and mobile applications further promotes the development of this translational field by offering the opportunity for continuous and long-time monitoring of HRV (Walsh et al., 2014). To achieve this goal, the quantification methods should be able to accept short or even extremely short HRV series as input without (or minimally) affecting the results.
Distribution entropy (DistEn) has been shown to be a reliable measure of complexity for short length HRV time series (Li et al., 2015; Udhayakumar et al., 2015). DistEn takes full advantage of the state space representation of the original HRV series, by measuring the probability distribution from all inter-vector distances, to alleviate the problem that traditional measures,
e.g., approximate entropy (ApEn) and sample entropy (SampEn), suffer for short length signal (Li et al., 2015). The fact that time series with different dynamics have different distribution profiles, suggests the distribution property probably intrinsic and provides a rationale forDistEn to employ the probability density function of the distances as a media for complexity analysis (Li et al., 2015). Performance of DistEn has been tested by surrogate data analysis, simulation models, and real experimental data (Li et al., 2015; Udhayakumar et al., 2015).
DistEn introduced another parameter—M (bin number used to estimate the empirical probability density) to replace r
(threshold value)—inApEn and SampEncalculation. We have shown using both benchmark data and real HRV series that the selection of M is not as critical as r (Li et al., 2015; Udhayakumar et al., 2015). We have also proved that DistEn
remains relatively stable with extremely short series whereas the two traditional measures fail. In addition toM and N, there is yet another parameter—m(embedding dimension)—that needs to be considered in order to fully span theDistEnspace. Together, they may have some combined impacts onDistEnperformance, which has not yet been determined and that motivated our current study.
Intriguingly, the results are as what we expected:
• DistEn varied less with different combinations of
m, M, and N as compared with ApEn and SampEn
(Figures 3,6,9).
• For even very small data lengths,N,DistEnstill could result in reasonable values rather than invalid or extreme values (Table 2).
• DistEnperformed the best among the three in differentiating Elderly subjects from Young, or differentiating Arrhythmia subjects from Healthy (Table 3).
• Performance of DistEn is minimally affected by the input parameters compared to ApEn and SampEn in both case studies (Table 3).
• The best performance ofDistEnis always the highest among the three entropy parameters in differentiating Elderly subjects from Young, or differentiating Arrhythmia subjects from Healthy for shortest data length and comparable for longest data length (Table 4).
In brief, the main findings of this study proved the stability and consistency ofDistEn with variations of input parameters.
DistEnalso showed better performance in distinguishing healthy “Young” from “Elderly” and “Healthy” from “Arrhythmic” subjects than that with other popular entropy measuresApEn
andSampEn. The results of this study showed that average AUC of DistEn varied least with change of embedding dimension (compared to ApEn and SampEn). Also, the average AUC of DistEn remained the highest among those of the studied entropy measures. This indicates that DistEn is the best feature and the performance is minimally affected by the choice of entropy measurement parameters. In addition, low inter-quartile range (IQR) of AUC value of DistEn further establishes the findings that the performance of DistEn is least affected by choice of parameters compared toApEn and
FIGURE 7 |Variation of Approximate Entropy (ApEn) for physiological signal (Healthy and Arrhythmia) varying parametersNandrfor(A)m=2,(B)m=3,(C)m=4, and(D)m=5.
From results, it is obvious that DistEn showed the best performance (maximum AUC value for any combination of parameters) for minimum data lengths (Table 4). Although the differences in margins among the best performances for “Case study 1” are small, these performances of ApEn and SampEn
are obtained with very high tolerance r values (0.9 and 1), which fall outside the range of traditionally recommended range (between 0.1 and 0.25). On the other hand, for longest data length (1,000 beats) the best performance ofDistEnis comparable with
ApEn andSampEn. This further suggests that existing entropy measures fail in short-length data, although they show good performance for long-length data. However, similar to short length data, most of these performances ofApEnand SampEn
are obtained at very large tolerance values (0.8 and 1) except “Case study 2” of SampEn, where tolerance value (r = 0.3) remains within the traditional range. These results further prove that performance of ApEnand SampEnis highly sensitive and inconsistent with varying parameters compared toDistEn.
Findings of this study shows that higher tolerance (r) values are needed for obtaining SampEn values for short length signal, which is aligned with previously reported findings (Xie et al., 2008; Li et al., 2015). The minimum r value for obtaining SampEn value also increases with increasing value
of embedding dimension m (Table 2). The SampEn measure becomes undefined for tolerance values for which none of the vector matches with any of the template vectors i.e.,φm(r) = 0 or φm+1(r) = 0. This indicates that lenient tolerance value is necessary for measuring SampEn of short length signal. In contrast toSampEn, bothApEnandDistEnremain defined for all data lengths. TheApEnmeasure is defined for any data length and tolerance value, since it considers self-matching of template vectors i.e., the probability of a vector to lie with in a distance
rof the template vector is always greater than zero (Cmi (r) > 0 orCmi+1(r) > 0 ). On the other hand, since DistEn measure uses all distances between each pair of vectors in state-space to generate the probability distribution, it is always defined for any data length.
In the case of Synthetic signals, although subtle variations were present in the values, all three measures used in this study (ApEn, SampEn, and DistEn) were able to perfectly distinguish (AUC = 1) "Chaotic" signal from "Periodic" signal for all combination of parameters. However, such consistency in performance was not found for physiological signal where the signal is neither periodic nor chaotic. In particular, for short length signal the performance ofApEnandSampEnwas worse compared toDistEn. However, bothApEnandSampEnshowed
Karmakar et al. DistEn for short length HRV
FIGURE 8 |Variation of Sample Entropy (SampEn) for physiological signal (Healthy and Arrhythmia) varying parametersNandrfor(A)m=2,(B)m=3,(C)m=4, and(D)m=5.
better or comparable performance withDistEnin case of larger data length (N=1,000). This indicates that the consistency and performance of ApEn and SampEn are highly affected by the choice of parameters especially for physiological signal analysis.
The calculation over the inter-vector distances in DistEn
algorithm may essentially account for its improvement. Specifically, by estimating the probability density of all inter-vector distances, the amount of used information inDistEn is strikingly increased from the order ofNtoN2. WhenNis small, the estimation of the probability of only “similar vectors” inApEn
andSampEnwill become severely unreliable (due to inadequate information of the “similar vectors” thoughApEnandSampEn
indeed also calculate all the inter-vector distances), whereas
DistEn will not be affected significantly with the increased information. In a previous study, we also proved that the use of the probability density rather than the probability of only “similar vectors” is theoretically reasonable (Li et al., 2015). With this study, we further confirmed our previous hypothesis that the performance of complexity estimates could be improved by globally quantifying the inter-vector distances in the state-space (Li et al., 2015).
Given the methodological discrepancies betweenDistEnand compared measures (ApEnandSampEn), it is reasonable to recall
the existing questions—what is complexity and how can it be measured. Although until most recently, they remain being the source of many scientific arguments (Mitchell, 2009), researchers have proposed some measurements to estimate complexity from different scenarios, the irregularity of time-series which can be quantified by ApEn and SampEn included. However, a high irregularity level may not necessarily be indicative of a high complexity; instead, the irregularity increases with the degree of randomness (Costa et al., 2002). In our previous work (Li et al., 2015), we tried to propose a concept that the "spatial structure", instead of only the conditional probability of similar vectors that have been used in ApEn and SampEn, might be an indicative feature of complexity. We applied the empirical probability density function (ePDF) of inter-vector distances to characterize this spatial structure inDistEnmeasure and found that time-series with different dynamics had distinctly different
ePDFs: (i) a time-series with chaotic regime is accompanied by dispersedly distributed inter-vector distances; and (ii) the distribution becomes concentrative for periodic time-series. Based on this concept, periodic time-series are not always accompanied with a DistEn of 0 since they could indicate different distribution patterns in term of the spatial structure and consequently, it could be reasonable to offer them different
FIGURE 9 |Variation of Distribution Entropy (DistEn) for physiological signal (Healthy and Arrhythmia) varying parametersNandMfor(A)m=2,(B)m=3,(C)
m=4, and(D)m=5.
TABLE 3 |Comparison of classification performance ofApEn,SampEnandDistEnfor two case studies.
Embedding dimension Complexity measure Elderly vs. Young Healthy vs. Arrhythmia
Mean(SD) Median(1st -3rd) Mean(SD) Median(1st -3rd)
m=2 ApEn 0.72(0.08) 0.74(0.68−0.78) 0.75(0.10) 0.77(0.68−0.83) SampEn 0.72(0.07) 0.73(0.68−0.77) 0.74(0.08) 0.77(0.71−0.79) DistEn 0.80(0.05) 0.81(0.76−0.84) 0.88(0.11) 0.92(0.89−0.93) m=3 ApEn 0.71(0.11) 0.72(0.63−0.80) 0.69(0.12) 0.72(0.57−0.79) SampEn 0.74(0.06) 0.75(0.70−0.80) 0.74(0.07) 0.76(0.72−0.79) DistEn 0.80(0.05) 0.79(0.76−0.84) 0.88(0.11) 0.92(0.90−0.93) m=4 ApEn 0.69(0.10) 0.70(0.61−0.78) 0.66(0.12) 0.66(0.56−0.77) SampEn 0.74(0.07) 0.74(0.68−0.80) 0.75(0.07) 0.77(0.73−0.79) DistEn 0.79(0.05) 0.80(0.76−0.83) 0.88(0.11) 0.92(0.90−0.93) m=5 ApEn 0.68(0.09) 0.69(0.60−0.76) 0.65(0.10) 0.62(0.57−0.74) SampEn 0.73(0.06) 0.74(0.69−0.80) 0.76(0.05) 0.76(0.74−0.78) DistEn 0.79(0.05) 0.79(0.76−0.82) 0.88(0.10) 0.92(0.91−0.93) Performances measured for each embedding dimension m. Mean, average AUC value; SD, standard deviation of AUC values; Median, median AUC value;1st, AUC value at25th percentile; and3rd, AUC value at75th percentile.
complexity levels. The correlation of DistEn with Lyapunov exponent (LE) for a series of logistic maps has been studied to show thatDistEncorrelates withLEor KS entropy in a chaotic
system. We have also studied the correlation between DistEn
and SampEn. The results shows that the correlation between
Karmakar et al. DistEn for short length HRV
TABLE 4 |Combination of parameters (r/M,m) that shows best classification performances (AUCmax) ofApEn,SampEnandDistEnwith minimum (50 beats) and maximum (1,000 beats) data lengths for two case studies used in this study.
Data lengthN Complexity measure Elderly vs. Young r/M,m(AUCmax) Healthy vs. Arrhythmia r/M,m(AUCmax) 50 ApEn 1, 2(0.75) 0.9, 5(0.67) SampEn 1, 2(0.75) 1, 2(0.66) DistEn 100, 4(0.82) 200, 2(0.94) 1000 ApEn 0.8, 3(0.85) 1, 2(0.92) SampEn 0.8, 3(0.84) 0.3, 2(0.87) DistEn 2000, 5(0.82) 400, 5(0.93)
Supplementary Material). In addition, sinceDistEnwas initially developed with the aim of solving the parameter- and length-dependence ofApEnandSampEn, we restricted the comparisons to onlyApEnandSampEnin the current study. However, other measures, e.g., Lyapunov exponent, fractal dimension, recurrent quantification analysis based measures, and moment statistics, may also potentially be comparative algorithms. Although the study reported synthetic signal generated using logistic map with chaotic and periodic regimes, performance of DistEn in distinguish other chaotic and random behaviors are shown in Figures S1, S2 (Supplementary Material). Finally, it should be noted that the method we have applied to assess the distribution property—the estimation of empirical probability density—is exactly the first trial in order to prove our initial assumption, that is, complexity of time series can be more robustly assessed by taking full advantages of the distribution property of inter-vector distances (Li et al., 2015). The current study has given us chance to understand more about the performance of DistEn and its
possible limitations, e.g., how estimation of empirical probability density affects the outcome. Further exploration in this regard should be warranted to improve theDistEnmeasurement.
The complexity or irregularity in HRV is a long established bio-marker to evaluate health status (Lipsitz and Goldberger, 1992) and the recent studies with HRV measurement has shown the capacity of predicting the future health status using it (Van Gestel et al., 2011; Hsiung et al., 2015). This study analyses the comprehensive characteristics of different entropy measures for short-length HRV series, which will be of significant help in selecting appropriate entropy measure and its parameters for future applications.
AUTHOR CONTRIBUTIONS
CK, RU, and PL contributed to the conceptualization, data analysis and interpretation of results. CK drafted the manuscript. PL, SV, and MP critically revised the significant intellectual content of the work. All authors approved the final version of the manuscript.
ACKNOWLEDGMENTS
CK would like to thank Central Research Grant Scheme (CRGS), Deakin University (RM 31139) for funding to carry out the research work. PL would like to thank Shandong Provincial Natural Science Foundation (ZR2015FQ016) for their help in carrying out the research work.
SUPPLEMENTARY MATERIAL
The Supplementary Material for this article can be found online at: http://journal.frontiersin.org/article/10.3389/fphys. 2017.00720/full#supplementary-material
REFERENCES
Acharya, U. R., Joseph, K. P., Kannathal, N., Lim, C. M., and Suri, J. S. (2006). Heart rate variability: a review. Med. Biol. Eng. Comput. 44, 1031–1051. doi: 10.1007/s11517-006-0119-0
Acharya U. R., Kannathal, N., Ong Wai, S., Luk Yi, P., and TjiLeng, C. (2004). Heart rate analysis in normal subjects of various age groups.Biomed. Eng. Online3, 24–28. doi: 10.1186/1475-925X-3-24
Castiglioni, P., and Di Rienzo, M. (2008). How the threshold r influences approximate entropy analysis of heart-rate variability.Comput. Cardiol.4, 561–564. doi: 10.1109/CIC.2008.4749103
Chen, W., Zhuang, J., Yu, W., and Wang, Z. (2009). Measuring complexity using fuzzyen, apen, and sampen. Med. Eng. Phys. 31, 61–68. doi: 10.1016/j.medengphy.2008.04.005
Costa, M., Goldberger, A. L., and Peng, C.-K. (2002). Multiscale entropy analysis of complex physiologic time series. Phys. Rev. Lett. 89:068102. doi: 10.1103/PhysRevLett.89.068102
Estela, K.-B., Mark, R., Paul, F., and Joseph, R. (1995). Heart rate variability in health and disease.Scand. J. Work. Environ. Health21, 85–95.
Goldberger, A. L., Amaral, L. A. N., Glass, L., Hausdorff, J. M., Ivanov, P. C., Mark, R. G., et al. (2000). PhysioBank, PhysioToolkit, and PhysioNet: Components of a new research resource for complex physiologic signals.Circulation101, e215–e220. doi: 10.1161/01.CIR.101.23.e215
Hanley, J. A., and McNeil, B. J. (1982). The meaning and use of the area under a receiver operating characteristic (roc) curve.Radiology143, 29–36. doi: 10.1148/radiology.143.1.7063747
Hsiung, D.-Y., Liu, C.-W., Cheng, P.-C., and Ma, W.-F. (2015). Original article: using non-invasive assessment methods to predict the risk of metabolic syndrome.Appl. Nursing Res.28, 72–77. doi: 10.1016/j.apnr.2014.12.001 Huikuri, H. V., Makikallio, T., Airaksinen, K., Mitrani, R., Castellanos, A., and
Myerburg, R. J. (1999). Measurement of heart rate variability: a clinical tool or a research toy?J. Am. Coll. Cardiol.34, 1878–1883. doi: 10.1016/S0735-1097(99)0 0468-4
Iyengar, N., Peng, C.-K., Morin, R., Goldberger, A. L., and Lipsitz, L. A. (1996). Age-related alterations in the fractal scaling of cardiac interbeat interval dynamics.Am. J. Physiol.71(4 Pt 2), R1078–R1084.
Kaplan, D., Furman, M., and Pincus, S. (1990). “Techniques for analyzing complexity in heart rate and beat-to-beat blood pressure signals,” 1990 Proceedings Computers in Cardiology(Chicago, IL), 243.
Karmakar, C., Udhayakumar, R. K., and Palaniswami, M. (2015). “Distribution entropy (disten): a complexity measure to detect arrhythmia from short length rr interval time series,”2015 37th Annual International Conference of the IEEE Engineering in Medicine & Biology Society (EMBC)(Milan), 5207.
Kemp, A. H., and Quintana, D. S. (2013). Review: the relationship between mental and physical health: Insights from the study of heart rate variability.Int. J. Psychophysiol.89, 288–296. doi: 10.1016/j.ijpsycho.2013.06.018
Li, P., Liu, C., Li, K., Zheng, D., Liu, C., and Hou, Y. (2015). Assessing the complexity of short-term heartbeat interval series by distribution entropy.Med. Biol. Eng. Comput.53, 77–87. doi: 10.1007/s11517-014-1216-0
Lipsitz, L. A., and Goldberger, A. L. (1992). Loss of ’complexity’ and aging: potential applications of fractals and chaos theory to senescence.JAMA267, 1806–1809. doi: 10.1001/jama.1992.03480130122036
Liu, C., Liu, C., Shao, P., Li, L., Sun, X., Wang, X., et al. (2011). Comparison of different threshold values r for approximate entropy: application to investigate the heart rate variability between heart failure and healthy control groups. Physiol. Meas.32:167. doi: 10.1088/0967-3334/32/2/002
Lu, S., Chen, X., Kanters, J. K., Solomon, I. C., and Chon, K. H. (2008). Automatic selection of the threshold value for approximate entropy.IEEE Trans. Biomed. Eng.55, 1966–1972. doi: 10.1109/TBME.2008.919870
Mayer, C. C., Bachler, M., Hörtenhuber, M., Stocker, C., Holzinger, A., and Wassertheurer, S. (2014). Selection of entropy-measure parameters for knowledge discovery in heart rate variability data. BMC Bioinformatics 15(Suppl. 6):S2. doi: 10.1186/1471-2105-15-S6-S2
Mitchell, M. (2009).Complexity. [Electronic resource] : A Guided Tour.Oxford: Oxford University Press.
Moody, G. B., and Mark, R. G. (2001). The impact of the mit-bih arrhythmia database.IEEE Eng. Med. Biol. Magazine Q. Magaz. Eng. Med. Biol. Soc.20, 45–50. doi: 10.1109/51.932724
Pincus, S. M. (1991). Approximate entropy as a measure of system complexity. Proc. Natl. Acad. Sci. U.S.A.88, 2297–2301. doi: 10.1073/pnas.88.6.2297 Pincus, S. M., Gladstone, I. M., and Ehrenkranz, R. A. (1991). A regularity statistic
for medical data analysis.J. Clin. Monit.7, 335–345. doi: 10.1007/BF01619355 Pincus, S. M., and Goldberger, A. L. (1994). Physiological time-series analysis: what
does regularity quantify?Am. J. Physiol.266, H1643–H1643.
Richman, J., and Moorman, J. (2000). Physiological time-series analysis using approximate entropy and sample entropy.Am. J. Physiol.278, H2039–H2049. Sandercock, G. R., Bromley, P. D., and Brodie, D. A. (2005). Review: the reliability
of short-term measurements of heart rate variability. Int. J. Cardiol. 103, 238–247. doi: 10.1016/j.ijcard.2004.09.013
Sgoifo, A., Carnevali, L., Alfonso Mde, L., and Amore, M. (2015). Autonomic dysfunction and heart rate variability in depression. Stress 18, 343–352. doi: 10.3109/10253890.2015.1045868
Thayer, J. F., Yamamoto, S. S., and Brosschot, J. F. (2010). Review: The relationship of autonomic imbalance, heart rate variability and cardiovascular disease risk factors.Int. J. Cardiol.141, 122–131. doi: 10.1016/j.ijcard.2009. 09.543
Udhayakumar, R. K., Karmakar, C., Li, P., and Palaniswami, M. (2015). “Effect of data length and bin numbers on distribution entropy (disten) measurement in analyzing healthy aging,” in2015 37th Annual International Conference of the IEEE Engineering in Medicine & Biology Society (EMBC)(Milan), 7877. doi: 10.1109/EMBC.2015.7320218
Van Gestel, A. J. R., Kohler, M., Steier, J., Teschler, S., Russi, E. W., and Teschler, H. (2011). Cardiac autonomic dysfunction and health-related quality of life in patients with chronic obstructive pulmonary disease.Respirology16, 939–946. doi: 10.1111/j.1440-1843.2011.01992.x
Walsh, J. A. III, Topol, E. J., and Steinhubl, S. R. (2014). Novel wireless devices for cardiac monitoring. Circulation 130, 573–581. doi: 10.1161/CIRCULATIONAHA.114.009024
Xie, H.-B., He, W.-X., and Liu, H. (2008). Measuring time series regularity using nonlinear similarity-based sample entropy.Phys. Lett. A372, 7140–7146. doi: 10.1016/j.physleta.2008.10.049
Yentes, J. M., Hunt, N., Schmid, K. K., Kaipust, J. P., McGrath, D., and Stergiou, N. (2013). The appropriate use of approximate entropy and sample entropy with short data sets.Ann. Biomed. Eng.41, 349–365. doi: 10.1007/s10439-012-0668-3
Conflict of Interest Statement: The authors declare that the research was
conducted in the absence of any commercial or financial relationships that could be construed as a potential conflict of interest.
Copyright © 2017 Karmakar, Udhayakumar, Li, Venkatesh and Palaniswami. This is an open-access article distributed under the terms of the Creative Commons Attribution License (CC BY). The use, distribution or reproduction in other forums is permitted, provided the original author(s) or licensor are credited and that the original publication in this journal is cited, in accordance with accepted academic practice. No use, distribution or reproduction is permitted which does not comply with these terms.