1
E S T A D Í S T I C A S D E L A
FORE
)uadros 1980 1984
Tabel 1980-1984
Tabellen 19801984
Πίνακες 1980-1984
Tables 1980-1984
ESTATISTI
Tableaux 1980 —1984
avole 1980-1984
Tabellen 1980-1984
Quadros 1980-1984
I
Agriculture, forestry and fisheriesAgriculture, sylviculture et pêche
eurostat
OFICINA ESTADÍSTICA DE LAS COMUNIDADES EUROPEAS DE EUROPÆISKE FÆLLESSKABERS STATISTISKE KONTOR STATISTISCHES AMT DER EUROPÄISCHEN GEMEINSCHAFTEN ΣΤΑΤΙΣΤΙΚΗ ΥΠΗΡΕΣΙΑ ΤΩΝ ΕΥΡΩΠΑΪΚΩΝ ΚΟΙΝΟΤΗΤΩΝ STATISTICAL OFFICE OF THE EUROPEAN COMMUNITIES OFFICE STATISTIQUE DES COMMUNAUTÉS EUROPÉENNES ISTITUTO STATISTICO DELLE COMUNITÀ EUROPEE
BUREAU VOOR DE STATISTIEK DER EUROPESE GEMEENSCHAPPEN SERVIÇO DE ESTATÍSTICA DAS COMUNIDADES EUROPEIAS
L2920 Luxembourg Tél. 43011 Télex : Comeur Lu 3423
B1049 Bruxelles, bâtiment Berlaymont, rue de la Loi 200 (bureau de liaison) Tél. 2351111
Las publicaciones de Eurostat están clasificadas por temas y por series. La clasificación se encuentra al final de la obra. Para mayor información sobre las publicaciones, rogamos se pongan en contacto con Eurostat.
Para los pedidos, diríjanse a las oficinas de venta cuyas direcciones figuran en la página interior de la contracubierta.
Eurostats publikationer er klassificeret efter emne og serie. En oversigt herover findes bag i hæftet. Yderligere oplysninger om publikationerne kan fås ved henvendelse til Eurostat.
Bestilling kan afgives til de salgssteder, der er anført på omslagets side 3.
Die Veröffentlichungen von Eurostat sind nach Themenkreisen und Reihen gegliedert. Die Gliederung ¡st hinten in jedem Band aufgeführt. Genauere Auskünfte über die Veröffentlichungen erteilt Eurostat. Ihre Bestellungen richten Sie bitte an die Verkaufsbüros, deren Anschriften jeweils auf der dritten Umschlagseite der Veröffentlichungen zu finden sind.
Οι εκδόσεις της Eurostat ταξινομούνται κατά θέμα και κατά σειρά. Η ακριβής ταξινόμηση αναφέρεται στο
τέλος κάθε έκδοσης. Για λεπτομερέστερες πληροφορίες σχετικά με τις εκδόσεις, μπορείτε να απευθύνεσθε στην Eurostat.
Για τις παραγγελίες μπορείτε να απευθύνεσθε στα γραφεία πώλησης, των οποίων οι διευθύνσεις αναγράφονται στη σελίδα 3 του εξωφύλλου.
Eurostat's publications are classified according to themes and series. This classification is indicated at the end of the publication. For more detailed information on publications, contact Eurostat.
Orders are obtainable from the sales offices mentioned on the inside back cover.
Les publications de l'Eurostat sont classées par thème et par série. Cette classification est précisée à la fin de l'ouvrage. Pour des informations plus détaillées sur les publications, contactez l'Eurostat.
Pour les commandes, adressez-vous aux bureaux de vente dont les adresses sont indiquées à la page 3 de la couverture.
Le pubblicazioni dell'Eurostat sono classificate per tema e per serie. Tale classificazione è precisata alla fine dell'opera. Per informazioni più dettagliate sulle pubblicazioni rivolgersi all'Eurostat.
Per eventuali ordinazioni rivolgersi a uno degli uffici di vendita i cui indirizzi figurano nella 3° pagina della copertina.
De publikaties van Eurostat zijn ingedeeld naar onderwerp en serie. Deze indeling is achter in het boek opgenomen. Voor nadere informatie over de publikaties kunt u zich wenden tot Eurostat.
Gelieve bestellingen op te geven bij de verkoopbureaus, waarvan de adressen op bladzijde 3 van de omslag zijn vermeld.
As publicações do Eurostat estão classificadas por tema e por série. Esta classificação está indicada no fim da obra. Para mais informações sobre as publicações é favor contactar Eurostat.
ESTADÍSTICAS DE LA SILVICULTURA
Cuadros 19801984
SKOVBRUGSSTATISTIK
Tabel 19801984
FORSTSTATISTIK
Tabellen 19801984
ΔΑΣΙΚΕΣ ΣΤΑΤΙΣΤΙΚΕΣ
Πίνακες 1980-1984
FORESTRY STATISTICS
Tables 1980-1984
STATISTIQUES FORESTIÈRES
Tableaux 1980-1984
STATISTICHE FORESTALI
Tavole 1980-1984
BOSSTATISTIEK
Tabellen 1980-1984
Una ficha bibliográfica figura al final de la obra Bibliografiske data findes bagest i denne publikation
Bibliographische Daten befinden sich am Ende der Veröffentlichung
Βιβλιογραφικό σημείωμα δίδεται στο τέλος του βιβλίου Cataloguing data can be found at the end of this publication Une fiche bibliographique figure à la fin de l'ouvrage Una scheda bibliografica figura alla fine del volume
Bibliografische data bevinden zich aan het einde van deze publikatie Urna ficha bibliográfica figura no fim da obra
Luxembourg: Office des publications officielles des Communautés européennes, 1987 ISBN 92-825-6943-8
Kat./cat: CA-47-86-494-9A-C
© CECA-CEE-CEEA, Bruxelles · Luxembourg, 1987
Reproduction autorisée, sauf à des fins commerciales, moyennant indication de la source.
índice
1. Resumen de la silvicultura de la CE
1.1. Superficie de bosque, superficie total y población residente 59
1.2. Envergadura media de las empresas forestales 59 1.3. Distribución de la superficie de bosque según la categoría de la propiedad 59
1.4. Parte de los distintos Estados miembros en la producción de madera de la CE 59
1.5. Producción de madera por hectárea 59 1.6. Abastecimiento de madera en bruto 60 1.7. Importaciones netas de madera aserrada y traviesas para vías férreas 60
1.8. Estadísticas forestales por unidades territoriales estadísticas 61
2. Estructura de los bosques
2.1. Distribución de la superficie de bosque 65 2.2. Distribución de la superficie de bosque según la categoría de la propiedad ·. 66
2.3. Distribución de la superficie de bosque según el beneficio silvícola 67 2.4. Distribución de la superficie de bosque según la categoría de la propiedad y el beneficio silvícola 68
2.5. Número de empresas forestales según la categoría de la propiedad y la clase de los terrenos 69 2.6. Superficie de bosque según la categoría de la propiedad y la clase de extensión de los terrenos 70
2.7. Superficie de monte alto según los grupos de especies de árboles y las clases de edad 71 2.8. Material dejado en pie, incremento, posibilidades y programas de tala según la categoría de la propiedad
y las especies de árboles 74
3. Producción de madera
3.1. Cálculos aproximados sobre la producción de madera: total de madera en bruto 76 3.2. Cálculos aproximados sobre la producción de madera: evolución, producción por hectárea, parte de los
Estados miembros en la producción 77 3.3. Cantidades anuales de madera en bruto retirada según la categoría de la propiedad 78
3.4. Cantidades anuales retiradas por categoría de madera en bruto (coniferas y frondosas) 79
3.5. Cantidades anuales de madera retirada 80 - 3.5.1. Trancoso madera de construcción 80
- 3.5.2. Madera para minas 80 - 3.5.3. Otras maderas largas 81 - 3.5.4. Total de maderas largas 81 - 3.5.5. Madera industrial apilada 82
- 3.5.6. Leña 82 - 3.5.7. Total de madera apilada 83
a
4. Balances de madera en bruto4.1. Balance del suministro del total de madera en bruto (sin partículas, virutas ni residuos de madera) 84
- UEBL 84 - Danmark 85 - BR, Deutschland 86
- Ellada 87 - France 88 - Ireland 89 - Italia 90 - Nederland 91 - United Kingdom 92
- EUR 10 93 4.4. Balance de suministro de madera para pasta a partir de partículas, virutas y residuos de madera 94
- UEBL y Danmark 94 - BR, Deutschland y Ellada 95
- France e Ireland 96 - Italia y Nederland 97 - United Kingdom y EUR 10 98
5. Comercio intracomunitário de madera en bruto
5.1. Importaciones 99 - Total de madera en bruto y madera larga 99
- Madera apilada y partículas, virutas, residuos de madera 100
5.2. Exportaciones 101 - Total de madera en bruto 101
- Madera apilada y partículas, virutas, residuos de madera 102
6. Balance de suministro de los principales productos de la madera (por países)
6.1. Importaciones, exportaciones, disponibilidades , 103
- UEBL 103 - Danmark 104 - BR, Deutschland 105
- Ellada 106 - France 107 - Ireland : 108
- Italia 109 - Nederland 110 - United Kingdom 111
- EUR 10 112
7. Consumo de madera para pasta por productos industriales
7.1. Pastas, tableros de fibras y de partículas 113
8. Incendios forestales
Nota preliminar
Metodología
La metodología de aplicación para las estadísticas forestales publicadas a continuación es objeto del volumen editado por Eurostat en la misma colección con el número E5, «Estadísticas forestales - metodología».
Peculiaridades de las tablas «estructura de los bosques»:
Esta sección abarca los datos disponibles más recientes, a saber:
Bélgica
- bosque de tala sometida a - bosque de tala no
Dinamarca R.F. de Alemania Grecia
España Francia Irlanda Italia
Luxemburgo Países Bajos Portugal Reino Unido
autorización estatal sometida a autorización estatal
2.1
1980 1970 1976 1961 1980 -1983 1984 1977 1984 1976 -1978
2.2
1980 1970 1976 1961 1980 -1983 1984 1977 1984 1976 -1978
2.3
1980 1970 1976 1961 1980 -1983 1984 1977 1984 1976 -1978
2.4
1980 1970 1976 1961 -1983 1977 1977 1975 1976 -1978
2.5
1982 1982 1976 1974 -1975 1977 1970 1975 1976 -1978
2.6
1982 1982 1976 1974 -1970 1977 1970 1973 1976 -1978
2.7
-1976 1961 -1977
-1973 1976 -1978
2.8
-1976 1961 -1977
a
Símbolos y abreviaturas empleados
Nulo
-Dato inferior a la mitad de la unidad empleada 0
Dato no disponible : Dato inseguro o estimado * Estimación de Eurostat '
Porcentaje % Madera en bruto equivalente (r)
Producto (madera en bruto no equivalente) (s)
Dato provisional prov./p Dato nuevo o revisado r
Tonelada métrica t
Hectárea ha
Conjunto de países miembros de la CEE (desde 1981 y antes de 1986) EUR 10 Conjunto de países miembros de la CEE (desde 1986) EUR 12
Oficina Estadística de las Comunidades Europeas Eurostat
Comunidades Europeas CE/EC Unión Económica Belgo-Luxemburguesa UEBL/BLEU/BLWU Organización de Cooperación y Desarrollo Económico OECD/OCDE
Organización de las Naciones Unidas para la Agricultura y la Alimentación FAO
Relación de notas
Β
1. Resumen de la silvicultura
IO
I2
Población residente el 31.12. 83.
Estadística del uso de las tierras: estado en 1983. Fuentes: FAO/CEE Ginebra.
Superficie de bosque cuyo acceso autoriza la ley (Estudio para la CEE).
Bosques estatales de propiedad pública, reuni dos en un solo tipo en Italia y el Reino Unido. Bosques estatales y de propiedad pública, reuni dos en un solo tipo en España, Portugal y el Reino Unido.
Incluido Hamburgo. Incluido Bremen.
Bosques estatales de Bayern y Hessen: período de t a l a i . 1 3 1 . 1 2 . 8 0 .
Reagrupado con años diversos.
Calculado sobre la base de las cantidades retira das con corteza.
Calculado sobre la base de la encuesta de los bosques privados de 1973.
4. Balances de madera en bruto
1 Residuos de madera no comunicados en 83/84 (RFA).
6. Balance de suministro de los principales productos de la madera
1 000 m3 (S) TDC ex 44.05. 1 000 m3 (S) TDC ex 44.07. 1000m3(S)TDCex44.14. 1000m3(S)TDCex44.15. 1 000 m3 TDC ex 44.18. 1 000 m3 TDC ex 44.11. 1000 Τ TDC ex 47.01.
7. Consumo de madera para pasta por productos industriales
1 Incluidas las pastas semimecánicas (UK). 2 Incluidas dentro de las pastas mecánicas (UK). 3 Bajo secreto estadístico.
2. Estructura de los bosques
Incluido en los bosques privados (UK).
Incluidos los bosques de propiedad pública (UK). Incluidos los montes medios (F).
Incluidas las clases de superficie anteriores no consignadas.
Según la encuesta ESSES 76/86 (F).
Total diferente de 2.1 según la encuesta ESSES
76/86 (F).
Otros bosques de tala sometida a autorización estatal (F).
Bosques de tala permitida (F).
3. Producción de madera
Chopo de madera larga incluido en otras frondo sas (RFA), otras frondosas de madera apilada incluidas en robles y hayas (RFA).
Incluido en los bosques privados (UK).
Incluidos los bosques de propiedad pública (UK). Madera para minas dentro de otras maderas lar gas (RFA).
8. Incendios forestales (datos de la FAO Ginebra)
1 El valor comercial se considera para el monte alto adulto; en cambio, el valor capitalizado futuro para el monte joven.
2 Cálculo del valor de rendimiento: éste corres ponde al valor del bosque dejado en pie, incluidos los gastos de repoblación forestal.
3 Cálculo del bosque destruido sobre la base del valor que figura en la escritura de venta.
4 Evaluación de los daños: gastos de las plantas y de la plantación en el momento de establecer el cultivo, más gastos de cultivo y de conservación, junto con los intereses capitalizados hasta el mo mento del incendio.
5 Valor del bosque destruido, más gastos de repo blación forestal.
6 Para el monte alto adulto se considera el valor co mercial correspondiente a la edad de explotación, deduciendo el precio de venta de los bosques da ñados; se añaden a esto los gastos de lucha con tra incendios. Para los bosques jóvenes se capita lizan los gastos de plantación.
Indholdsfortegnelse
1. Oversigt over EF's skovbrug
1.1. Skovbevokset areal, samlet areal og hjemmehørende befolkning 59
1.2. Skovbrugsbedrifternes gennemsnitsstørrelse 59 1.3. Opdeling af det skovbevoksede areal efter ejerforhold 59
1.4. Medlemsstaternes andel i EF's hugst 59
1.5. Hugst pr. hektar 59 1.6. Råtræsforsyning 60 1.7. Nettoimport af savskåret træ og banesveller 60
1.8. Skovstatistik efter statistiske arealenheder 61
2. Skovenes struktur
2.1. Opdeling af det skovbevoksede areal '. 65
2.2. Opdeling af det skovbevoksede areal efter ejerforhold 66 2.3. Opdeling af det skovbevoksede areal efter bedriftsform 67 2.4. Opdeling af det skovbevoksede areal efter ejerforhold og bedriftsform 68
2.5. Antal skovbrugsbedrifter efter ejerforhold og bedriftsstørrelsesklasser 69
2.6. Skovareal efter ejerforhold og bedriftsstørrelsesklasser 70 2.7. Højskovbestand efter træartsgrupper og aldersklasser 71 2.8. Stående vedmasse, tilvækst, hugstvolumen og hugstplan efter ejerforhold og træartsgrupper 74
3. Hugst
3.1. Hugstoversigter: råtræ i alt 76 3.2. Hugstoversigter: udvikling, hugst pr. hektar, medlemsstaternes andel i hugsten 77
3.3. Årligt fjernede mængder efter ejerforhold 78 3.4. Årligt fjernede mængder efter råtræssortimenter (nåletræer og løvtræer) 79
3.5. Årligt fjernede træmængder 80 - 3.5.1. kævler træmængder 80 - 3.5.2. grubetræ/minetømmer 80
- 3.5.3. andet tømmer 81 - 3.5.4. tømmer i alt 81 - 3.5.5. rummetertræ til industriel brug 82
- 3.5.6. brænde 82 - 3.5.7. rummetertræ i alt 83
4. Forsyningsbalancer for råtræ
4.1. Forsyningsbalance for råtræ i alt (undtagen træspåner, træflis og træaffald) 84
- UEBL 84 - Danmark 85 - Forbundsrepublikken Tyskland 86
- Grækenland 87 - Frankrig 88 - Irland 89 - Italien 90 - Nederlandene 91
- Det forenede Kongerige 92
- EUR 10 93 4.4. Forsyningsbalancer for træspåner, træflis og træaffald 94
- UEBL og Danmark 94 - Forbundsrepublikken Tyskland og Grækenland 95
- Frankrig og Irland 96 - Italien og Nederlandene 97 - Detforenede Kongerigeog EUR 10 98
5. Handel med råtræ inden for EF
5.1. Import 99 - råtræ i alt og tømmer 99
- rummetertræ og træspåner, træflis og træaffald 100
5.2. Eksport 101 - råtræ i alt og tømmer 101
- rummetertræ og træspåner, træflis og træaffald 102
6. Forsyningsbalancer for de vigtigste træprodukter (efter lande)
6.1. Import, eksport, til rådighed 103
- UEBL 103 - Danmark 104 - Forbundsrepublikken Tyskland 105
- Grækenland 1 °6
- Frankrig 107 - Irland 108 - Italien 109 - Detforenede Kongerige 110
- Nederlandene m - EUR 10 112
7. Papirtræsforbrug efter industriprodukter
7.1. Papirmasse, træfiberplader og spånplader 113
8. Skovbrande
8.1. Antal, areal, skadesbeløb 114 8.2. Brandårsager, kendte og ukendte 115
Indledende bemærkning
Metodologi:
De metodologiske forklaringer til den skovstatistik, som offentliggøres nedenfor, findes i publikationen »Skovstatistik - metodologi«, som Eurostat har udgivet i samme serie under nummeret E5.
Særlige bemærkninger til tabellerne vedrørende skovstrukturen:
Dette afsnit indeholder de senest foreliggende data:
Belgien
- forstmæssigt drevne skove - ikke forstmæssigt drevne skove Danmark
Forbundsrepublikken Tyskland Grækenland
Spanien Frankrig Irland Italien Luxembourg Nederlandene Portugal
Det forenede Kongerige
2.1 2.2 2.3 2.4 2.5 2.6 2.7 2.8
1980 1980 1980 1980 1982 1982 1970 1970 1970 1970 1982 1982
1976 1976 1976 1976 1976 1976 1976 1976 1961 1961 1961 1961 1974 1974 1961 1961 1980 1980 1980
1983 1983 1983 1983 1975 1970
1984 1984 1984 1977 1977 1977 1977 1977 1977 1977 1977 1977 1970 1970
1984 1984 1984 1975 1975 1973 1973 1973 1976 1976 1976 1976 1976 1976 1976 1976
Tegn og forkortelser
Nul
-Mindre end det halve af den anvendte enhed 0 Oplysninger foreligger ikke
Usikre eller anslåede tal i Skønsmæssigt angivet af Eurostat *
Procent % Råtræsækvivalent (r)
Produkt (ikke råtræsækvivalent) (s) Foreløbige tal , prov./p Nye eller korrigerede tal r
Metrisk ton t Hektar ha
EF-medlemsstaterne i alt (fra 1981 og før 1986) EUR10
EF-medlemsstaterne i alt (fra 1981) EUR12 De europæiske Fællesskabers statistiske Kontor Eurostat
De europæiske Fællesskaber CE/EC Belgisk-Luxembourgske Økonomiske Union UEBL/BLEU/BLWU Organisationen for økonomisk Samarbejde og Udvikling OECD/OCDE
FN's Levnedsmiddel- og Landbrugsorganisation FAO Den økonomiske Kommission for Europa ECE
Fodnoter
1. Overblik over EF's skovbrug
Hjemmehørende befolkning pr. 31.12. 83. Arealanvendelsesstatistik tilbage til 1983. Kilder: FAO/ECE, Genève.
Skovbevokset areal, hvortil offentligheden har adgang i henhold til lovgivningen (undersøgelse gennemført for Kommissionen for De euro pæiske Fællesskaber).
Statsskove og andre offentlige skove er blandet sammen for Italiens og Det forenede Kongeriges vedkommende.
Statsskove og andre offentlige skove er blandet sammen for Spaniens, Portugalsog Detforenede Kongeriges vedkommende.
Inkl. Hamborg. Inkl. Bremen.
Statsskovene i Bayern og Hessen: hugstperio den 1 . 1 . 3 1 . 1 2 . 1 9 8 0 .
Adderet på trods af at der er anvendt forskellige referenceperioder.
Beregnet på grundlag af fjernede mængder med bark.
(12) Beregnet på grundlag af privatskovsundersøgel seni1973.
(1) (2) (3) (4)
(5)
(6)
(7) (8) (9)
(10)
(11)
(4) Grubetræ/minetømmer medregnes under andet tømmer (Forbundsrepublikken Tyskland).
4. Forsyningsbalancer for råtræ
(1) Træaffald ikke oplyst i 83/84 (Forbundsrepublik ken Tyskland).
6. Forsyningsbalancer for de vigtigste træprodukter (i) 1 000 m3 (S) FTT ex 44.05.
Ρ) 1 000 m3 (S) FTT ex 44.07. (3) 1 000 m3 (S) FTT ex 44.14. (4) 1 000 m3 (S) FTT ex 44.15. (5) 1 000 m3 FTT ex 44.18. (4 1 000 m3 FTT ex 4 4 . 1 1 . C) 1 0 0 0 Τ FTT ex 4 7 . 0 1 .
7. Forbrug af papirtræ efter industriprodukter (1) Inkl. halvkemisk træmasse (Det forenede Konge
rige).
(2) Er medregnet under mekanisk træmasse (Det forenede Kongerige).
(3) Omfattet af statistisk fortrolighed. 2. Skovstruktur
(1) Medregnet under privatskove (Det forenede 8 Skovbrande (tal fra FAO, Genève) Kongerige).
(2) Inkl. offentlige skove (undt. statsskove) (Detfore nede Kongerige).
(3) Inkl. mellemskov (Frankrig).
(4) Inkl. de umiddelbart forudgående uoplyste arealklasser.
(5) I henhold til ESSESundersøgelsen 76/86 (Frankrig).
(6) Totalen er forskellig fra 2.1 s o m følge af ESSES undersøgelsen 76/86 (Frankrig).
Π Andre forstmæssigt drevne skove (Frankrig). (8) Ikkeforstmæssigt drevne skove (Frankrig).
3. Hugst
(1) Tømmer af poppel er medregnet under andre løvtræer (Forbundsrepublikken Tyskland), r u m metertræ fra andre løvtræer er medregnet under egetræer og bøgetræer (Forbundsrepublikken Tyskland).
(2) Er medregnet under private skove (Det forenede Kongerige).
(3) Inkl. offentlige skove (undt. statsskove) (Detfore nede Kongerige).
(1) Skaderne fastsættes for ældre højskoves v e d k o m m e n d e på basis af handelsværdien, for ungskoves v e d k o m m e n d e p å basis af den k a p i taliserede værdi af det fremtidige udbytte. (2) Vurdering af udbytteværdien: svarer ca. til ny
vækstens værdi plus genplantningsomkostnin ger.
(3) Opgørelse af d e ødelagte bestande på basis af værdien ved salg på r o d .
(4) Skadesopgørelser: udgifter til planter o g plante tidspunktet plus kultur o g dyrkningsomkost ninger m e d forrentning fremregnet til tidspunktet for skovbrandene.
(5) Den ødelagte t r æ m æ n g d e s værdi plus genplant ningsomkostninger.
(6) For ældre højskov beregnes handelsværdien p å tidspunktet for hugstperioden, reduceret m e d salgsværdien af d e eventuelt ikkeforbrændte stammer. Der tages hensyn til b r a n d b e k æ m p e l sesomkostningeme. For ungskoves v e d k o m mende fastsættes skaderne på basis af d e kapi taliserede beplantningsomkostninger.
Inhaltsverzeichnis
1. Die Forstwirtschaft der EG im Überblick
1.1. Forstfläche, Gesamtfläche und Wohnbevölkerung 59 1.2. Durchschnittliche Größe der Forstbetriebe 59 1.3. Aufteilung der Forstfläche auf die Eigentumsarten 59 1.4. Anteil der Mitgliedstaaten am Holzeinschlag der EG 59
1.5. Holzeinschlag je Hektar 59 1.6. Rohholzversorgung 60 1.7. Nettoimporte an Schnittholz und Bahnschwellen 60
1.8. Forststatistik nach statistischen Gebietseinheiten 61
2. Struktur der Forsten
2.1. Aufteilung der Forstfläche 65 2.2. Gliederung der Forstfläche nach Eigentumsarten 66
2.3. Gliederung der Forstfläche nach Betriebsarten 67 2.4. Gliederung der Forstfläche nach Eigentums- und Betriebsarten 68
2.5. Zahl der Forstbetriebe nach Eigentumsarten und Betriebsklassen 69 2.6. Forstflächen nach Eigentumsarten und Betriebsgrößenklassen 70 2.7. Hochwaldbestände nach Baumartengruppen und Altersklassen 71 2.8. Holzvorrat, Zuwachs, Hiebsatz und Einschlagsprogramm nach Eigentumsarten und Baumartengruppen 74
3. Holzeinschlag
3.1. Übersichten zum Holzeinschlag: Rohholz insgesamt 76 3.2. Übersichten zum Holzeinschlag: Entwicklung, Holzeinschlag je Hektar, Anteil der Mitgliedstaaten
am Holzeinschlag 77 3.3. Jährlich entnommene Rohholzmengen (Holzeinschlag) nach Eigentumsarten) 78
3.4. Jährlich entnommene Holzmengen (Holzeinschlag) nach Rohholzsortimenten (Nadel- und Laubholz) .... 79
3.5. Jährlich entnommene Mengen (Holzeinschlag) 80
- 3.5.1. Stammholz 80 - 3.5.2. Grubenholz 80 - 3.5.3. Anderes Langholz 81 - 3.5.4. Langholz insgesamt 81 - 3.5.5. Industrieschichtholz 82
- 3.5.6. Brennholz 82 - 3.5.7. Schichtholz insgesamt 83
Β
4. Rohholzbilanzen
4.1. Versorgungsbilanz für Rohholz, insgesamt (ohne Späne, Hackschnitzel und Holzabfälle) 84
UEBL/BLEU/BLWU 84
Danmark 85
BR Deutschland 86
Ellada 87
France 88
Ireland 89
- Italia 90
Nederland 91
United Kingdom 92
EUR 10 93
4.4. Versorgungsbilanz für Faserholz von Spänen, Hackschnitzeln und Holzabfällen 94
UEBL/BLEU/BLWU und Danmark 94
BR Deutschland und Ellada 95
France und Ireland 96
Italia und Nederland 97
United Kingdom und EUR 10 98
5. EGBinnenhandel mit Rohholz
5.1. Einfuhr 99
Rohholz insgesamt und Langholz 99
Schichtholz und Späne, Hackschnitzel, Holzabfälle 100
5.2. Ausfuhr 101
Rohholz insgesamt und Langholz 101
Schichtholz und Späne, Hackschnitzel, Holzabfälle 102
6. Versorgungsbilanz für die wichtigsten Holzerzeugnisse (nach Ländern)
6.1. Einfuhr, Ausfuhr, Verfügbarkeiten 103
UEBL/BLEU/BLWU 103
Danmark 104
BR Deutschland 105
Ellada 106
France 107
Ireland 108
- Italia 109
Nederland 110
United Kingdom 111
EUR 10 112
7. Faserholzverbrauch nach Industrieerzeugnissen
7.1. Zellstoff, Holzfaserund Spanplatten 113
8. Waldbrände
8.1. Zahl, Fläche und Betrag der Schäden 114
8.2. Bekannte, unbekannte Ursachen der Waldbrände 115
Vorbemerkung
Methodologie
Die Anwendungsmethodologie für die im folgenden veröffentlichte Forststatistik ist Gegenstand des von Eurostat herausgegebenen, in der gleichen Reihe unter der Nr. E5 erschienenen Bandes „Forststatistik - Methodologie".
Besonderheiten der Tabellen über die „Struktur der Forsten"
Dieser Abschnitt umfaßt entsprechend folgender Übersicht die jeweils jüngsten verfügbaren Daten:
Belgien
- „reglementierter' Wald - nicht „reglementierter" Wald Dänemark
BR Deutschland Griechenland Spanien Frankreich Irland Italien Luxemburg Niederlande Portugal
Vereinigtes Königreich
2.1
1980 1970 1976 1961 1980 -1983 1984 1977 1984 1976 -1978
2.2
1980 1970 1976 1961 1980 -1983 1984 1977 1984 1976 -1978
2.3
1980 1970 1976 1961 1980 -1983 1984 1977 1984 1976 -1978
2.4
1980 1970 1976 1961 -1983 1977 1977 1975 1976 -1978
2.5
1982 1982 1976 1974 -1975 1977 1970 1975 1976 -1978
2.6
1982 1982 1976 1974 -1970 1977 1970 1973 1976 -1978
2.7
-1976 1961 -1977
-1973 1976 -1978
2.8
-1976 1961 -1977
Verwendete Zeichen und Abkürzungen
Nichts
-Weniger als die Hälfte der verwendeten Einheit 0
Kein Nachweis vorhanden :
Unsichere oder geschätzte Angabe *
Schätzung des Eurostat *
Prozentsatz % Rohholzäquivalent (r) Erzeugnis (nicht Rohholzäquivalent) (s)
Vorläufige Angabe prov./p Neu aufgenommene oder berichtigte Angabe r
Metrische Tonne t
Hektar ha Mitgliedsländer, insgesamt (zwischen 1981 und 1986) EUR10
Mitgliedsländer, insgesamt (ab 1986) EUR12 Statistisches Amt der Europäischen Gemeinschaften Eurostat
Europäische Gemeinschaften CE/EC Belgisch-Luxemburgische Wirtschaftsunion UEBL/BLEU/BLWU Organisation für wirtschaftliche Zusammenarbeit und Entwicklung OECD/OCDE
Food and Agriculture Organization of the United Nations FAO
Wirtschaftskommission für Europa ECE
Verzeichnis der Fußnoten
1. Die Forstwirtschaft im Überblick
(1) Wohnbevölkerung am 3 1 . 12. 1983. (2) Bodennutzungsstatistik: Stand 1983. (3) Quelle: FAO/ECE, Genf.
Forstfläche, deren Betreten Spaziergängern ge setzlich erlaubt ist (EGStudie).
Für Italien und das Vereinigte Königreich Staats wald und Wald von Körperschaften des öffent lichen Rechts insgesamt.
Für Spanien, Portugal und das Vereinigte König reich Staatswald und Wald von Körperschaften des öffentlichen Rechts insgesamt.
Einschließlich Hamburg. Einschließlich Bremen.
Bayerischer und Hessischer Staatswald: Ein schlagszeitraum 1 . 1 . 3 1 . 1 2 . 1 9 8 0 .
Verschiedene Jahre addiert.
Geschätzt auf der Grundlage von Mengenan gaben „mit Rinde".
Geschätzt auf der Grundlage der Privatwald erhebung 1973.
(4) (
(6)
(7)
(8)
(9)
(10)
(, 1) 12'
4. Rohholzbilanzen
(1) Holzabfälle für 1983/84 nicht mitgeteilt (D).
6. Versorgungsbilanzen für die wichtigsten Holzerzeugnisse
(1) 1 000 m3 (s) GZT Nr. ex 44.05. (2) 1 000 m3 (s) GZT Nr. ex 44.07. (3)
(4) (5) (6) (7)
1 000 m° (s) GZT Nr. ex 44.14. 1 000 m3(s) GZT Nr. ex 44.15. 1000 m3 GZT Nr. ex 44.18. 1000 m3 GZT Nr. ex 44.11. 1000 Τ GZT Nr. ex 4 7 . 0 1 .
7. Faserholzverbrauch nach Industrieerzeugnissen
C) Einschließlich halbchemischen Zellstoffs (Verei nigtes Königreich).
(2) In „Holzschliff" enthalten (Vereinigtes König reich).
(3) Unterliegt dem Statistikgeheimnis.
2. Struktur der Forsten
(1) (2) (3) (4) (5) (6) (7) (8)
In Privatwald enthalten (Vereinigtes Königreich). Einschließlich Wald der Körperschaften des öffentlichen Rechts (Vereinigtes Königreich). Einschließlich Mittelwald (F).
Einschließlich der unmittelbar vorangehenden Flächenarten, überdie keine Angaben vorliegen. Erhebung ESSES 76/86 (F).
Gesamtfläche abweichend von 2.1 aufgrund der Erhebung ESSES 76/86 (F).
Sonstiger reglementierter Wald (F). Nicht reglementierter Wald (F).
3. Holzeinschlag
(1) Pappellangholz in „andere Laubbäume" ent halten (D), Schichtholz anderer Laubbäume in „Eichen und Buchen" enthalten (D).
(2) In „Privatwald" enthalten (Vereinigtes König reich).
(3) Einschließlich Wald von Körperschaften des öffentlichen Rechts (Vereinigtes Königreich). (4) Grubenholz in „anderes Langholz" enthalten (D).
8. Waldbrände (Zahlen von der FAO, Genf)
(1) Der Schaden wird bei älterem Hochwald unter Zugrundelegung des Handelswertes, bei Jung holz auf der Grundlage des kapitalisierten z u künftigen Wertes festgestellt.
(2) Schätzung des Ertragswertes: Entspricht etwa dem Wert des Aufwuchses zuzüglich der Kosten der Wiederaufforstung.
(3) Schadensermittlung der zerstörten Bestände anhand des Handelswertes beim Verkauf auf dem Stock.
(4) Schadensbewertung: Kosten der Pflanzen und Pflanzkosten zum Zeitpunkt der Kulturbegrün dung, zuzüglich Kultur und Pflegekosten, mit Verzinsung fortgeschrieben auf den Zeitpunkt des Waldbrandes.
(5) Wert der zerstörten Holzmasse, zuzüglich Wie deraufforstungskosten.
(6) Bei älterem Hochwald wird der Handelswert zum Zeitpunkt der Hiebreife zugrunde gelegt, vermin dert um den Verkaufswert der eventuell nicht ver brannten Stämme. Die Kosten der Brandbe kämpfung werden berücksichtigt. Beim Jung holz wird der Schaden auf der Grundlage der ka pitalisierten Kulturkosten festgestellt.
Πίνακας περιεχομένων
1. Η δασοκομία των ΕΚ περιληπτικά
1.1 Δασική επιφάνεια, ολική επιφάνεια και διαμένων πληθυσμός 59
1.2 Μέσο μέγεθος των δασικών επιχειρήσεων 59
1.3 Κατανομή της δασικής επιφάνειας κατά μορφή ιδιοκτησίας 59
1.4 Συμμετοχή των διαφόρων κρατών μελών στην παραγωγή ξύλου ΕΚ 59
1.5 Παραγωγή ξύλου ανά εκτάριο 59
1.6 Προμήθειες ακατέργαστης ξυλείας 60
1.7 Καθαρές εισαγωγές πριστής ξυλείας και στρωτήρων για σιδηροτροχιές 60
1.8 Δασικές στατιστικές ανά στατιστικές εδαφικές μονάδες 61
2. Διάρθρωση των δασών
2.1 Κατανομή της δασικής επιφάνειας 65
2.2 Κατανομή της δασικής επιφάνειας κατά μορφή ιδιοκτησίας 66
2.3 Κατανομή της δασικής επιφάνειας κατά δασολογική επεξεργασία 67
2.4 Κατανομή της δασικής επιφάνειας κατά μορφή ιδιοκτησίας και δασολογική επεξεργασία 68
2.5 Αριθμός δασικών επιχειρήσεων κατά μορφή ιδιοκτησίας και τάξη των μονάδων 69
2.6 Δασική επιφάνεια κατά μορφή ιδιοκτησίας και τάξη μεγέθους των μονάδων 70
2.7 Επιφάνεια σπερμοφυών δασών κατά ομάδες ειδών δασικών δένδρων και τάξεις ηλικίας 71
2.8 Υλικό πριν την υλοτόμηση, αύξηση, δυνατότητες και προγράμματα υλοτομίας κατά μορφή
ιδιοκτησίας και είδη δασικών δένδρων 74
3. Παραγωγή ξύλου
3.1 Συνοπτικά στοιχεία σχετικά με την παραγωγή ξύλου: συνολική ακατέργαστη ξυλεία 76
3.2 Συνοπτικά στοιχεία σχετικά με την παραγωγή ξύλου: εξέλιξη, παραγωγή ανά εκτάριο, συμμετοχή
των κρατών μελών στην παραγωγή 77
3.3 Ετήσιες ποσότητες υλοτομημένης ακατέργαστης ξυλείας κατά μορφή ιδιοκτησίας 78
3.4 Ετήσιες ποσότητες υλοτομημένης ξυλείας ανά κατηγορία ακατέργαστης ξυλείας (κωνοφόρα και
πυκνόφυλλα) 79
3.5 Ετήσιες ποσότητες υλοτομημένης ξυλείας 80
— 3.5.1 κορμοί δένδρων ή ξυλεία προς κατεργασία 80
— 3.5.2 ξύλα ορυχείων 80
— 3.5.3 άλλη μακρά ξυλεία 81
— 3.5.4 ολική μακρά ξυλεία 81
— 3.5.5 στοιβαγμένη βιομηχανική ξυλεία 82
— 3.5.6 καυσόξυλα 82
— 3.5.7 ολική στοιβαγμένη ξυλεία 83
M
4. Ισολογισμοί ακατέργαστης ξυλείας
4.1 Ισολογισμός προμήθειας ολικής ακατέργαστης ξυλείας (εκτός από πλακίδια, μικρά τεμάχια και
υπολείμματα ξύλου) 84
— UEBL 84
— Δανία 85 — ΟΔ Γερμανίας 86
— Ελλάδα 87 — Γαλλία 88 — Ιρλανδία 89 — Ιταλία 90 — Κάτω Χώρες 91 — Ηνωμένο Βασίλειο 92
— EUR 10 93
4.4 Ισολογισμός προμήθειας ξυλείας για τρίψιμο από πλακίδια, μικρά τεμάχια και υπολείμματα
ξύλου 94
— UEBL και Δανία 94 — ΟΔ Γερμανίας και Ελλάδα 95
— Γαλλία και Ιρλανδία 96 — Ιταλία και Κάτω Χώρες 97 — Ηνωμένο Βασίλειο και EUR 10 98
5. Διακοινοτικό εμπόριο ακατέργαστης ξυλείας
5.1 Εισαγωγές 99 — ολική ακατέργαστη ξυλεία και μακρά ξυλεία 99
— στοιβαγμένη ξυλεία και πλακίδια, μικρά τεμάχια, υπολείμματα ξύλου 100
5.2 Εξαγωγές 101 — ολική ακατέργαστη ξυλεία και μακρά ξυλεία 101
— στοιβαγμένη ξυλεία και πλακίδια, μικρά τεμάχια, υπολείμματα ξύλου 102
6. Ισολογισμός προμήθειας κύριων καρπώσεων δάσους (ανά χώρα)
6.1 Εισαγωγές, εξαγωγές, διαθέσιμα 103
— UEBL 103
— Δανία 104 — ΟΔ Γερμανίας 105
— Ελλάδα 106 — Γαλλία 107 — Ιρλανδία 108 — Ιταλία 109
— Κάτω Χώρες 110
— Ηνωμένο Βασίλειο 111
— EUR 10 112
7. Κατανάλωση ξυλείας για τρίψιμο ανά βιομηχανικό προϊόν
7.1 Ξυλοπολτός, πλάκες-διαφράγματα από ίνες και μικρά τεμάχια ξύλου 113
8. Πυρκαγιές δασών
8.1 Αριθμός, εκτάσεις, μέγεθος ζημιών 114 8.2 Αιτίες πυρκαγιών, γνωστές και άγνωστες 115
Προκαταρκτική σημείωση
Μεθοδολογία:
Η μεθοδολογία εφαρμογής για τις δασικές στατιστικές που δημοσιεύονται παρακάτω περιγράφεται σε
Μεθ^ο^ία"
1"
0 8 1 3*
π°
υ α ν ή Κ ε ΐ aTT1V Í Õ i a σ υ λ λ 0 γ ή ( α ρ ι θ·
Ε 5) κ α ιτιτλοφορείται «Δασικές στατιστικές
-Ιδιαιτερότητες των πινάκων «διάρθρωση των δασών»:
Το τμήμα αυτό περιλαμβάνει τα πιο πρόσφατα διαθέσιμα στοιχεία, δηλαδή:
Βέλγιο
— δάση για τα οποία απαιτείται προηγούμενη
άδεια υλοτόμησης
— δάση για τα οποία δεν απαιτείται προηγού
μένη άδεια υλοτόμησης
Δανία
ΟΔ Γερμανίας
Ελλάδα
Ισπανία
Γαλλία
Ιρλανδία
Ιταλία
Λουξεμβούργο Κάτω Χώρες
Πορτογαλία
Ηνωμένο Βασίλειο
2.1 2.2 2.3 2.4 2.5 2.6 2.7 2.8
1980 1980 1980 1980 1982 1982
1970 1976 1961 1980
1983 1984 1977 1984 1976
1978
1970 1976 1961 1980
1983 1984 1977 1984 1976
1978
1970 1976 1961 1980
1983 1984 1977 1984 1976
1978
1970 1976 1961
-1983 1977 1977 1975 1976
1978
1982 1976 1974
-1975 1977 1970 1975 1976
1978
1982 1976 1974
-1970 1977 1970 1973 1976
1978
1976 1961
-1977
_
1973 1976
1978
_
1976 1961
-1977
1973 1976
Σύμβολα και συντομογραφίες που χρησιμοποιούνται
Μηδέν - , Στοιχείο μικρότερο από το μισό της χρησιμοποιούμενης μονάδας 0
Μη διαθέσιμο στοιχείο :
Αβέβαιο ή κατ' εκτίμηση στοιχείο Î
Εκτίμηση της Eurostat *
Ποσοστό % Ισοδύναμη ακατέργαστη ξυλεία (r)
Προϊόν (μη ισοδύναμη ακατέργαστη ξυλεία) (s)
Προσωρινό στοιχείο prov./p Νέο ή διορθωμένο στοιχείο r
Μετρικός τόνος t
Εκτάριο ha
Σύνολο των κρατών μελών των ΕΚ (από το 1981 έως το 1986) EUR 10 Σύνολο των κρατών μελών των ΕΚ (από το 1986) EUR 12
Στατιστική Υπηρεσία των Ευρωπαϊκών Κοινοτήτων Eurostat
Ευρωπαϊκές Κοινότητες CE/EC Οικονομική Ένωση Βελγίου-Λουξεμβούργου UEBL/BLEU/BLWU
Οργανισμός Οικονομικής Συνεργασίας και Ανάπτυξης OECD/OCDE Οργανισμός των Ηνωμένων Εθνών για τη διατροφή και τη γεωργία FAO
Οικονομική Επιτροπή για την Ευρώπη EOE
Κατάλογος σημειώσεων
1. Η δασοκομία περιληπτικά
Γ)
Η
(3)
(4)
(5)
(6)
(7)
(8)
(9)
(10)
(")
(12)
Διαμένων πληθυσμός στις 31.12.1983.
Στατιστική χρησιμοποίησης των γαιών: κα
τάσταση 1983.
Πηγές: FAO/EOK Γενεύη.
Δασική επιφάνεια στην οποία η πρόσβαση
επιτρέπεται με νόμο (Μελέτη για ΕΟΚ).
Εθνικά δάση και δάση οργανισμών τοπικής
αυτοδιοίκησης, συνολικά για την Ιταλία και
το Ηνωμένο Βασίλειο.
Εθνικά δάση και δάση οργανισμών τοπικής
αυτοδιοίκησης, συνολικά για την Ισπανία,
την Πορτογαλία και το Ηνωμένο Βασίλειο.
Συμπεριλαμβανομένου του Αμβούργου.
Συμπεριλαμβανομένης της Βρέμης.
Εθνικά δάση της Bayern και Hessen: περί
οδος υλοτομίας 1.1.-31.12.1980.
Αθροιστικά στοιχεία για διάφορα έτη.
Εκτίμηση με βάση τις υλοτομημένες ποσότη
τες με φλοιό.
Εκτίμηση με βάση έρευνα ιδιωτικών δασών,
το 1973.
2. Διάρθρωση των δασών
(
1) Συμπεριλαμβάνεται στα ιδιωτικά δάση
(Ηνωμένο Βασίλειο).
(2) Συμπεριλαμβανομένων των δασών οργα
νισμών τοπικής αυτοδιοίκησης (Ηνωμένο Βασίλειο).
(3) Συμπεριλαμβανομένης της διφυούς διαχει
ριστικής μορφής δάσους (Γαλλία).
(4) Συμπεριλαμβανομένων των αμέσως προη
γούμενων τάξεων επιφάνειας για τις οποίες δεν υπάρχουν στοιχεία.
(
5) Σύμφωνα με την έρευνα ESSES 76/86 (Γαλ
λία).
(
6) Σύνολο, διαφορετικό του 2.1, ως συνέπεια
της έρευνας ESSES 76/86 (Γαλλία).
(
7) Άλλα δάση για τα οποία απαιτείται προ
ηγούμενη άδεια υλοτόμησης (Γαλλία).
(
8) Δάση για τα οποία δεν απαιτείται προηγού
μενη άδεια υλοτόμησης (Γαλλία).
3. Παραγωγή ξύλου
(1) Λεύκη μακράς ξυλείας περιλαμβανόμενη σε
άλλα πυκνόφυλλα (ΟΔ Γερμανίας), άλλα πυκνόφυλλα στοιβαγμένης ξυλείας περι λαμβανόμενα σε δρύες και οξιές (ΟΔ Γερμα νίας).
(
2) Συμπεριλαμβάνεται σ τ α ιδιωτικά δάση
(Ηνωμένο Βασίλειο).
(3) Συμπεριλαμβανομένων των δασών των ορ
γανισμών τοπικής αυτοδιοίκησης (Ηνωμένο Βασίλειο).
(
4) Ξύλα ορυχείων σε άλλη μακρά ξυλεία (ΟΔ
Γερμανίας).
4. Ισολογισμοί ακατέργαστης ξυλείας
(
1) Υπολείμματα ξύλου που δεν διαβιβάστηκαν
το 83/84 (ΟΔ Γερμανίας).
6. Ισολογισμός προμήθειας των κύριων καρπώ σεων δάσους
(1) 1 000 m3 (S) ΚΔ ex 44.05.
(2) 1 000 m3 (S) ΚΔ ex 44.07.
(
3) 1 000 m
3(S) ΚΔ ex 44.14.
(
4) 1 000 m
3(S) ΚΔ ex 44.15.
(
5) 1 000 m
3ΚΔ ex 44.18.
(") 1 000 m
3ΚΔ ex 44.11.
Π 1 000 Τ ΚΔ ex 47.01.
7. Κατανάλωση ξυλείας για τρίψιμο ανά βιομηχα νικό προϊόν
(
1) Συμπεριλαμβανομένων ημιχημικών ξυλο
πολτών (Ηνωμένο Βασίλειο).
(
2) Συμπεριλαμβάνονται σε μηχανικούς ξυλο
πολτούς (Ηνωμένο Βασίλειο).
(
3) Καλύπτεται από στατιστικό απόρρητο.
8. Πυρκαγιές δασών (στοιχεία FAO—Γενεύη)
(1) Η εμπορική αξία εκτιμάται για τα
σπερ-μοφυή δάση των οποίων τα δένδρα έχουν αναπτυχθεί πλήρως, ενώ η μελλοντική κεφα-λοποιημένη αξία για τους νέους πληθυ σμούς.
(2) Εκτίμηση της αξίας απόδοσης: αυτή αντι
στοιχεί στην αξία της ξυλείας πριν την υλο-τόμηση, συμπεριλαμβανομένων των εξόδων αναδάσωσης.
(
3) Εκτίμηση τ η ς κατεστραμμένης ξυλείας με
βάση την αξία του πωλητηρίου πριν την
υλοτόμηση.
(4) Εκτίμηση των ζημιών: έξοδα φυτών και
φύτευσης κατά την έναρξη της καλλιέρ γειας, συν έξοδα καλλιέργειας και συντήρησης, με κεφαλαιοποιημένους τό κους μέχρι τη στιγμή της πυρκαγιάς.
(
5) Αξία της κατεστραμμένης ξυλείας, συν έξο
δα αναδάσωσης.
(
6) Για τα πλήρως ανεπτυγμένα σπερμοφυή
δάση, εκτιμήθηκε η εμπορική αξία που αντι
στοιχεί στην εκμεταλλεύσιμη ηλικία από την
οποία αφαιρείται η τιμή πώλησης των
δένδρων που έχουν υποστεί ζημιές· σ' αυτή
προσθέτονται τα έξοδα καταπολέμησης των
πυρκαγιών. Για τα νέα δάση,
κεφαλοποιήθη-καν τα έξοδα φύτευσης.
Table of contents
1. Forestry in the EC in brief
1.1. Wooded area, total area and resident population 59
1.2. Average size of forest holdings 59 1.3. Distribution of wooded area by type of ownership 59
1.4. Share of the Member States in EC wood production 59
1.5. Production of wood per hectare 59
1.6. Supplies of raw wood 60 1.7. Net imports of sawn wood and railway sleepers 60
1.8. Forestry statistics by territorial unit 61
2. Forest structure
2.1. Distribution of wooded area 65 2.2. Distribution of wooded area by type of ownership 66
2.3. Distribution of wooded area by type of silvicultural treatment 67 2.4. Distribution of wooded area by type of ownership and silvicultural treatment 68
2.5. Number of forestry holdings by type of ownership and class of holding 69 2.6. Area of forestry holdings by type of ownership and holding size class 70
2.7. Area of high forest by tree species and age class 71 2.8. Standing volume, growth, allowable and planned cut by type of ownership and tree species 74
3. Wood production
3.1. Summary of wood production: total raw wood 76 3.2. Summary of wood production: development, production per hectare, share of Member States
in production 77 3.3. Annual removals of raw wood by type of ownership 78
3.4. Annual removals by category of raw wood (conifers and non-conifers) 79
3.5. Annual removals 80 - 3.5.1. Logs or industrial wood 80
- 3.5.2. Pit props 80 - 3.5.3. Other longwood 81 - 3.5.4. Total longwood 81 - 3.5.5. Stackwood for industrial uses , 82
4. Raw wood balances
4.1. Supply balance sheet of total raw wood (excluding woodchip particles and residues) 84
- BLEU 84 - Denmark 85 - Federal Republic of Germany 86
- Greece 87 - France 88 - Ireland 89 - Italy 90 - The Netherlands 91
- United Kingdom 92
- EUR 10 93 4.4. Supply balance sheet for pulpwood made from woodchips, particles and wood residue 94
- BLEU 94 - Federal Republic of Germany and Greece 95
- France and Ireland 96 - Italy and the Netherlands 97 - United Kingdom and EUR 10 98
5. Intra-Community trade in raw wood
5.1. Imports 99 - Total raw wood and longwood 99
- Stackwood and woodchips, particles and residues 100
5.2. Exports 101 - Total raw wood and longwood 101
- Stackwood and woodchips, particles and residues 102
6. Supply balance sheet of the main wood products (by country)
6.1. Imports, exports, available stocks 103
- BLEU 103 - Denmark 104 - Federal Republic of Germany 105
- Greece 106 - France 107 - Ireland 108 - Italy 109 - The Netherlands 110
- United Kingdom 111
- EUR 10 112
7. Consumption of pulpwood by industrial product
7.1. Woodpulp, fibreboard and particle board 113
8. Forest fires
8.1. Numbers, areas, amount of damage 114 8.2. Causes of fires, known and unknown 115
Preliminary remarks
Methodology
The methodology used for the forestry statistics published below is dealt with in the Eurostat publication in the same series, E5 Forestry statistics - Methodology.
Special features of the forest structure tables
This section gives the most recent available data, namely:
Belgium
- Forests in public ownership - Forests in private ownership Denmark
FR of Germany Greece Spain France Ireland Italy
Luxembourg The Netherlands Portugal
United Kingdom
2.1
1980 1970 1976 1961 1980 -1983 1984 1977 1984 1976 -1978
2.2
1980 1970 1976 1961 1980 -1983 1984 1977 1984 1976 -1978
2.3
1980 1970 1976 1961 1980 -1983 1984 1977 1984 1976 -1978
2.4
1980 1970 1976 1961 -— 1983 1977 1977 1975 1976 -1978
2.5
1982 1982 1976 1974 -— 1975 1977 1970 1975 1976 -1978
2.6
1982 1982 1976 1974 -— 1970 1977 1970 1973 1976 -1978
2.7
— — 1976 1961 -— — 1977
-1973 1976 -1978
2.8
— — 1976 1961 -— -1977
Symbols and abbreviations
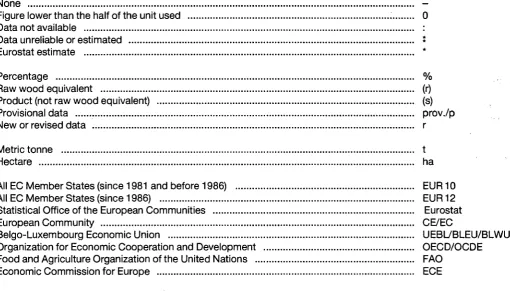
None
-Figure lower than the half of the unit used 0
Data not available : Data unreliable or estimated *
Eurostat estimate *
Percentage % Raw wood equivalent (r)
Product (not raw wood equivalent) (s)
Provisional data provVp New or revised data r
Metric tonne t Hectare ha
All EC Member States (since 1981 and before 1986) EUR 10
All EC Member States (since 1986) EUR12 Statistical Office of the European Communities Eurostat
European Community CE/EC Belgo-Luxembourg Economic Union UEBL/BLEU/BLWU Organization for Economic Cooperation and Development OECD/OCDE
Food and Agriculture Organization of the United Nations FAO
Economic Commission for Europe ECE
[image:32.595.43.554.126.417.2]Notes
1. Forestry in brief
Resident population on 31 December 1983. Statistics on land use: 1983.
Sources: FAO/ECE Geneva.
Wooded area access to which is authorized by law (CEC study).
5 State forests and forests in public ownership
combined for Italy and the United Kingdom.
6 State forests and forests in public ownership
combined for Spain, Portugal and the United Kingdom.
7 Including Hamburg. 8 Including Bremen.
9 State forests of Bavaria and Hessen: period of cut
1.1.-31.12.1980.
10 Grouped with various years.
11 Estimated on the basis of removals with bark. 12 Estimated on the basis of a survey on private
forests in 1973.
2. Forest structure
1 Included in private forests (United Kingdom). 2 Including forests in public ownership (United
Kingdom).
3 Including coppices with standards (France). 4 Including the next lowest area class which was not
surveyed.
5 According to the ESSES survey 1976/86 (France). 6 Total differs from that in 2.1 following an ESSES
survey 1976/86 (France).
7 Other forests in public ownership (France). 8 Forests in private ownership (France).
3. Wood production
Poplar longwood included in other non-coniferous species (FR of Germany), other non-coniferous stackwood included under oaks and beeches (FR of Germany).
Included in private forests (United Kingdom). Including forests in public ownership (United Kingdom).
Pitprops included in other longwood (FR of Ger-many).
4. Raw wood balance sheets
1 Figures on residue not forwarded in 1983/84 (FR
of Germany).
6. Supply balance sheet of the main wood products
1 000 nï3 (S) CCT ex 44.05.
1 000 m3 (S) CCT ex 44.07.
1000m3(S)CCTex44.14.
1000m3(S)CCTex44.15.
1000 m3 CCT ex 44.18.
1000 m3 CCT ex 44.11.
1 0001 CCT ex 47.01.
7. Consumption of pulpwood by industrial product
1 Including semi-chemical woodpulp (United
King-dom).
2 Included in mechanical woodpulp (United
King-dom).
3 Covered by statistical confidentiality.
8. Forest fires (figures from FAO - Geneva)
1 The commercial value is used for adult high forest,
but the future capitalized value for young stands.
2 Estimate of the yield value: this corresponds to the
value of the standing volume including reafforest-ation costs.
3 Estimate of wood destroyed on the basis of the
value when sold as standing volume.
4 Valuation of damage: cost of the plants and
plan-ting at the time of cultivation plus cultivation and maintenance costs with capital interest up to when the fire occurred.
5 Value of wood destroyed plus reafforestation
costs.
6 For adult high forest, the market value was taken
as that corresponding to the saleable age less the selling price of the damaged wood plus the costs of firefighting. For young stands the planting costs were capitalized.
7 If possible based on the capitalized yield value
Table des matières
1. La foresterie de la CE en bref
1.1. Superficie boisée, superficie totale et population résidente 59
1.2. Grandeur moyenne des entreprises forestières 59 1.3. Répartition de la superficie boisée selon la forme de propriété 59
1.4. Part des États membres dans la production de bois CE 59
1.5. Production de bois par hectare 59 1.6. Approvisionnement de bois brut 60 1.7. Importations nettes de sciages et de traverses pour voies ferrées 60
1.8. Statistiques forestières par unités territoriales statistiques 61
2. Structure des forêts
2.1. Répartition de la superficie boisée 65 2.2. Répartition de la superficie boisée selon la nature de la propriété 66
2.3. Répartition de la superficie boisée selon le traitement sylvicole 67 2.4. Répartition de la superficie boisée selon la nature de la propriété et le traitement sylvicole 68
2.5. Nombre d'entreprises forestières selon la nature de la propriété et la classe des unités 69 2.6. Superficie boisée selon la nature de la propriété et la classe de taille des unités 70 2.7. Superficie des futaies selon les groupes d'essences d'arbres et les classes d'âge 71 2.8. Matériel sur pied, accroissement, possibilités et programme d'abbatage selon la nature de la propriété et
les essences d'arbres 72
3. Production de bois
3.1. Aperçus sur la production de bois: bois brut total 76 3.2. Aperçus sur la production de bois: évolution, production par hectares, part des États membres dans la
production de bois CE 77 3.3. Quantités annuelles enlevées de bois brut selon la forme de propriété 78
3.4. Quantités annuelles enlevées par catégorie de bois brut (conifères et feuillus) 79
3.5. Quantités annuelles de bois enlevées: 80 - 3.5.1. Grumes ou bois d'œuvre 80
4. Bilans de bois brut
4.1. Bilan d'approvisionnement de bois brut total (sans plaquettes, particules et résidus de bois) 84
- UEBL 84 - Danemark 85 - RF d'Allemagne 86
- Grèce 87 - France 88 - Irlande 89 - Italie 90 - Pays-Bas .' 91
- Royaume-Uni 92 - EUR 10 93 4.4. Bilan d'approvisionnement de bois de trituration à partir de plaquettes, particules et résidus de bois .. 94
- UEBL 94 - RF d'Allemagne et Grèce 95
- France et Irlande 96 - Italie et Pays-Bas 97 - Royaume-Uni et EUR 10 98
5. Commerce intracommunautaire de bois brut
5.1. Importations: 99 - bois brut total 99 - bois longs 99 - bois empilés 100 - plaquettes, particules et résidus de bois 100
5.2. Exportations: 101 - bois brut total 101 - bois longs 101 - bois empilés ., 102
- plaquettes, particules et résidus de bois 102
6. Bilan d'approvisionnement des principaux produits du bois (par pays)
6.1. Importations, exportations et disponibilités 103
- UEBL 103 - Danemark 104 - RF d'Allemagne 105
- Grèce 106 - France 107 - Irlande 108 - Italie 109 - Pays-Bas 110 - Royaume-Uni 111 - EUR 10 112
7. Consommation de bois de trituration par produit industriel
7.1. Pâtes, panneaux de fibres et de particules 113
8. Incendies de forêts
8.1. Nombres, superficies, montant des dégâts 114 8.2. Causes des incendies; connues et inconnues 115
Remarque préliminaire
Méthodologie
La méthodologie d'application pour les statistiques forestières publiées ci-après fait l'objet du volume édité par Euro-stat dans la même collection sous le numéro E5 «Euro-statistiques forestières-méthodologie».
Particularités propres aux tableaux «structure des forêts»:
Cette section comprend les données les plus récentes disponibles, à savoir:
Belgique - forêt soumise - forêt non soumise Danemark
R F d'Allemagne Grèce
Espagne France Irlande Italie
Luxembourg Pays-Bas Portugal Royaume-Uni
2.1
1980 1970 1976 1961 1980
-1983 1984 1977 1984 1976
-1978
2.2
1980 1970 1976 1961 1980
-1983 1984 1977 1984 1976
-1978
2.3
1980 1970 1976 1961 1980
-1983 1984 1977 1984 1976
-1978
2.4
1980 1970 1976 1961
-1983 1977 1977 1975 1976
-1978
2.5
1982 1982 1976 1974
-1975 1977 1970 1975 1976
-1978
2.6
1982 1982 1976 1974
-1970 1977 1970 1973 1976
-1978
2.7
-1976 1961
-1977
-1973 1976
-1978
2.8
-1976 1961
-1977
-1973 1976
Signes et abréviations employés
Néant
-Donnée inférieure à la moitié de l'unité utilisée 0
Donnée non disponible : Donnée incertaine ou estimée * Estimation de l'Eurostat *
Pourcentage % Bois brut équivalent (r)
Produit (bois brut pas équivalent) (s)
Donnée provisoire prov./p Donnée nouvelle ou révisée r
Tonne métrique t
Hectare ha
Ensemble des pays membres des CE (depuis 1981 et avant 1986) EUR 10 Ensemble des pays membres des CE (depuis 1986) EUR 12
Office statistique des Communautés européennes Eurostat
Communautés européennes CE/EC Union économique belgo-luxembourgeoise UEBL/BLEU/BLWU Organisation de coopération et de développement économiques OECD/OCDE
Food and Agriculture Organization of the United Nations FAO
Commission économique pour l'Europe ECE
Liste des notes
1. La foresterie en bref 4. Bilans de bois brut
(1) Population résidente au 31 décembre 1983.
(2) Statistique de l'utilisation des terres: état 1983.
(3) Sources: FAO/CEE Genève.
(4) Superficie boisée dont l'accès est autorisé par la
loi (étude pour CCE).
Forêts domaniales et des collectivités de droit public confondues pour l'Italie et le Royaume-Uni.
Forêts domaniales et des collectivités de droit public confondues pour l'Espagne, le Portugal et le Royaume-Uni.
Y compris Hambourg.
Y compris Brème.
Forêts domaniales de Bavière et de Hesse: pé-riode d'abattage 1 . 1 . - 3 1 . 1 2 . 1 9 8 0 .
Regroupé avec années diverses.
Estimé sur base des quantités enlevées avec écorce.
Estimé sur base enquête des forêts privées en 1973.
(5)
(6)
(7)
(8)
(9)
(10)
(11)
(12)
(1) Résidus de bois non communiqués en 1983/
1984 (RFA).
6. Bilan d'approvisionnement des principaux produits du bois
(1) 1 000 m3 (S) TDC ex 44.05.
(2) 1 000 m3 (S) TDC ex 44.07.
(3) 1 000 m3 (S) TDC ex 44.14.
(4) 1000 m3 (S) TDC ex 44.15.
(5) 1000 m3 TDC ex 44.18.
(8) 1000 m3 TDC ex 44.11.
Í7) 1 0001 TDC ex 47.01.
7. Consommations de bois de trituration par produit industriel
(1) Y compris pâtes mi-chimiques (R-U).
(2) Incluses dans pâtes mécaniques (R-U).
(3) Couvert par secret statistique.
2. Structure des forêts
(1) Inclus dans les forêts privées (R-U).
(2) Y compris les forêts de collectivités de droit
pu-blic (R-U).
(3) Y compris taillis sous futaie (F).
(4) Y compris les classes de superficie
immédiate-ment précédentes non renseignées. (5) Selon enquête ESSES 76/86 (F).
(6) Total différent de 2.1 suite à enquête ESSES 76/
86(F).
(?) Autres forêts soumises (F). (8) Forêts non soumises (F).
3. Production de bois
(1)
(2)
(3)
(4)
Peupliers bois longs compris dans autres feuillus (RFA), autres feuillus bois empilés compris dans chênes et hêtres (RFA).
Inclus dans les forêts privées (R-U).
Y compris les forêts de collectivités de droit p u -blic (R-U).
Bois de mine dans autres bois longs (RFA).
(2)
(3)
(4)
8. Incendies de forêts (chiffres FAO - Genève)
(1) La valeur commerciale est considérée pour les
futaies adultes, la valeur capitalisée future par contre pour les jeunes peuplements.
Estimation de la valeur de rendement: celle-ci correspond à la valeur du bois sur pied, y c o m -pris les frais de reboisement.
Estimation du bois détruit sur la base de la valeur à l'acte de la vente sur pied.
Évaluation des dégâts: frais des plantes et de la plantation au moment de l'établissement de la culture, plus frais de culture et de maintenance, avec des intérêts capitalisés jusqu'au moment de l'incendie.
(5) Valeur du bois détruit, plus frais de reboisement. (6) Pour les futaies adultes, on a considéré la valeur
marchande correspondant à l'âge d'exploitabili-té, dont on déduit le prix de vente des bois en-dommagés; à cela sont ajoutés les frais de lutte contre les incendies. Pour les jeunes bois, on a capitalisé les frais de plantation.
Si possible basé sur la valeur de rendement capi-talisée, augmentée des frais réels.
Indice
1. Settore forestale della CE in breve
1.1. Superficie boscata, superficie totale e popolazione residente 59
1.2. Ampiezza media delle aziende forestali 59 1.3. Ripartizione della superficie boscata secondo la forma di proprietà 59
1.4. Quota dei vari Stati membri nella produzione di legname CE 59
1.5. Produzione di legname per ettaro 59 1.6. Approvvigionamento di legname grezzo 60 1.7. Importazioni nette di legno segato e traversine ferroviarie 60
1.8. Statistiche delle foreste per unità territoriali statistiche 61
2. Struttura delle foreste
2.1. Ripartizione della superficie boscata 65 2.2. Ripartizione della superficie boscata secondo la natura della proprietà ". 66
2.3. Ripartizione della superficie boscata secondo il trattamento silvicolo 67 2.4. Ripartizione della superficie boscata secondo la natura della proprietà e il trattamento silvicolo 68
2.5. Numero di aziende forestali secondo la natura della proprietà e la classe delle unità 69 2.6. Superficie boscata secondo la natura della proprietà e la classe di ampiezza delle unità 70
2.7. Superficie delle fustaie secondo i gruppi di essenze arboree e le classi di età 71 2.8. Legno in piedi, crescita, possibilità e programmi d'abbattimento secondo la natura della proprietà
e le essenze arboree 74
3. Produzione di legname
3.1. Rassegna della produzione di legname: legname grezzo totale 76 3.2. Rassegna della produzione di legname: evoluzione, produzione per ettaro, quota degli Stati membri
nella produzione 77 3.3. Quantità annuali prelevate di legname grezzo secondo la forma di proprietà 78
3.4. Quantità annuali prelevate per categoria di legname grezzo (conifere e latifoglie) 79
3.5. Quantità annuali di legname prelevate 80 - 3.5.1. Tronchi non scortecciati o legname da opera 80
- 3.5.2. Legname da miniera 80 - 3.5.3. Altro legname lungo 81 - 3.5.4. Totale legname lungo 81 - 3.5.5. Legname industriale in cataste 82
- 3.5.6. Legna da ardere 82 - 3.5.7. Totale legname in cataste 83
4. Bilanci di legname grezzo
4.1. Bilancio d'approvvigionamento di legname grezzo totale (escluse placchette, particelle e residui
di legno) 84 - UEBL 84 - Danmark 85 - Deutschland 86 - Ellada 87 - France 88 - Ireland 89
- Italia 90
- Nederland 91 - United Kingdom 92
- EUR 10 93 4.4. Bilancio d'approvvigionamento di legno per triturazione ottenuto da placchette, particelle e residui
di legno 94 - UEBL e Danmark 94
- Deutschland e Ellada 95 - France e Ireland 96 - Italia e Nederland 97 - United Kingdom e EUR 10 , 98
5. Commercio intracomunitário di legname grezzo
5.1. Importazioni 99 - Legname grezzo totale e legname lungo 99
- Legname in cataste e placchette, particelle, residui di legno 100
5.2. Esportazioni 101 - Legname grezzo totale e legname lungo 101
- Legname in cataste e placchette, particelle, residui di legno 102
6. Bilancio d'approvvigionamento dei principali prodotti del legno (per paese)
6.1. Importazioni, esportazioni, disponibilità 103
- UEBL 103 - Danmark 104 - Deutschland 105 - Ellada 106 - France 107 - Ireland 108
- Italia 109
- Nederland 110 - United Kingdom 111
- EUR 10 112
7. Consumo di legno per triturazione ripartito per prodotti industriali
7.1. Paste, pannelli di fibre e di particelle 113
8. Incendi forestali
8.1. Numero, superfici, ammontare dei danni 114 8.2. Cause degli incendi, note o meno 115
Osservazione preliminare
Metodologia:
La metodologia d'applicazione per le statistiche forestali pubblicate in appresso forma oggetto del volume a cura dell'Eurostat nella stessa collezione e recante il numero E5, «Statistiche delle foreste - Metodologia».
Particolarità delle tabelle «Struttura delle foreste»
Questa parte comprende i dati disponibili più recenti, cioè:
Belgio
- foresta soggetta al controllo statale - foresta non soggetta al controllo statale
Danimarca R F di Germania Grecia
Spagna Francia Irlanda Italia
Lussemburgo Paesi Bassi Portogallo Regno Unito
2.1
1980 1970 1976 1961 1980 -1983 1984 1977 1984 1976 -1978
2.2
1980 1970 1976 1961 1980 -1983 1984 1977 1984 1976 -1978
2.3
1980 1970 1976 1961 1980 -1983 1984 1977 1984 1976 -1978
2.4
1980 1970 1976 1961 -1983 1977 1977 1975 1976 -1978
2.5
1982 1982 1976 1974 -1975 1977 1970 1975 1976 -1978
2.6
1982 1982 1976 1974 -1970 1977 1970 1973 1976 -1978
2.7
-1976 1961 -1977
-1973 1976 -1978
2.8