PROGRAMME FOR RESEARCH AND ACTIONS ON THE
DEVELOPMENT OF THE LABOUR MARKET
ANALYSIS OF THE DYNAMICS
OF THE JOB CREATION PROCESS
IN THE UNITED STATES AND AN
EVALUATION OF MEDIUM AND
LONG TERM PROSPECTS
VOLUME II: PUBLIC POLICY, ENTREPRENEURSHIP AND THE U S JOB CREATION EXPERIENCE
COMMISSION
OF THE EUROPEAN
This document has been prepared for use within the Commission. It does not necessarily represent the Commission's official position.
Cataloguing data can be found at the end of this publication.
Luxembourg: Office for Official Publications of the European Communities, 1987 Vol. II : ISBN 92-825-7584-5
Vol. Nil: ISBN 92-825-7586-1
Catalogue number: CB-04-87-002-EN-C
© ECSC-EEC-EAEC, Brussels · Luxembourg, 1987
Reproduction is authorized, except for commercial purposes, provided the source is acknowledged.
Commission of the European Communities
Programme for Research and Actions on the development of the Labour Market
ANALYSIS OF THE DYNAMICS OF THE JOB CREATION PROCESS IN THE UNITED STATES AND AN EVALUATION OF MEDIUM AND LONG TERN PROSPECTS
Volume II: "Public Policy, Entrepreneurship and the U.S. Job Creation Experience"
This document has been prepared for use within the Commission. It does not necessarily represent the Commission's official position.
Copyright ECSC-EEC-EAEC, Brussels - Luxembourg, 1987
Commission of the European Communities
Programme for Research and Actions on the development of the Labour Market
ANALYSIS OF THE DYNAMICS OF THE JOB CREATION PROCESS IN THE UNITED STATES AND AN EVALUATION OF MEDIUM AND LONG TERM PROSPECTS
Author: The Corporation for Enterprise Development
Volume II: "Public Policy, Entrepreneurship and the U.S. Job Creation Experience"
Study No. 85/1
The research (Study 85/1) on which these reports were based was financed by the Commission of the European Communities as part of its programme for Research and Actions on the Development of the Labour Market.
The analysis and conclusions are the responsability of the authors.
TABLE OF CONTENTS
I. Job Creation in the U.S. and Europe: A Review of the Numbers
1 .1 Some Apples and Oranges 2 1.2 Comparing Apples with Apples 2
1.3 Variations in Sectoral Job Growth 4 1.4 The Dilemma of "Jobless Growth" .* 4
1.5 What Does It All Mean? 4 1.6 Labor Force Flexibility: The Source of
Dynamism in the U.S. Economy? 6
II. Public Policies and Job Creation
2.1 Tax Policy and Job Creation 9
2.1.1 Overall Tax Level 9 2.1.2 Business Income Taxes 9 2.1.3 Personal Income Taxes 14 2.2 Regulation and Job Creation 15
2.2.1 Background 16 2.2.2 The Results of Deregulation 18
2*2.3 Conclusions 21 2.3 Federal Expenditures and Job Creation 21
2.3.1 Deficit Spending 21 2.3.2 Military Spending 22 2.3.3 Health Care Spending 23 2.3.4 Human Capital Spending 24
2.4 Conclusions 26
III. Entrepreneurship Policy
3.1 Research on the Economic Contributions
of Entrepreneurship 27 3.1.1 Entrepreneurship and Job Creation 28
3.1.2 Entrepreneurship and Innovation 29 3.1.3 Entrepreneurship and Economic Resilience..30
3.1.4 Small Business and Job Quality 30 3.2 Public Policy Supports for Entrepreneurship..31
3.2.1 Guidelines of an Effective
Entrepreneurial Policy 33 3.2.2 Michigan: A Case In Point 34 3.2.3 Life Cycle Support for Entrepreneurship
85/229
TABLE OF TABLES
Page
Table 1.1 2a Changes in Civilian Employment in Selected Countries : 1970-1984
Table 1.2 2a
Changes in Size of Civilian Labor Force in Selected Countries: 1970-1984
Table 1.3 3a
Changes in Unemployment as Difference between Growth of Labor Force and Growth of Jobs in Selected Countries : 1970-1984
Table 1.4 3b
Growth of Civilian Labor Force, Employment and Unemployment in Ten Countries:1970-1984
Table 1.5 4a
Sectoral Contributions to Total Civilian Job Growth in Selected Countries: 1970-1982
Table 1.6 4b
Average annual percentage change in real gross domestic product (GDP) and productivity, output and employment in manufacturing in selected industrialized countries: I960—1983 ·
Table 2.1 9a
Tax Revenues as a Percentage of GDP
Table 2.2 10a
Indexes of Cyclical Growth in Business Investment, Previous Cycle Average and 1982-84
Table 2.3 11a
APPENDIX
All tables in appendix are from U.S. Bureau of Labor Statistics, "Statistical Supplement to International Comparison of
Unemployment, 1985."
BLS Table 3
Labor Force, Employment and Unemployment in Ten Countries: 1959-84 .
BLS Table 8A
Civilian Employment by Economic Sector: 1960-84
BLS Table 8B
Percent Distribution of Employment by Economic Sector: 1960-84
BLS Table 10
Unemployment Rates (Civilian Labor Force Basis) by Age: 1980-84
BLS Table 12
Labor Force Participation Rates (Civilian Labor Force Basis) by Sex: 1960-84
BLS Table 13
Public Policy, Entrepreneurship and the U.S. Job Creation Experience
The Corporation for Enterprise Development
The United States has adjusted to the post 1973 era of structural economic change with far greater employment growth than any
comparable European nation, several of which actually lost jobs. For this reason, policymakers in Europe are looking to the U.S. experience for signals on how they might intervene to improve their own employment situation. Policy prescriptions range from exclusive attention to rigidities affecting the supply of labor to policies to remedy the problem through conventional macro-economic policies.
In this paper, we examine the U.S. job creation experience from 1970-1984 in the hope of illuminating at least some of the policy prescriptions that do and do not appear to explain the U.S.'s relative good fortune over this period. The paper is divided into three parts:
Part I reviews comparative data on the U.S. and European
ex-perience and attempts to develop measures of relative performance that get beyond the usual comparisons of absolute job growth. Sectoral changes in the composition of employment growth are also covered, as is the puzzle of "jobless growth" in Europe.
While labor market rigidities in Europe may or may not contribute to problems there, we argue that the sources of overall U.S.
flexibility are much broader, and hence cannot be explained well by labor markets per se.
Part II then takes a look at various explanations put forward of how public policy in the U.S. has contributed to our job growth, and attempts to separate the wheat from the chaff. Explanations covered are taxation, deregulation, federal expenditures (inclu-ding defense, health care, human capital, and the overall effect of macro-economic policy) and support for entrepreneurship at the
federal, state and local levels.
2
-I. Job Creation in the O.S. and Europe: A Review of the Numbers
There is no question but that the U.S. outperformed Europe in creating jobs for its people from 1970-1984. Even so, the numbers commonly tossed around to highlight this disparity are somewhat misleading. In the first two parts of this section, such numbers are replaced with measures that more accurately reflect the relative job performance of nations during this
period. Later in the Section, we review some of the explanations commonly given for this disparity between North American job
growth versus, in several cases, aggregate job loss in Europe. 1.1 Some Apples and Oranges
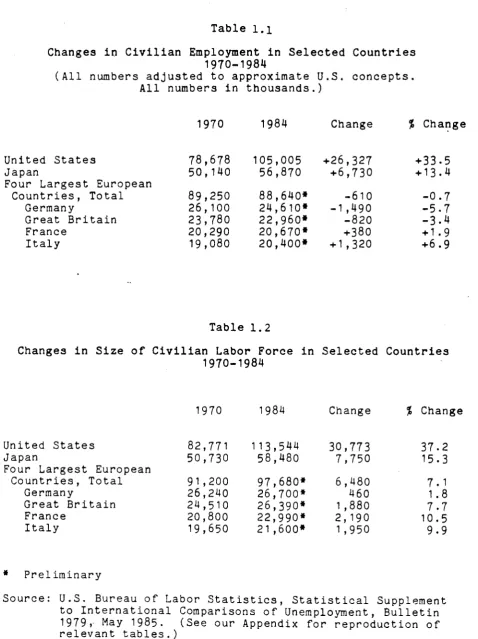
From 1970 to 1984, the U.S. created over 26 million jobs. By comparison, the four largest European nations — with a combined
1970 labor market slightly larger than ours -- lost over half a
million jobs. Japan, which did reasonably well, with 6.7 million new jobs, nonetheless also fell far short of the U.S. figure, even when viewed in terms of percentage job growth. Japan generated job growth of 13-4 percent; the U.S., 33-5 percent.
(See table 1.1.)
1.2 Comparing Apples with Apples
What is wrong with these oft quoted numbers? A look at table 1.2
should make it clear: the U.S. labor force grew by 37.2 percent over the relevant period, while Japan's grew by only 15.3
percent. What this means is that if every new entrant in Japan's labor force immediately found a job, Japan would still have
experienced only 15.5 percent job growth, well below the U.S. figure, yet as well as any country could hope for. Job growth or percentage job growth needs to be considered in the context of labor fc/ve growth. Labor force growth implies growth in demand as well as supply of labor, and both shifts should lead to
greater employment.1
It is for this reason a little misleading to call employment growth figures measures of "job creation," as if jobs were
created independent of labor supply. They are a measure of job creation, yet a more precise relationship tõ Tabor force growth would be more helpful.
In a perfectly functioning market, virtually any increase in the labor supply will be employed, although at lower wages.
Therefore, differing levels of labor force growth should not explain changing unemployment patterns among nations, except as measures of how closely their Labor market performs relative to the textbook model. Thi' measure we introduce in table 3
2a
[image:12.595.46.525.81.721.2]Table Ι.χ
Changes in Civilian Employment in Selected Countries 1970-1984
(All numbers adjusted to approximate U.S. concepts. All numbers in thousands.)
United States Japan
Four Largest European Countries, Total
Germany
Great Britain France
Italy
1970
78,678 50,140
89,250 26,100 23,780 20,290 19,080
1984
105,005 56,870
88,640» 24,610» 22,960» 20,670* 20,400»
Change
+26,327 +6,730
-610 -1,490 -820 +380 +1,320
% Change
+33.5 + 13.4
-0.7 -5.7 -3-4 + 1.9 +6.9
Table 1.2
Changes in Size of Civilian Labor Force in Selected Countries 1970-1984
United States Japan
Four Largest European Countries, Total
Germany
Great Britain France
Italy
* Preliminary
1970
82,771 50,730
91 ,200 26,240 24,510 20,800 19,650
1984
113,544 58,480
97,680* 26,700* 26,390* 22,990* 21,600*
Change
30,773 7,750
6,480
460
1 ,880 2,190
1,950
% Change
37.2 15.3
7.1 1.8 7.7
10.5
9.9
- 3 - 85/229
Table 1.3 provides one such measure. In the first three columns we see how absolute changes in the size of the labor force and the employment level combine to determine the rise or fall of absolute unemployment. In the final column, however, we see how well each economy was able to absorb a given increase in the size of its labor force. (The number tells us what percentage of new entrants were not accommodated with jobs. One hundred minus that number tells us what percentage were able to find work.)^
This number allows us to compare each nation's performance by a common scale. Glancing down this column, we see that Europe did in fact fare much worse than the U.S., but that Japan performed slightly better than the U.S.
Table 1.4 presents similar data for ten countries, along with "before" and "after" rates of unemployment. In order to get a fuller sense of how well each nation did under different levels of strain, a comparison of all these numbers is recommended. For example, a country with a much larger labor force (assuming a healthy economy) can probably adjust more easily to changes in
world markets, if only because of the greater diversification it presumably starts with.
The initial rate of unemployment is crucial also, both as an indication of how tight or loose the labor market was at the beginning of the measured period, and as another check on how well the labor force 13 actually being served. For example,
Sweden and Japan, which, along with the U.S., achieved the lowest rankings on the "% of new labor force entrants unable to find work" indicator, continue to boast unemployment rates only forty percent of that in the U.S.3
2 One problem with this numbering is that measures of a nation's labor force generally fail to capture those persons who have
eventually given up in their search for employment -- the "discouraged worker." On the other hand, use of the
"employment-population ratio" fails to distinguish between
economic performance and the growth of labor force participation by women. In the U.S., the importance of the latter phenomenon easily overshadows the discouraged worker measurement problem. In other countries, however, the opposite is probably true. For comparative data on the labor force participation of men versus women over time, see table 12 in our appendix. For
employment-population ratio comparisons, see appendix table 13-For discussion of the magnitude of the discouraged worker problem and other reasons why European unemployment measures may be
greatly understated, see Guy Standing, Labour Surplus and Labour Flexibility: A European Perspective, International Labour
Organization , 1986 .
3 The caveats that must be mentioned concerning comparisons of such data are worthy of a separate paper themselves. It is not fair,
in one sense, to compare unemployment rates in Sweden, Japan and the U.S. Yet from a policy perspective, comparisons are valid in so far as they measure citizens' experience. Thus while Sweden keeps the unemployed off the rolls with training and other
3a
Table 1.3
Changes in Unemployment As Difference Between Growth of Labor Force and Growth of Jobs in Selected Countries
1970-1984
(All numbers adjusted to approximate U.S. concepts. All numbers in thousands.)
Growth
-of
Labor Forcei
■ Growth =
of
Jobs 1
Growth
of
Labor ?
w/o Jobs
As $ of Growth
in
Labor Force
United States 30,773
Japan 7,750
Four Largest European
Countries, Total 6,480
Germany . 460
Great Britain 1,880
France 2,190
Italy 1,950
■26,327 +6,730
4,446 1 ,020
14.4 13.2
-610 -1,490 -820 + 380 +1,320
7,100 1,950 2,700
1,810
640
109.6 423.9 143-6 82.6 32.8
1 Taken from the previous two tables above
Calculated directly from unemployment figures for 1970 and 1984, U.S. Bureau of Labor Statistics, Statistical Supplement to International Comparisons of Unemployment, Bulletin 1979, May 1985. European numbers are preliminary. (See our
3b
Table 1.4 Growth of Civilian Labor Force, Employment and Unemployment in Ten Countries 1970-1984
(All numbers adjusted to approximate U.S. concepts. All numbers in thousands.)
United States
Japan
Germany*
Great Britain*
France*
Italy*
Canada
Australia
Netherlands**
Sweden
Size of Labor Force in 1970
82,771
50,730
26,240
24,510
20,800
19,650
8,395
5,478
4,710
3,909
%
Growth of Lf 1970-84
37.2
15.3
1.8
7.7
10.5
9.9
47.7
30.2
21 .9
12.2
%
Growth of Empi .
1970-84
33-5
13.4
-5.7
-3-4
1.9
6.9
38.9
20.5
7.0
10.4
% of
Lf Growth Unable to find work
14.4
13.2
423.9
143.6
82.6
32.8
23.1
33.1
69.9
16.2
Civ. Rate 1970
4.9
1 .2
0.5
3.0
2.5
2.8
5.7
1.6
3-2
1.5
Unem.
in Civ . Unemp. in 1984
7.5
2.8
7.8
13.0
10.1
5.6
11.3 9.0
15.0
3.1
* Data for 1984 is preliminary
** Data for the Netherlands is for 1973-1984, and is preliminary for 1984.
4 85/229
1.3 Variations in Sectoral Job Growth
Moving on to table 1.5, we gain a sectoral perspective on where
job growth occurred (or did not occur). The very first column is a more useful variation on "% growth of labor force," in that it measures exactly what percentage growth of jobs would be required to employ all new entrants to the workforce. Then, within each major section (Agriculture, Industry^ and Services) the left columns indicate how important an employer that sector was in 1970; the middle columns indicate percentage job growth through 1982; and the right columns indicate that sector's contribution to total job growth. Adding the right hand columns for each sector we approximate the final column, total job growth achieved.
Contrasting North America to Europe, we see that most European countries had not only to accommodate growth of their labor force, but also large numbers of workers dislocated from the shrinking agricultural and industrial sectors. The U.S. and
Canada, on the other hand, experienced slight aggregate growth in industry, and little significant change in agriculture. Both countries faced extraordinary labor force growth, however; thus, while both found employment for an admirable percentage of this large growth of job seekers, Canada experienced an unemployment rate increase from 5.7 to 11.3; while the U.S. figure rose from 4.9 to 7.5. (Refer back to table 1.4.)
1 .4 The Dilemma of "Jobless Growth"
Finally, table 1.6 points up a curious dilemma for Europe.
Despite superior growth (relative to the U.S.) in manufacturing output and productivity, and comparable growth in total gross domestic product, most European countries experienced much
greater declines in manufacturing employment over both 19601973 and 1973—1983. This "jobless growth" has led some observers to conclude that Europe requires much larger output growth to
achieve employment growth of any kind, and certainly less than is true in the U.S. (The Business Roundtable, "Job Creation: The United States and European Experience, December 12, 1984.)
1 .5 What Does It All Mean?
The data in the previous charts give us some numbers, or clues, but what is actually occurring in these economies? Some things are obvious, and others hotly debated. We know, for example, that the U.S. and Canada's huge labor force growth is due largely to increased work participation by women and the bulge of the postwar baby boom. We know that in Europe there is a lag in the baby boom and far less dramatic change in female workforce
Data is also available in the Appendix for Manufacturing employ ment as a subset of■"Industry." In general, all nations fared
4a
T a b l e 1 . 5 : Sectoral Contributions to Total Civilian Job Growth in Selected Countries, 1970-1982
United States
Japan
Germany 4 Great Britain 4
France 4
Italy Canada
Sweden
% Total
Job Growth , Requlred-1
-31.9 15.5 1.5 5.8 10.3 9.1 1*5.0 | 11.5
% > Share of Jobs in 1970 1.5 16.9 8.6 3-2 13-9 20.1 7.6 8.2 Agriculture
! t
Job Growth to 1982 nc -38.2 -38.9 -18.0 -38.1 -31.2 -7.6 -21.8 % Increase in Total Jobs due to 2 Agrie. ne -6.5 -3-3 -0.6 -5.3 -6.9 -0.6 -2.0 Share of Jobs in 1970 33.1 35.7 17.6 13-2 38.9 39.8 29.8 38.0 Industry Job Growth to 1982 3-8 7.1 -16.0 -28.1 -10.9 0.1 11.5 -15.0 % Increase in Total Jobs due to 2 Industry 1.3 2.6 -7.6 -12.1 -1.2 nc 1.3 -5.7
t χ Share of Jobs in 1970 62.3 17.1 13-7 53-6 17.2 10.1 62.6 53-9 Services % = Job Growth to 1982 10.5 31.1 15.8 8.1 26.9 31.2 19.0 32.0 t Increase in Total Jobs due to 2 Services 25.2 11.7 6.9 8.5 12.7 13-7 30.7 17.2 t Total Job Growth 3 Achieved 26.5 10.9 -1.0 -1.0 3.1 7.1 31.1 9.1
1. Growth of labor force as percent of 1970 job base; i.e., percent growth of jobs required to employ all newcomers. 2. Calculated from numbers on this chart (leading to greater rounding error).
3. Calculated directly from source. 1. Data for 1982 is preliminary.
4b
TABLE 1.6
Average annual percentage change in real gross domestic product* (GDP) and productivity, output and employment in manufacturing in selected industrialized countries: 1960 - 1983.
YEAR
Real GDP 1960-1973 1973-1983
Productivity** 1960-1973 1973-1983
Output 1960-1973 1973-1983
Employment 1960-1973 1973-1983
United States
4.1 2.0
3.0 1.9
4.7 1.6
1.5 -0.1
France
5.6 2.2
6.7 4.6
7.3 2.0
1.1 -1.6
Germany
4.4 1.6
5.7 3.5
5.2 1.2
0.3 -1.4
Italy
5.3 1.8
6.9 3.6
6.8 2.5
1.4 -0.5
UK
3.2 0.9
4.4 2.0
3.0 -2.0
-0.6 -3.4
* Own country price weights ** Output per hour
Source: "International Comparisons of Manufacturing, Productivity and Labor Cost Trends: Preliminary measures for 1983," Bureau of Labor Statistics, News. May 31, 1984;
5
-participation.5 We know that due to self-imposed changes in laws regarding foreign guest workers in 1973, many European
countries can no longer count on a labor force which d r a m a t i c a l l y swells or contracts along with the demand for labor.
We know that all advanced countries are experiencing a dramatic shift from industrial employment to employment in the service s e c t o r s , just as we all shifted from agriculture to industry earlier o n .
While the implications of all this are less c l e a r , we n o n e t h e -less suggest the following:
o The U . S . is further along the shift to services than is E u r o p e .
o This shift implies lower productivity of labor, on a v e r a g e , but more jobs due to the human intensive nature of the
service sector.
o This shift has both positive and negative impacts on the labor force, since it implies more jobs but lower w a g e s , on a v e r a g e .
o But for advanced c o u n t r i e s , the shift is probably inevita-b l e , such that "do we want to or don't w e ? " is not the
relevant question so much as "how can we make the transition as well as possible and end up with the best mix of employ-ment o p p o r t u n i t i e s ? "
From this p e r s p e c t i v e , the difference between the U.S. and Europe from 1970-1984 is that the U . S . entered the period having already shifted further into services — with 62.3 percent employment there in 1970, versus an average of 46.2 percent for the four largest European nations listed back in table 1.5 — and w a s , therefore, better able to accommodate a growing workforce of less skilled, 1-:3S experienced women and youth.
But why is the U . S . further along the shift to service sector employment.' We believe it is here that the U.S.'s greater
dynamism, innovativeness and relatively low aversion to risk can be credited. In a time of c h a n g e , with employment in old sectors declining and new sectors just emerging, a country's ability to shift quickly from old to new will give it an edge in capturing the new markets and freeing resources from the old. With its relatively greater emphasis on preservation of hard earned
security, Europe has had a cultural disadvantage in this p r o c e s s .
Thus one plausible argument is that Europe devoted its resources to retooling older, maturing industries, and invested much less in the c r e a t i o n , exploration and systematic development of new o n e s . The result was greater productivity in their mature
The baby boom lag means that Europe must attempt to accommodate an influx of young, inexperienced workers for several years to c o m e , whereas the U . S . is already over the hump. (See Appendix
6
industries, but consequently less employment in either the old or the as yet untapped new sectors.6 Thus they saved the indus
tries, but are caught with insufficient new job opportunities in emerging sectors, as productivity increases in older sectors free up labor.? (It is important to note, however, that many
observers believe the U.S., by not making these same capital investments, has created jobs today, but will lose more of the manufacturing market all together later down the road. See Mills and Lovell in footnote six.)
1 .6 Labor Force Flexibility: The Source of Dynamism in the U.S.
Economy? " ~ ~
Assuming that much of the above is true or at least suggestive of why the U.S. is adjusting to some aspects of the post 1973 era better than Europe, what are the elements that make up the greater dynamism of the U.S. economy?
The primary explanation typically encountered is that the U.S. has more flexible labor markets. Without question, labor markets are more flexible in the U.S than in Europe. We have greater ease of mobility — both for change of residence and for com muting to work — due to the size of the nation and consequent
lack of barriers such as language, visas, and change of culture; hence our workers voluntarily change jobs and occupations more
frequently, change their residence more frequently and move
further when they do; our unions are less powerful, so that wages are presumably more flexible here;" and we have less of a
"Labor productivity" is another concept often used carelessly. Measured as the amount of output that results from a given input of labor hours, it may or may not have anything to do with the value added by that labor. If a plant fires 300 workers, puts in robots, and retains one person to turn the robots on, that
person's "productivity" will have skyrocketed beyond measure. In fact, however, it is the value added by the robot that allows the f'.^i. :, _ . : educa a given level of ouput with more (or less)
effi'ien1: uss of total available resources. Thus some observers
believe ¡.hat Europe simply traded capital for labor in various man ufa·: i .;.!ing industries, increasing productivity, profits and ".■■j¿put w ile reducing employment in those industries.
,?ee, for example, Robert B. McKersie and Werner Sengenberger, Job Loss eG in Major Industries: Manpower Strategy Responses
■'Paris, France: Organisation for Economic Cooperation and Development:, 1983), P20; National Research Council, The Competitive Status of the Steel Industry, prepared by the Committee on Technology and International Economic and Trade I'ssuos, Steel Panel, Office of the Foreign Secretary, National /. ;ademy of Engineering and the Commission on Engineering and ' iohnical Systems (Washington, DC: National Academy Press, iyo5), PP 7981, 99; Mills and Lovell in U.S. Competitiveness
: :\ the World Economy (edited by B. Scott and G. Lodge, Harvard
business School Press; 1985) p.437
Sse accompanying paper by Dr. Richard Freeman, Factor Prices,
ί.,ψΓ oyment, and Inequality in a Decentralized Labor Market rprepared for the Commission of European Communities by the
- 7 - .
social safety net to catch workers made redundant within their former occupation (this presumably reduces workers' natural tendency to react slowly to the hard facts of needing to change occupation or locale). We also have fewer rigidities in the demand for labor relative to Europe, such as restrictions and added costs regarding lay-offs and plant closings. (Most of the sources on the impact of all the above are anecdotal or intui-tive. See, however, Business Roundtable, "Job Creation: The United States and European Experience," 1984; Janet Norwood,
"Labor Market Contrasts: United States and Europe," Monthly Labor Review August 1983; Heidi Fiske, "Europe, Inc.," Inc. Magazine, September 1985; and U.S. Office of Technology Assessment, Tech-nology and Structural Unemployment: Reemploying Displaced Adults,
1986Î)
Particularly in an area of rapid and profound change, it is
imperative that a nation's workforce be able to adjust to changes beyond that nation's control. It is not clear, however, nor will it be resolved soon, how great an effect any of the labor market rigidities discussed above have on job creation over time. We assume there is some loss of jobs as a result, but remain
agnostic as to whether sweeping statements can be made that those rigidities created by public policy generate social costs greater than the social gains for which they were introduced. (Sweden, for example, continues to meet the needs of her people quite nicely through a highly evolved welfare state. Her choice may not be appropriate for all Americans, but it is not obviously inferior as a means of meeting social welfare.)
Furthermore, while labor markets are critical, they do not operate in a vacuum. Labor can be infinitely flexible, yet
without a steady flow of innovation, new product development and marketing, the business sector will not be able to sustain
8
-II. Public Policies and Job Creation
Having provided an overview of the job creation performance and dynamics of the American economy over the past 15 years, it is now possible to discuss the role that public policy has played in that performance — and that which it might yet play. In this section we look at job creation impacts of three large areas of public policy — taxes, regulation, and expenditures.
In determining the impact of various policies on job creation, several points must be kept in mind:
o First, it is easy to overestimate the impact of public policy on job creation. The American job creation
ex-perience is a product of many factors -- cultural, institu-tional, demographic, technological — and fundamentally an economic phenomenon over which public policy may have an influence, but one which is certainly not determinative. Moreover, since the U.S. has been creating jobs at a
relatively lively clip (2 million annually) for more than 15 years, no single set of federal (or state and local)
policies — even a set as distinct as those of the current Administration — can be credited with responsibility for the-phenomenon.
o Given the importance of the entrepreneurial dynamic to the job creation experience, greater care should be taken to distinguish the roles of aggregate macroeconomic policies and microeconomic policies. While the former determine overall spending and investment levels, and define the
"envelope" in which economic activity occurs, the latter may be more important in affecting opportunities for combining resources in new ways (i.e., entrepreneurship). Moreover, as macroeconomic policies become stymied by inherent
trade-offs (e.g. unemployment versus inflation, efficiency .-:.'.::,.... <.H¿i'¿j) the aoiiity of microeconomic policies to
side?te n son:.? of these trade-offs becomes more significant. o The states have become important economic actors (and to a
lesser extent, so have localities and neighborhoods). Federal policies should not be given exclusive attention. The Jta'iis have become particularly important as labora-tories for the new microeconomic policies. While the
current impact of these relatively new policies and actors is hard to determine, they may well be a better source of ideas for more effective "entrepreneurial" policies than the federal level.
o While it is difficult to evaluate the economic impact of many public policies, the relative youth of many of the new "entrepreneurial policies," as well as their selective
9
2.1 Tax Policy and Job Creation
The impact of tax policy on job creation depends upon the interaction between the level and type of tax (e.g. personal, business, payroll) and the type of business affected (startup, growing, capital intensive, labor intensive). For example, most businesses under five years of age do not generate profits, and therefore do not pay business income tax; for these businesses the level of business tax incentives is meaningless — except as it affects their larger or older competitors. Given the dif ferential contribution of various sorts of businesses to job
creation, it is a grave error to talk about the impact of various types and levels of taxes on investment without also talking
about the nature of the investment Induced. We, therefore, ■
organize our discussion of tax policy first by the type of tax, and within that, by types of business. But first a comment about overall tax levels.
2.1.1 Overall Tax Level
The overall tax burden in the U.S. (like Japan) has been, and remains lower than that of most European countries. (See table 2.1)
To what extent can the overall tax burden account for differen tial job" creation rates? This is quite difficult to assess. It should be noted that there is no consistent pattern among
countries that lower taxes produce higher job creation rates. For example, the United Kingdom with a relatively low tax burden
underperformed Sweden and France with high tax burdens. (Based on the job performance measure provided in the 4th column of table 1.4)
According to Kuttner (Robert Kuttner, The Economic Illusion: False Choices Between Prosperity and Social Justice; Houghton Mifflin Company; Boston, Massachusetts; 1984) , "...low levels of taxation, maldistribution of tax burdens, and restraint of public s, ;...._r.g v;: e not the keys to economic performance during the pnst decade " Kuttner arrives at this conclusion through an international comparison of six countries Japan, Italy,
France, Germany, United Kingdom, and United States. According to tre author, between 1973 1979, "...the three industrial
c un'or ies with the best growth rates, Japan, Italy, and France, hed the most rapid growth of public spending. Britain, with slow public sector growth, was the worst performer. The United States had belowaverage public sector growth, and about average
economic growth." (Ibid, p. 191)
For this reason, to really assess the impact of taxes on job creó ".ion, it is necessary to look at the structure of taxes, and their impact on the job creating sectors of the economy.
2 . 1 .¿ Business Income Taxes
9a
Table 2.1
Tax Revenues as a Percentage of GDP
at market prices
Canada France Germany Italy« Japan Sweden
United Kingdom United States
Total Tax
1979 31 41 37 30 25 50 33 30
Revenue
1983 35 44 37 40 27 51 38 30
Personal Income Taxes
1979 1 1
5 1 1
7 6 21 10 1 1
1983 12
6 1 1 10
7 20 1 1 12
Employees» Social Security
Contributions 1979
1 4 6 2 3 0 2 3
1983 · 2 5 6 3 3 0 3 3
* Last available year 1982.
10
-business investment dropped sharply during the ensuing recession, then increased at a rate significantly above that of previous recoveries. (See Table 2.2)
How much of this increase in investment resulted from the 1981 tax cuts?
First, it is important to recognize that the various models of investment behavior differ in the relative importance they assign to cyclical and profitability factors, as well as the role of the cost of capital, and how rapid investment is estimated to respond to changes in these factors.9 While most of these studies
suggest that tax incentives have an impact on investment, there is considerable disagreement over the extent of the impact, the time frame necessary for the impact to be realized, and the proper specification of investment models.
BoskinIO performed an econometric analysis of the impact of tax incentives on investment and concluded that the 1981 Economic Recovery Tax Act and the Extended Investment Tax Credit was responsible for 20-25Ï of net investment in the United States during the 1982-1984 period. Other studies finding that the
Economic Recovery Tax Act had a positive impact on investment via changes in the cost of capital include Hulton and Robertson
(Charles B. Hulton and James W. Robertson, "The Taxation of High Technology Industries," National Tax Journal, 37; September 1984) and Jane Gravell (Jane Gravell, "The Treasury Tax Proposals and Desired Capital Stocks," unpublished mimeo, 1985).
On the other hand, an exhaustive study of different model
specifications (Robert S. Chrinko and Robert Eisner, "The Effects of Tax Parameters on the Investment Equations in Macroeconomic Economic Models," U.S. Treasury Office of Tax Analysis Paper No. 47; January I98I) found that changes in the cost of capital via tax credits exerted relatively small long-run direct effects on investment. Elsewhere, Bischoff (Charles W. Bischoff, "The Effect
of ''alternative Lag Distributions," in Tax Incentives and Capital
Spending, edited by G. Fromm; Washington^ The Brookings Institu-tion, 1971) has argued that while the long-run substitution of
capital for labor may be large, it cannot be so in the short run,
since existing capital goods, once built, have fairly fixed labor requirements. In other words, in the short-run investment
behavior is much more likely to be influenced by cyclical factors, such as the level of demand and the rate of capacity utilization .
9 One of the best known models has been introduced by Dale W. Jorgenson, "Capital Theory and Investment Behavior", American
Economic Review; May 1963; A host of authors have challenged and modified Jorgenson's model, including Robert S. Eisner and M. Ishaq Nadiri; "Investment Behavior and Neoclassical Theory", Review of Economics and Statistics; August 1968 ; Charles W. Bischoff, "The Effect of Alternative Lag Distributions," in Tax Incentives and Capital spending, edited by G. Fromm; Washington; The Brookings Institution, 1971.
10a
T a b l e 2 . 2
I m f c t « of Cyclical (Îrnwlh In BOSÌIWM I n v n t m r n l . Prínhwn C>d« Avérât* ami I W 2 - J U
Index of l**72 dollars
( 'rllrgor\
( i r o s s national p n x l i i c l P r e v i o u s ι vele .iveracc l ' i n ; X4
N o n r e s i d e n t i a l si n i e l ures P r e v i o u s e vele a v e r a g e P W 2 - X 4
P r o d u c e r s ' d u r a b l e c q u t p m e n i P r e v i o u s e v e l e a v e r a g e . p m ; -X4
O l l i e e e q u i p m e n t Previous c y c l e a v e r a g e P I X 2 - X 4
Business ;iiilomohiles Previous evcle a v e r a g e
P > N ; - X 4
O t h e r e q u i p m e n t Previous e v c l e average |<)X2-X4
D o m e s t i c p r o d u c l i o n o f oi her e q u i p m e n t IOX2-X4
Reiex.iioH intugli
Tr ι m ν h quarter
KMI 1 IMI
Ι (Χ) I H ) I
HIO IIN)
nm
IIN)
ion
IIN)
UNI IIN)
IIN)
lixr· Fourth quarter atter trouvlt
107 HNS
KNS 'W
I I I i : i
I I I IM
I4< |4<
ION 117
112
equal*
Eighth
quarter after trough
112 112
KW 115
120 142
12*
| s ' )
140 p-«
II1* πι
120
Previous
Tri mv h
quarter
'IX
'ft
Y<
102
•NI <*l
')<
l « i
X ' ID4
•XI ' 7
-I)
peak equ
Fourth
quarter utter tnuivh
|0< IIN,
100 IDI
100 H O
KM P>7
120 I M I
'W.
W
?Q
ah inr
Eighth
quarter atter
trough
110 112
1 0 '
i r
107 I2X
I I «
;<;
ι io Γ')
IDh
mi
x<
• N H H I I · ' N;IIH«M;II ntvttmr .irnl pfutliK I . r i t i t t i i i K .imi .nilhnt ν c .ilei ι lal Htm , 1 \ ) I m ' X H i ' MI Ι'ΙΗΓ J ihr t r n i i t h i|U : n l n fitf «. u r r r n i cvclr
¡' t.t,.t- n - , „ ¡ I ' I t |«ι") 4 lei . n i reni n c k '
ilrv^ rtK^i) m ihr »PM
11
-Whatever the impact of the tax cuts on the overall level invest ment, our interest for the purpose of this inquiry is the effect of tax cuts on job creation. And to answer this, we need to look at the types of investment encouraged as well as its level.
The bulk of the 1981 business tax cuts came in the form of
allowing accelerated depreciation of physical assets. The value of these cuts was anything but uniform: The prime beneficiaries were older, capital intensive, profitable businesses. Eighty percent of the benefits of the 1981 cuts went to 2,000 firms — t h e top 1 percent of America's businesses.11 For a year,
federal law permitted older, capital intensive, unprofitable industries to gain further advantage from the tax cuts by
actually selling their tax deductions to profitable firms. These older firms were not creating jobs; the largest 1,000 U.S. firms, for that matter, lost jobs slightly during the 1970s (and three of their ten million jobs moved overseas during that period).
More importantly, most of the firms that were creating jobs could take little advantage of the tax benefits"! Firms are rarely
profitable in their first five years, and therefore, do not
generally owe business income taxes; nor can they take advantage of deductions.12 Service sector firms often have few physical
assets to depreciate.
It might be that modernization investments induced by the tax cuts could lead to increased job creation (or job loss reduction) in the long run, but one would expect a lag, and even then there is evidence that should cause us to question whether new job creation will in fact occur.
For example, in a recent study, Citizens for Tax Justice found absolutely "...no correlation between tax 'incentives' and improved capital spending or job creation. (Citizens for Tax Justice, Money for Nothing: The Failure of Corporate Tax Incen tives , 198Ί-1984; p. 3) The CTJ study is based on a sample of 259 of the nation's largest and most profitable non-financial
corporations over the 1981-84 period. The study found that the 44 non-financial companies in the survey that paid no federal income taxes at all — or received net tax refunds — over the four years actually reduced investment while the 43 highest tax companies increased both investment and employment. The per formance of low-tax companies relative to their higher tax
counterparts is high-lighted in the Table 2.3· According to the CTJ study, the highest taxed companies (i.e., those paying at least 33 percent of their domestic profits in federal income rates) boosted their capital spending by 21 percent and added four percent more workers to their payrolls.
11 Robert S. Mclntyre and Dean C. Tipps, Inequity and Decline
(Washington, DC: Center on Budget and Policy Priorities, T984)
12 Lawrence Litvak and Belden. Daniels, Innovations in Development
Finance (Washington, DC: Council of State Planning Agencies,
I l a
Table 2 . 3
Tax Rates à Changes in Investment and Jobs For 259 Major Corporations, 1981-84
CO
I to ω
OB m
Λ
O l ê
-
II-«β
φ
> *
• β
α c «
4
-ävflv
■1.5 -1.6
0« er Ι · ι * >Ο*.<20* >20*,<33«
1981-84 Tax Rate Class
33* or mor·
12
-At the other end of the extreme, the least taxed companies (i.e., those either paying no taxes or actually receiving tax rebates)
reduced their aggregate capital spending by four percent from 1981 to 1984; they cut their total number of employees by six percent over the same period. The study concludes that these firms have used their tax rebates for mergers and acquisitions, increased dividends, and higher pay for corporate executives (Ibid, p. 8 ) .
The findings of the CTJ study are consistent with those of another recent Brookings study (Barry Bosworth, "Taxes and the Investment Recovery," Brookings Mimeo; April 1985). According to Bosworth, tax incentives explain very little of the rise in
business investment. Bosworth considers the composition as well as the level of investment spending, noting that total business fixed investments rose 33 percent in real terms from the fourth quarter of 1982 to the fourth quarter of 1984, but that increased investment in office equipment (especially computers) and
business automobiles accounted for most of the aggregate in-crease. Contending that the 1981 and 1982 tax changes reduced the effective tax rate on business automobiles only slightly and actually increased the effective tax rate on office equipment, Bosworth stresses that tax incentives deserve little credit for the investment increase.
Other studies have questioned the link between taxes and invest-ment by focusing on trends in federal taxation on corporate
profits. (See David L. Brumbaugh and Wayne M. Morrison, "Why Some
Corporations Don't Pay Taxes", Congressional Research Service; Report No.35-75E; March 22, 1985.)
These studies attempt to assess the hypothesis that high taxes on corporate profits have prompted an investment crisis. If this hypothesis were correct, then it would follow that tax cuts on
corporate profits should stimulate investment. However, a host
of studies confirm that the effective corporate tax rate has been
declining and is relatively low. The Congressional Research Service notes that due to the wide array of tax deductions, exemptions, exclusions, and credits, many corporations pay far le.ss than the statutory rate that the U.S. tax code applies to moot taxable corporate income.
Finally, there are a host of studies suggesting that the poten-tial benefits of specific tax incentives must be balanced against possible distortions in investment decisions. (Two examples are: Alan Auerbach and Dale Jorgenson, "The First Year Capital
Recovery System", 1979; Federal Reserve Board, Public Policy and Capital Formation; I98I) The primary critique of most of these studies is that distortions in investment patterns caused by tax preferences are intrinsically bad because they substitute tax factors for economic forces when investment decisions are made. These distortions are virtually inevitable when profits from investments in different assets are taxed at different effective tax rates. The concern with potential distortions prompted the Federal Reserve Board to remark: "While finding the overall rate of capital formation is probably adequate, this study concludes that'the existing capital stock is misallocated, probably
13
primarily because of distortions caused by inflation and U.S. tax laws. The biases are substantial...as a result capital is not applied to its most efficient uses."
Likewise, the 1981 Economic Report of the President acknowledged distortions caused by the Accelerated Cost Recovery System: "ACRS does not treat all types of business investment equally"; it
"...is relatively more favorable to investment in shortlived equipment. Tax rates vary across industries...Effective tax rates on new equipment are negative for some industries."
Others claim that as the maze of tax incentives expands, the maximum gap between effective tax rates on different types of
investment will increase, exerting further pressure to base investment decisions on tax considerations, not market forces. (For data on the growing gap between the highest and lowest
effective corporate tax rates on different types of investments, see the following: The Economic Report of the President, 1982; Robert S. Mclntyre and Dean C. Tipps, Inequity and Decline^ Center on Budget and Policy Priorities; Washington, DC 1983; Wayne M. Morrison, Why Some Corporations Don't Pay Taxes Con gressional Research Service; Report No. 8575E; March 22, 1985.)
There are, of course, other sorts of business taxes and tax incentives. States particularly have used property tax abate ments and tax reductions to induce plants to locate within their borders. But few would argue that such incentives do more than affect the location of economic activity and jobs, and there is considerable doubt that business tax incentives are effective or
efficient in doing even that.13
One source of U.S. job creation that is often overlooked is the nonprofit or third sector. (Both as direct creators of jobs — the sector which includes universities, hospitals and churches employs onefifth of the labor force — and as cultivators of private initiative which spills over into the forprofit sector.) The size and vitality of this sector is undoubtedly related to
„he f <Λ.. ι, chat it is exempt from most federal and state business
taxes ¡ ar.d that private contributions to a subset of the sector are deductible from personal income taxes. However, we do not kno^ tne job impact of this exemption.
Our review of the literature leads us to conclude that:
o It is doubtful that business tax reductions produce signifi cant increases in business investment;
o To the extent they do, it is in the very firms that are least Likely to create large numbers of new jobs, at least directly; and
13 Roger Vaughan, State Taxation and Economic Development (Washing
ton, DC: Council of State Planning Agencies, 1979); Michael Kieschnick, Taxes and Growth (Washington, DC: Council of State Planning Agencies, 1982); Roger Schmenner, Making Business
14
-o They can create unec-on-omic dist-orti-ons in investment behavior (which is particularly destructive in a time of rapid change and innovation where the best guarantee of intelligent investment decisions is to have lots of in-vestors making individual decisions based on economic, not tax, criteria).
2.1.3 Personal Income Taxes
Reductions in personal income tax rates are often given credit for American job creation. Again, while they have had some effect, we conclude that their contribution is usually over-stated.
Most of the 1981 tax cuts — roughly $600 billion over three years — went toward reducing individual income taxes. Savings (investment) rates have not increased as a result; in fact,
individual savings rates have fallen. The reasons for this are probably many:
o People invest based on the basis of perceived returns; such perceptions were clouded by the récession.
o Tax savings may be (and evidently were) used to increase consumption or leisure, and need not be invested.
o To the extent tax savings found their way into investment, the application of this investment would be mediated by the behavior of the institutions (e.g., banks, savings and
loans, brokers) through whom the funds were invested. Often these financial institutions find it difficult to invest in smaller, younger, and collateral-poor businesses since
information and transaction costs are high.
The growth of the venture capital industry in the late 1970s is
often giv3h credit for the growth of entrepreneurship, and a cut
in capital gains rates in 1978 is given credit for the growth of venture capital. Few would dispute that the reduction in capital
gains rates contributed to the growth of the venture capital industry and in turn to the growth of entrepreneurship, but its
impact is usually overstated:
o The growing importance of entrepreneurship started well before the growth of the venture capital industry.
o The venture capital industry, while showing dispropor-tionately large returns in terms of employment, profita-bility, and innovation, is still quite small — roughly $20
billion in a $5 trillion economy. Each year it invests in only a few thousand of 650,000 new businesses, and in a relatively few sectors (high technology chief among them) and states.
15
o Changes in the regulation of pension funds has played a critical role in the development of the Industry. In 1978, along with the capital gains reduction, the U.S. Department of Labor was revising the interpretation of the Employee Retirement Investment Security Act of 1973 (ERISA). Prior to 1978, the Department of Labor asserted that venture capital was "too risky" an investment for private pension funds. After 1978, however, the Department of Labor agreed that such investing could be examined in the context of a fund's overall investment strategy, thereby freeing funds to place a small portion of their assets in venture capital. States also began to allow public pension funds to invest a portion of their assets in venture capital. By 1982, pension funds were providing onethird of the new funds committed to
privately managed venture capital pools. In addition,
nontaxed endowments and foundations are making substantial commitments to venture capital, In total, taxexempt
investors are responsible for providing approximately 40 percent of new capital financing into the venture capital industry. It is, to put it mildly, unlikely that the
behavior of these investors was significantly influenced by cuts in the capital gains tax. (See Kieschnick in "The
Venture Capital Boom," Politics and Markets, Washington, DC: The Gallatin Institute, February 1984.)
The ability of personal tax cuts to influence investment in
entrepreneurship is limited by the fact that they are relatively blunt instruments — inevitably providing windfalls to people who do not change their behavior as a result. Cost effective
incentives need to be carefully designed. There are ways that both the federal and state tax codes might stimulate investment in entrepreneurship.
o Reducing the favorable treatment accorded real estate development which draws investment away from business
d ev·? ' " ρτ.ent, for example, by capping or eliminating the
mort;'.?ge interest deduction as proposed by the U.S. Treasiry'a 1984 Tax Reform package.
o Allovi.ig equity investments in new ventures in depressed
areas .0 be written off as losses upon investment.
flailing capital gains rates on nonproductive investment (e.g. collectibles) and reducing rates on productive investment as California and New York have done.
o Pt cvid.'.ng tax credits for investments in statechartered
ventur» capital corporations as Indiana and Wisconsin have doni
2.2 Hîgulat.'.on and Job Creation
16
-seen changes combined with a new President could result in re-regulátion. No study has yet tried to assess the overall impact of deregulation; the primitive "state of the art" would render any such study methodologically suspect.
The impact of deregulation on job creation is especially un-certain. Improved efficiency, however defined, and not job
creation, is usually considered the proper goal of deregulation. Therefore if increased efficiency is accompanied by job losses in an industry (which has in fact occurred), many observers would not conclude that the reform had necessarily failed. Moreover, in the real world (e.g., the severe recessions of the early. 1980s) it is extremely difficult to apportion job losses in deregulated industries to one factor over another. Finally, if deregulation does stimulate job creation, it is likely to occur outside the deregulated industry, and would not be measured by industry-specfie studies.
2.2.1 Background
The past dozen years have witnessed the rise and pause of an unprecedented deregulatory movement in the United States. Regulations instituted over the past century to protect the public against either monopolies or the drawbacks of a market economy'were attacked for aiding monopolies and hindering economic growth.
The deregulatory debate moved to the forefront of national
attention in early 198I when President Reagan made it one of the cornerstones of his economic program (the other three were budget and tax cuts and a restrictive monetary policy). According, to Reagan, unnecessary regulations were costing American businesses over $100 billion annually and had been a major cause of the slow growth of the 1970s.
Although in a sense regulation constitutes everything that the
federal government does, the regulation debate in the U.S. is usually focused on two types of regulation: economic and
social. Economic regulation controls prices, condition of market
entry and exit, and conditions of service in specific industries thought to require regulation to protect the public interest. Some examples are the airline, trucking, telecommunications,
financial, and railroad industries. By contrast, social regula-tion is generally not industry-specific, but instead attempts to protect the environment, workers' health and safety, and consumer safety by regulating a variety of industries. The Environmental Protection Agency, the Consumer Product Safety Commission, and the Occupational Safety and Health Administration are examples of social regulatory agencies. The two categories do overlap to some extent (e.g., the National Highway Traffic Safety Admini-stration represents social regulation applied to the auto industry), but the division is still extremely useful in ex-amining the history of deregulation.
17
political scientists that competition instead of regulation would better serve the public interest; (2) broad political discontent with the status quo by free market conservatives, liberals such as Senator Edward Kennedy, and consumer advocate Ralph Nader; (3) an altered economic environment caused by high inflation and
technological innovation which provided an impetus for change; and (4) increasing distrust and dissatisfaction with government produced by the Vietnam War and the Watergate scandal. (See especially Martha Derthick and Paul J. Quirk, The Politics of Deregulation, Brookings Institution, 1985.)
The result was a remarkable series of successful deregulatory efforts in the airline, trucking, financial and railroad indus tries between 1975 and 1980. Interestingly, at the same time the Carter Administration undertook a serious effort to strengthen social regulations in a variety of areas. Reforms in this area were limited to attempts to improve the regulatory process and introduce greater rationality into the system.
Advocates of economic deregulation — which included nearly everyone outside the affected industries by the late 1970s — believed it would directly lead to lower prices, increased
efficiency, and greater innovation. These effects would in turn stimulate economic growth and concomitant job creation. Aside from costs associated with making a transition to deregulation, it was commonly believed that few if any problems would be caused by retrieving the government's visible hand from these indus
tries .
While economic deregulation was being implemented, the groundwork was being laid for social deregulation. Unlike economic regula tion, it was clear that social regulation conferred important benefits on the public. The question increasingly raised here, by business groups as well as some economists, was whether the costs of regulation were outstripping the benefits. A ground breaking and controversial study by Murray Weidenbaum (Murray L. Weidenbaum and Robert DeFina, The Cost of Federal Regulation of
Ei. o nom i u Ajtiviny, American Enterprise Institute, 1978) — later
Prt Vident "fis« gan's first chair of the Council of Economic
Advisors ■ was the basis for Reagan's claims that social
regulations cost an unnecessary $100 billion annually. Their use of costbenefit analysis (CBA), which suffered among other
ici sets from the need of placing a monetary value on the benefits of good health or even life itself, was subjected to much
criticism. (See especially Mark Green and Norman Waitzman,
Business War on the Law, Corporate Accountability Research Group;
197ΤΠ
As noted earlier, President Ronald Reagan elevated the issue to national attention in 198I. Although his Administration did continue economic deregulatory efforts (in the busing industry and further deregulation of the financial industry), the primary focus of its program was social deregulation. The Administration moved to centralize authority for the regulatory process in the White House's Office of Management and Budget; reduce regulatory activity by drastically cutting the budget of the agencies
involved; appoint people to head the regulatory agencies who were
18
-opposed to regulation; create a Presidential Task Force on
Regulatory Relief headed by Vice President George Bush; and seek legislative reform.
In contrast to economic deregulation, no consensus on social
deregulation existed with regard to the Reagan program. In fact, public opinion polls showed that if anything the public wanted health and safety regulations strengthened (see New York Times, "Rising Concern on Consumer Issues in Found in Harris Poll," Feb.
17, 1983 and Mark Green, "The Gang That Can't Deregulate," New Republic, March 21, 1983) - Several Supreme Court decisions severely limited the use of CBA in setting regulations, and. scandals in the Environmental Protection Agency effectively halted the Administration's efforts in 1983. No social regula-tory reform legislation has been passed, and proposals to
delegate regulatory authority to the states were abandoned. The Administration's program had its greatest impact through refusing to issue new regulations and relaxing enforcement of rules
already on the books.
2.2.2 The Results of Deregulation
It is important to reeraphasize that the deregulated Industries are still in a period of transition, making all conclusions in this area extremely tentative. Nevertheless, the following is a summary of what is known about the Impact of deregulation in several areas.
To date, airline deregulation appears to have been a success. The
U.S General Accounting Office (GAO) concluded that deregulation resulted in lower air fares, increased operating efficiency, and better consumer service. Although the industry underwent its worst financial performance in its history during the six years following deregulation in 1978, the situation had rebounded by mid-1983. The following year witnessed the highest operating
profit for the industry in 11 years. ("Deregulation: Increased
Competition is Making Airlines More Efficient and Responsive to
Consumers,'1 GAO, Nov. 6, 1985). However, some observers are
concerned that concentration is beginning to occur in the airline
industry.
Telecommunications deregulation did not occur until January 1, 1984 with the break-up of the American Telephone and Telegraph monopoly, making it too early to determine what the overall impact has been. Some obvious benefits have been greater
innovation and product diversification, more rapid introduction of new technologies, and lower long distance rates and equipment · costs. However, the transitional period has also seen abundant
confusion, high residential rates, increased service costs accompanied by poorer service, concerns about affordable phone service for the poor, and the threat that large phone users will bypass the system to save money and thereby endanger a unified telecommunications network.
Similarly, there has been no clearcut result issuing from
19
-interstate banking); and 3) product diversification (e.g., the
expansion of services by banks into non-traditional areas, and the expansion of securities firms and insurance companies into deposit services traditionally offered only by banks). The last two changes (especially product diversification) have developed more as a result of financial institutions circumventing existing
law than because of government deregulation. The primary effect of the changes has been to make various financial institutions more similar in terras of the services they provide.
Financial deregulation has probably made the flow of funds more efficient. However, observers disagree on whether the reforms
have driven interest rates higher, thereby making credit less available. Given the fact that regulatory response is now
clearly following industry-led changes, it is likely that we have
not seen the end of regulatory reform in the financial area.
Serious concerns have been raised about possible concentration in the industry, the threat to financial stability, and the possi-bility of conflicts of interest in the emerging diversified financial organizations.
On a more positive note, some states are now changing the way financial institutions are regulated to encourage more aggressive investments in economic development:
o Massachusetts is using a Community Reinvestment Act to tie approvals of expansion of bank powers to banks' record of meeting the credit needs of their communities.
o California has passed, and Michigan is likely to soon pass, "loan loss reserve" programs to encourage bank loans to growing businesses.
o Several states have loan guarantee programs to encourage more aggressive bank lending.
o Several states are simplifying securities regulation to make
small of'! årings of securities in new firms easier and cheaper.
If the evidence on the overall impact of deregulation is somewhat inconclusive, it is no surprise that the impact on job creation
It, even more so. However, increased competition does seem to have exerted a downward pressure on wages in the deregulated
transportation industries. Average airline compensation costs in constant dollars declined six percent over 1978-1984. Employment has declined in the airline and railroad industries (employment had been declining in the latter before deregulation), but it is une ear, gi/en the recession, how much of this can be attributed to ueregulation.
Assessing the impact of social deregulation is even more diffi-cult because it affected a broad variety of industries and because of the Reagan Administration's ineffectiveness in