0022-538X/96/$04.0010
Copyrightq1996, American Society for Microbiology
Multivariate Analysis of Human Immunodeficiency Virus
Type 1 Neutralization Data
PHILLIPE N. NYAMBI,1JOHN NKENGASONG,1PAUL LEWI,2KOEN ANDRIES,2
WOUTER JANSSENS,1KATRIEN FRANSEN,1LEO HEYNDRICKX,1PETER PIOT,1
ANDGUIDOVAN DERGROEN1*
Institute of Tropical Medicine, Antwerp,1and Janssen Research Foundation, Beerse,2Belgium
Received 7 March 1996/Accepted 18 June 1996
We report on the use of spectral map analysis of the inter- and intraclade neutralization data of 14 sera of human immunodeficiency virus type 1 (HIV-1)-infected individuals and 16 primary isolates, representing genetic clades A to H in group M and group O. This multivariate analysis has been used previously to study the interaction between drugs and receptors and between viruses and antiviral compounds. The analysis reveals the existence of neutralization clusters, not correlated with the known genetic clades. The structural factors that have been identified may correlate with the most important neutralization epitopes. Three key primary HIV-1 isolates, which allow discrimination of sera that are likely or unlikely to neutralize primary isolates from most of the genetic clades, were identified. Our method of analysis will facilitate the evaluation as well as the design of suitable HIV-1 vaccines, which induce high-titer interclade cross-neutralizing anti-bodies.
Correlates of protective immunity against human immuno-deficiency virus type 1 (HIV-1) infection remain ill-defined. One possible strategy is to pursue an experimental vaccine capable of inducing broadly neutralizing antibodies in a naive individual. At present, nine genetic subtypes or clades of HIV-1 (A to I) in group M (major) as well as the very divergent HIV-1 group O (outlier) have been documented (1, 4, 5, 7, 8, 10, 14, 15, 21–23, 27, 28, 34). A successful HIV-1 vaccine should be potent against HIV-1 subtypes from all of the clades. This may require the antigens of multiple clades to be included in a cocktail vaccine formulation or the inclusion of a set of antigens common to all genetic subtypes. Recent neutraliza-tion data obtained with peripheral blood mononuclear cells (PBMCs) (15, 25, 30) and primary HIV-1 isolates representing all known genetic clades and both autologous and heterolo-gous HIV-1 sera show that the genetic clades do not corre-spond to neutralization clusters. Here, we try to answer two basic questions: can sera from HIV-infected individuals be classified according to their capacity to neutralize primary iso-lates representing eight (A to H) genetic clades, and if so, against how many isolates, and which ones, should such a serum be tested to enable this classification? To address these questions, we have performed inter- and intraclade neutraliza-tion assays using primary isolates from clades A through H in group M and three isolates from group O and both autologous and heterologous HIV-1-positive sera. For the first time, spec-tral map analysis is applied to the inter- and intraclade neu-tralization data. (This method of multivariate analysis has been used earlier to study the interaction between drugs and recep-tors [17–20] and between viruses and antiviral compounds [3]). We conclude that the genetic clades do not readily correspond to neutralization clusters. Three key primary HIV-1 isolates, which allow discrimination of sera that are likely or unlikely to
neutralize primary isolates from eight different genetic clades (A to H), as well as isolates of group O, were identified.
MATERIALS AND METHODS
Patient sera.A total of 14 sera obtained from patients from whom HIV-1 had
been isolated were tested for the presence of neutralizing antibodies. Of these, 11 were from patients infected with group M viruses (subtypes A to H) and 3 were from patients with group O viruses. Sera and isolates were named according to the genetic clade to which they belong and correspond with the viruses we have previously described (13, 14, 21, 28, 33). For example, serum CA1 was named A1 since it belonged to a patient from whom virus CA1 (a1), which belongs to genetic clade A (Table 1), was isolated. The clinical stages of the patients whose sera were used to generate the neutralization data depicted in Table 1 are based on the World Health Organization clinical definition of AIDS (37). In addition, 19 sera (7 from HIV-1- and 10 from HIV-2-infected patients and 2 from chimpanzees naturally infected with simian immunodeficiency virus [SIVcpz]) were used to test the prognostic value of the three key primary HIV-1 isolates, defined by spectral map analysis.
Virus isolates.Fourteen HIV-1 primary isolates were classified into subtypes
A to H in group M (n511) and in group O (n53) on the basis of phylogenetic analysis of the env (V3 to V5 and beginning of gp41) or gag genes or, in some cases, after heteroduplex mobility analysis, as previously described (13, 14, 23, 28, 30, 34). Viruses had been cultured only once or twice in mitogen-stimulated PBMCs (30). In addition, two HIV-1 laboratory strains, MN (b2) and MAL (d2), were used. These isolates, provided as chronically infected H9 cells, were pas-saged in PBMCs to eliminate the influence of any host cell-dependent epigenetic factors on virus neutralization, as previously described (30).
Neutralization assay.Virus neutralization was performed as described
previ-ously (29, 30). Tissue culture supernatants of PBMCs infected with virus (50 50% tissue culture infective doses) and twofold serial dilutions (1:10 to 1:1,280) of heat-inactivated (568C for 30 min) serum were incubated for 1 h at 378C in a 5% CO2atmosphere before addition of 53104 3-day-phytohemagglutinin-stimu-lated PBMCs for 2 h. The cells were washed and incubated in RPMI 1640 IL-2 medium (Gibco, Paisley, Scotland), supplemented with 10% fetal calf serum, 0.03%L-glutamine (Janssen Chimica, Geel, Belgium), and antibiotics. The
pres-ence of residual anti-p24 antibodies after washing was monitored carefully to minimize interference with the p24 antigen measurement. Virus replication was assessed after 7 days by an in-house p24 antigen-capturing enzyme-linked im-munosorbent assay (ELISA). Neutralizing titers of,1:10 were not considered significant and were scored as negative. Fifty- and ninety-percent inhibitory doses (ID50s and ID90s) were defined as the highest serum dilutions that produced$50 and$90% reductions in p24 antigen production.
Data analysis.The neutralization data were subjected to spectral map analysis, a multivariate statistical method of data analysis, which has been used previously to study the interaction between drugs and receptors (17–20) and between viruses and antiviral compounds (3). Briefly, this multivariate analysis includes the following steps. First, logarithms are taken from the reciprocal ID50s and/or ID90s. Then, the logarithm titers are double centered. We apply principal-* Corresponding author. Mailing address: Institute of Tropical
Medicine, Nationalestraat 155, B-2000 Antwerpen, Belgium. Phone: (32) 3 247 63 19. Fax: (32) 3 247 63 33. Electronic mail address: cmaeckelbergh @microbiol.itg.be.
6235
on November 9, 2019 by guest
http://jvi.asm.org/
component analysis to the logarithmically transformed and double-centered data. The sera and isolates are weighted by means of their corresponding po-tencies and sensitivities. The latter are defined as the mean logarithmic neutral-ization titers of the corresponding sera and isolates. The next step involves the calculation of the factor scores (for sera) and factor loadings (for isolates). Finally, a diagram representing the sera and isolates in the plane of the three dominant components is constructed by using the computed scores and loadings as the coordinates of the representative points. The details of the method are explained in the Appendix. Cluster analysis has been applied to the computed scores (for sera) and loadings (for isolates) by means of the unweighted pair-group mean arithmetic method (32).
RESULTS
Inter- and intraclade neutralization by HIV-1
antibody-pos-itive sera. Extreme precautions were taken to guarantee the
reproducibility of the neutralization data. The p24 antigens of different subtypes in group M as well as p24 antigens of group O were captured equally well by the in-house p24 antigen-capturing ELISA (30). In each neutralization assay with PB-MCs, the virus used was titrated again to check the titer. If the titers differed by more than a factor of 3, the neutralization assays were considered invalid and were repeated. We ob-served that neutralizing antibody titers of sera were reproduc-ible, as long as the variation in virus titer was within the ac-ceptable range of a factor of 3. This control procedure allowed us to obtain reproducible neutralization data, regardless of the use of PBMCs of different healthy donors, and resulted in a low noise rate in the multivariate analysis.
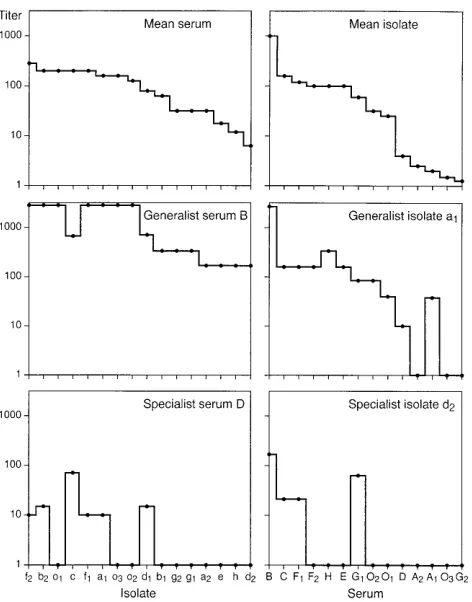
In this article we describe the neutralizing activities of 14 autologous and heterologous sera against 13 primary HIV-1 isolates from subtypes A through H in group M and three isolates in group O. The IDs are listed in Table 1. The potency of a serum is related to the (geometric) mean of the titers in the corresponding spectrum (and is defined as the logarithm of this mean). For example, serum B (Table 1) is a potent serum, whereas G2 is a nonpotent one. The sensitivity of an isolate is similarly related to the (geometric) mean titer in the corre-sponding spectrum. For example, isolate f2 is considered to be sensitive, whereas isolate d2 is considered nonsensitive. Sera and isolates whose neutralization spectra differ in shape from the mean serum or isolate neutralization spectrum are called
“specific” or “specialist” (Fig. 1). Those that are similar in shape to the mean neutralization spectrum are called “non-specific” or “generalist.” For example, serum B is a potent generalist, and D is a nonpotent specialist serum. Similarly, isolate a1 is a sensitive generalist, and d2 is a nonsensitive specialist isolate (Fig. 1).
Spectral map analysis.The neutralization data in Table 1
were subjected to spectral map analysis. The factors extracted from neutralization data in Table 1 by spectral map analysis account for the specificities of the data, i.e., deviations of a particular serum or isolate neutralization spectrum from the mean neutralization spectrum. We distinguish between struc-tural factors, which account for systematic variation in the data, and random factors, which account mainly for noise and artifacts. The number of structural factors present in the data of Table 1 was determined by means of cross-validation (32), as explained in the Appendix. It was concluded that there are four structural factors in the data, and this indicated that a signifi-cant amount of data reduction can be achieved (data not shown). The four factors accounted for 37, 23, 14, and 9% (total, 83%) of the variation of the specificities in the data, respectively. Nine higher-order factors, which represented mainly noise and artifacts accounted for the remaining 17%. The results of the analysis are displayed graphically in Fig. 2 and 3, in which the coordinate axes (horizontal and vertical) represent the two most important computed factors. Figures 2 and 3 show the spectral maps of the sera and isolates, respec-tively. They can be viewed together and can be (mentally) superimposed by making the origin (represented by a cross at the center of the graph) and the coordinate axes coincident.
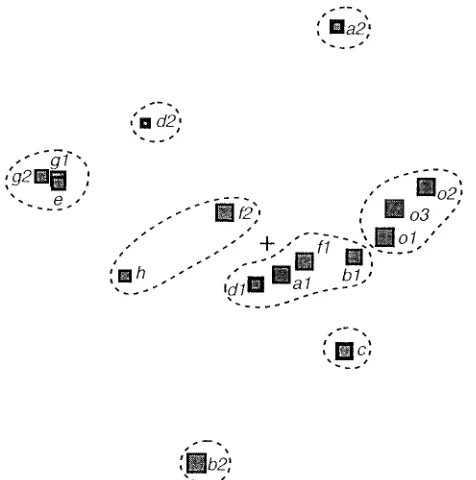
[image:2.612.56.558.91.297.2]On the neutralization spectral map of the sera (Fig. 2) one cluster of potent generalist sera (B and F2) and seven specialist clusters, of which four are single sera, can be observed. On the neutralization spectral map of the isolates (Fig. 3) we distin-guish two clusters of generalist isolates (isolates a1, b1, d1, and f1 and isolates h and f2) and six specialist clusters, of which four are single-isolate clusters. Note that the neutralization spectra of the three HIV-1 group O isolates (o1 to o3) form a separate cluster.
TABLE 1. Neutralizing antibody titers to 13 primary HIV-1 isolates of diverse genetic clades (a to h) in group M and three isolates in group O by homologous and heterologous sera of HIV-infected individuals
Seruma [genetic subtype]
Titerbto isolate:
CA1 (a1)
VI191 (a2)
MN (b2)
CA5 (b1)
VI313 (c)
CI13 (d1)
MAL (d2)
CA10 (e)
CA4 (f1)
CA20 (f2)
VI525 (g1)
VI526 (g2)
CA13 (h)
CA9 (o2)
ANT70 (o1)
VI686 (o3) Mean
CA1 (S) [A1] 40 20 1 1 10 1 1 1 1 1 1 1 1 1 1 1 2
CA18 (AS) [A2] 1 1 1 1 1 1 1 1 1 10 1 1 1 20 20 20 2
CA5 (AS) [B] 2,560 160 2,560 320 640 640 160 160 2,560 2,560 320 320 160 2,560 2,560 2,560 955
VI313 (AS) [C] 160 160 80 80 160 80 20 80 160 640 160 160 10 320 640 320 158
VI918 (S) [D] 10 1 20 1 80 20 1 1 10 10 1 1 1 1 1 1 4
CA10 (S) [E] 160 10 640 40 160 80 1 80 160 160 80 160 20 80 80 160 93
CA4 (S) [F1] 160 20 2,560 80 320 160 20 40 160 320 40 80 40 80 320 80 138
CA20 (AS) [F2] 160 320 160 80 160 80 1 10 320 320 20 20 10 320 320 160 105
VI525 (S) [G1] 80 40 40 40 160 160 80 80 160 320 80 80 20 40 40 20 71
VI526 (S) [G2] 1 1 1 1 1 1 1 1 1 1 1 1 20 1 1 1 1
CA13 (S) [H] 320 10 640 80 160 80 1 20 320 320 80 20 40 40 160 320 105
VI498 (AS) [O1] 40 1 80 40 640 40 1 1 40 40 1 1 1 160 320 40 26
CA9 (S) [O2] 80 80 20 80 160 40 1 1 160 40 1 1 1 160 80 320 33
VI686 (S) [O3] 1 1 1 1 1 1 1 1 1 1 1 1 1 1 20 80 2
Mean 162 32 214 59 186 89 6 21 186 234 32 32 14 135 200 155 94
a
Clinical stages, based on the World Health Organization clinical definition of AIDS (37) (S, symptomatic; AS, asymptomatic), are given in parentheses. b
Reciprocal serum dilution causing 50% neutralization of the primary HIV-1 test isolate. Titers lower than 10 are given as 1; titers in excess of 1,280 are given as 2,560.
on November 9, 2019 by guest
http://jvi.asm.org/
Determination of key isolates required for differentiation
between generalist and specialist sera. Only three of the 16
isolates are required for discrimination between generalist and specialist sera (data not shown). From the 12 feasible combi-nations of the 16 isolates, we chose b2, g1, and o2 as the 3 isolates which best reproduced all 14 specificities of the sera (see Appendix). The criterion for the selection of key isolates was based on the correlation between the observed (logarith-mic) titers for the remaining 13 isolates and those predicted from the 3 key isolates. In the case of the key isolates b2, g1, and o2, the mean correlation over the 13 remaining isolates was 0.90 (range, 0.70 to 0.98). The 11 other feasible combina-tions of three key isolates produced comparable, although slightly lower correlations. Inclusion of additional isolates did not substantially improve the correlation. Figure 4 shows the triangular map of the sera with respect to the three selected key isolates. The three key isolates (Fig. 4) were capable of predicting the same qualitative information regarding gener-alist and specigener-alist sera as would be derived from all 16 isolates (Fig. 2). The requirement of only 3 isolates for the character-ization of the serum neutralcharacter-ization spectra, instead of the orig-inal 16, presents an obvious economical advantage.
We investigated the quantitative predictive ability of the three selected key isolates (Fig. 4) using internal validation by the “leave-one-out” method (see Appendix). In this approach, we systematically removed one serum from the table and
pre-dicted its titers for the 13 remaining isolates, using only the titers of the key isolates b2, g1, and o2. This calculation was repeated for all 14 sera. The mean correlation between ob-served and predicted (logarithmic) titers of the 13 nonkey isolates amounted to 0.84 (range, 0.40 to 0.97). The accuracy of the prediction could not be substantially improved by including additional isolates (data not shown).
The predictive ability of the three key isolates was tested further by means of external validation. For this purpose, we determined the neutralization spectra of 19 additional sera (7 HIV-1, 10 HIV-2, and 2 SIVcpz) for the same 16 isolates, which
we described above, after the multivariate analysis had been completed (data not shown). The mean correlation between observed (logarithmic) titers of the 13 nonkey isolates and those predicted from the 3 key isolates amounted to 0.82 (range, 0.61 to 0.94). The result of this external validation agrees well with that of the previously described internal vali-dation.
Structural factors in the neutralization data may correlate
with epitopes in primary HIV-1 isolates. Sera and isolates
[image:3.612.61.297.67.368.2]cluster according to their neutralization specificity (Fig. 2 and 3). Figures 2 and 3 can be superimposed, and specificities of clusters of sera and isolates can be identified. For example, the neutralization spectrum of serum O2 is specific in a positive way for the cluster containing isolates o1 to o3, since both the serum and the isolate cluster are positioned at a distance and in the same direction from the center (cross sign). This positive specificity agrees with the relatively high titers (80, 160, and 320) of serum O2 for isolates o1 to o3 (Table 1). On the contrary, the serum cluster composed of sera E, H, and F1 has a negative specificity for isolate a2. Both the sera and isolates are at a distance and point to opposite directions from the center. This agrees with the relatively low titers (10, 10, and 20) of sera E, H, and F1 for isolate a2 (Table 1).
FIG. 1. Neutralization spectra of mean, generalist, and specialist isolates and sera. The spectra of a generalist serum (B) and isolate (a1) are similar in shape to those of the mean serum and isolate. The spectra of a specialist serum (D) and isolate (d2) are dissimilar in shape from those of the mean serum and isolate spectrum. The degree of difference between the shapes of a particular spectrum and the mean spectrum is called specificity. A generalist serum or isolate has low specificity, while a specialist serum or isolate possesses high specificity. The vertical scales are logarithmic. Values larger than 1,000 are not differentiated from each other in the figure.
FIG. 2. Spectral map of serum neutralization spectra. Serum neutralization spectra are represented by circles. Areas of circles are proportional to the potencies of the corresponding sera. The center of the map (1) represents the mean serum neutralization spectrum (SNS). The distance of a circle from the center is proportional to the specificity of the corresponding serum. Generalist sera are close to the center. Specialist sera are distant from the center. The dashed contours represent clusters of SNS, obtained by the unweighted pair-group mean arithmetic method (32). Eight clusters of SNS have been identified. The horizontal and vertical dimensions of the map represent the two most important factors of the SNS. A third factor is encoded by the variable thickness of the circumferences of the circles. Circles with thick circumferences represent sera that lie markedly above the plane of the map. Circles with thin circumfer-ences represent sera that are situated markedly below the plane. The three factors account for 37, 23, and 14% of the specificity of the SNS, respectively. Serum B appears as the most potent and generalist serum.
on November 9, 2019 by guest
http://jvi.asm.org/
[image:3.612.321.549.438.604.2]The above-mentioned approach allows us to calculate the specificities of sera for particular isolates and vice versa as depicted in Table 2. In this analysis sera with weak potencies— A1, A2, D, G2, and O3—have been omitted. Similarly, isolate d2 has been omitted because of its lack of sensitivity. Nonpo-tent sera and nonsensitive isolates are not expected to contrib-ute significantly to the elucidation of the neutralization pro-cess. The specificities depicted in Table 2 represent the average specificities in each cluster. For example, serum C has a pro-nounced positive specificity for isolate a2 and a strong negative specificity for isolate b2. Sera O1 and O2 have a strong positive specificity for the o1 to o3 isolate cluster. The potent generalist sera B and F2 have low specificities for all isolates. Two clus-ters of sensitive generalist isolates—isolates a1, b1, d1, and f1 and isolates f2 and h—demonstrate low specificities for all sera. The potent sera C, G1, and O2 on the one hand and E, F1, H, and O1 on the other possess opposite specificities for isolates a2 and b2, respectively (Table 2). A positive specificity for isolate a2 is always alternating with a negative specificity for isolate b2.
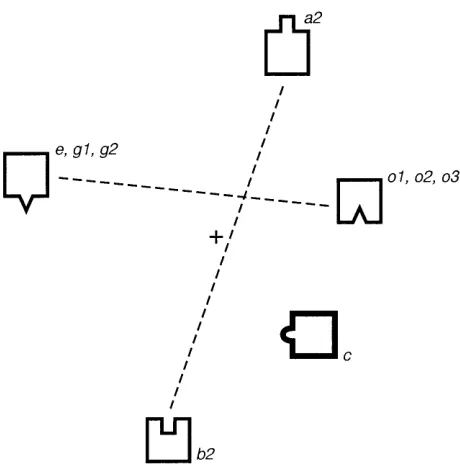
This may point to the existence of an epitope in isolates a2 and b2 that is functionally dimorphic. We refer to it as a “dimorphic epitope.” The cluster of isolates o1 to o3, e, g1, and g2 also represent a dimorphic epitope, which is distinct from the previously identified one (a2/b2). A third epitope, different from the previous two, is determined by the c isolate. The two dimorphic epitopes are represented in Fig. 5 by small squares and triangles, respectively. The epitope which is specific for isolate c is represented by a semicircle. Our analysis in Table 2 does not exclude the existence of an epitope which is common to all isolates. This study, which involves polyclonal sera, i.e., mixtures of antibodies, does not allow determination of the existence of a common epitope.
DISCUSSION
To our knowledge, this is the first time that spectral map analysis has been used to analyze the neutralizing activities of sera against primary HIV-1 isolates from patients infected with HIV-1 isolates representing subtypes (A to H) in group M as well as group O. Our goal was to identify sera and isolate neutralization serotypes and to study how they were correlated with the genetic subtypes. The spectral map analysis allowed us to identify eight statistically robust sera as well as HIV-1 isolate neutralizing serotypes and confirms our previous findings (30), and those of others (13, 24), that sera and isolates belonging to the same genetic clade are not necessarily clustered in the same neutralization serotype.
A second interesting observation was that only 3 of 16 pri-mary HIV-1 isolates were required in order to characterize a serum neutralization spectrum and consequently to identify a particular serum neutralization serotype. The spectral map (Fig. 4) with only the three key isolates (b2, g1, and o2) was capable of predicting the same information regarding the se-rum neutralization spectra as the one derived from the spectral map of the 16 HIV-1 isolates (Fig. 2). The correlation between predicted and observed data amounted to 0.84. In order to confirm the capacity of the three isolates, b2, g1, and o2, to predict the serum neutralization spectrum of the 16 isolates in Table 1, we tested 19 additional sera of HIV-1-, HIV-2-, and SIVcpz-infected individuals which had not been included in the
spectral map analysis. As expected, the spectral map with the three key isolates (Fig. 4) was also capable of predicting the full neutralization spectrum of each of the 19 sera. The corre-lation between predicted and observed data was 0.82.
Plotting the ratios of the neutralization antibody titers of the sera obtained for the three key isolates in the triangular spec-tral map (Fig. 4) allowed discrimination of sera that are likely or unlikely to neutralize primary isolates from genetic clades A to H in group M as well as isolates in group O. The above-mentioned analysis could be used as a tool in the search of a candidate vaccine, assuming that sera with a generalist potent neutralization profile (sera capable of neutralizing HIV-1 iso-lates from different clades with a relatively high titer) may protect a vaccinee against infection with HIV-1 or an infected patient against progression to AIDS. The use of only 3 key isolates for the characterization of a serum neutralizing sero-type related to the 16 primary HIV-1 isolates in Table 1 is an obvious economical advantage. A larger number of sera of HIV-1-infected individuals are now being tested for their ca-pacity to neutralize the three key isolates, in order to validate further the above-mentioned observations.
A third interesting finding was that spectral map analysis of ID50s in Table 1 allowed us to calculate the specificities of sera
[image:4.612.61.299.69.309.2]for particular isolates and vice versa, as depicted in Table 2. Furthermore, the structural factors that are present in the neutralization data can thus be correlated with the existence of at least three epitopes playing a role in the interaction with neutralizing antibodies, as shown in Fig. 5. Our analysis leads to an interpretation of the first three computed factors of the spectral map (Fig. 2 and 3) in terms of inferred epitopes. The major structural factor can be related to the dimorphic epitope which opposes the cluster of isolates e, g1, and g2 to the cluster o1 to o3. The second important factor correlates with the dimorphic factor which opposes isolates a2 and b2. A third factor is associated with the epitope of isolate c. As already indicated, the three factors account for 37, 23, and 14%, re-spectively (total, 74%), of the variation in specificities among sera and isolates. These factors are oriented along the hori-zontal, vertical, and depth axes of the spectral map. The fourth FIG. 3. Spectral map of isolate neutralization spectra. Isolate neutralization
spectra (INS) are represented by squares. The spectral map of isolates should be read in the same way as the map of SNS (Fig. 2). The three factors that are shown account for 37, 23, and 14% of the specificities of the isolates. The areas of the squares correspond with the sensitivities of the isolates. The dashed contours around the squares define eight clusters of INS calculated by the unweighted pair-group mean arithmetic method. Isolates a1, b1, d1, and f1 and isolates f2 and h can be considered generalist sensitive isolates.
on November 9, 2019 by guest
http://jvi.asm.org/
structural factor (which contributes only 9% of the variation) remains unexplained. It might be due to a common epitope.
However, it is our thinking as well as that of others (24) that the neutralization process is more likely to be ruled by anti-bodies to rather complex conformational epitopes present in the native form of the envelope glycoproteins (9, 12, 25, 33, 35). This, however, does not exclude the role of discontinuous linear epitopes in the envelope glycoproteins (6, 11, 26, 31).
We already mentioned that the three key isolates o2, g1, and b2 allowed positioning of the sera in a triangular spectral map (Fig. 4) which is in good agreement with the spectral map obtained with all 16 isolates (Fig. 2). This suggests that epitopes present in the isolates o2, g1, and b2 may be of major importance for the prediction of neutralization activities of the remaining isolates.
So far, our discussion has been based on spectral map anal-ysis of ID50s in Table 1. To what extent are these conclusions
affected by analysis of ID90s? We compared the 50%
neutral-ization titers of the 14 sera and 16 isolates with the correspond-ing 90% titers (data not shown). On average, the 50% titers exceeded the corresponding 90% titers by a factor of 3.8. Consequently, less negative titers were observed with the ID50
data (35% of the total) than with the ID90data (52% of total).
We also obtained 53 pairs of replicates of both ID50and ID90
determinations (data not shown). The correlations between replicated (logarithmic) ID50s was larger than the
correspond-ing correlation of ID90s (0.92 versus 0.83). Spectral map
anal-ysis yielded one more structural factor from ID50data
com-pared with ID90data (four versus three). Furthermore, the
structural information extracted from ID50 data was also
greater than that from ID90data (83 versus 78% of the total
variation in specificities).
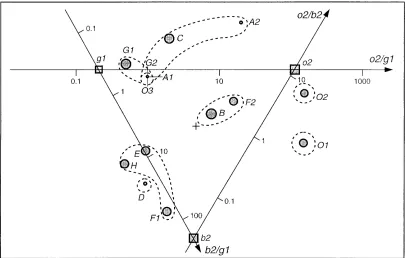
[image:5.612.104.509.71.329.2]These differences notwithstanding, the results of spectral map analysis of the 50% neutralization titers showed good overall agreement with those of the 90% titers. The same three isolates (b2, g1, and o2) could be identified as candidates for FIG. 4. Triangular spectral map of serum neutralization spectra (SNS) using three key isolates, g1, o2, and b2. By using only three sensitive and specific key isolates, the SNS are positioned similarly to the positioning in Fig. 2. Dashed lines join the serum clusters and emphasize the central position of the generalist sera B and F2. Also in this analysis, serum B still appears as the most potent and generalist serum. Each serum in this figure can be positioned by means of three ratios of neutralization titers of the serum for the key isolates b2, g1, and o2. For example, the position of serum B is determined by the vertical projection of circle B upon axis o2/b2. The intersection of the vertical projection with this axis yields a value of 1. This corresponds with the ratio of the titers of serum B for isolates o2 and b2 (2,560/2,5605
1) as indicated in Table 1. The position of serum B is also determined by the intersections of the vertical projections with axes o2/g1 (2,560/32058) and b2/g1 (2,560/32058).
TABLE 2. Average specificities of neutralization clusters of sera and isolates
Serum
Specificitya
Specialist isolates Generalist isolates
a2 b2 o1 to o3
e, g1, g2 c
a1, b1, d1, f1 f2, h
Specialist sera
C 1.1 21.6 0.4 0.8 21.1 20.4 0.2
G1 1.1 21.2 21.4 1.5 0.3 20.1 0.5
E, F1, H 21.3 1.5 20.5 0.5 20.2 0 0.2
O1 22.0 0.7 1.1 22.5 2.3 0.2 20.8
O2 2.3 21.4 1.1 22.4 1.0 0.7 20.9
Generalist sera B, F2 0.4 20.3 0.4 20.2 20.4 0 20.1 aObtained by taking logarithms and double centering of the original neutral-ization titers (Table 1). Double centering simultaneously corrects the titers for differences in potencies and sensitivities of the corresponding sera and isolates. In the case of clusters of sera (e.g., E, F1, and H) and isolates (e.g., o1 to o3) the specificities were averaged over the elements of the clusters. A high positive value indicates strong positive specificity (attraction) of the corresponding serum and isolate. A high negative value indicates strong negative specificity (repulsion) between the corresponding serum and isolate. Note that specialist sera and isolates have strong positive and negative specificities. Generalist sera and iso-lates show only weak specificities. As explained in the text, this abridged table of specificities allows determination of the number and nature of epitopes that are involved in the neutralization of the isolates by the sera used in the study.
on November 9, 2019 by guest
http://jvi.asm.org/
[image:5.612.316.557.490.628.2]the role of key isolates. They appeared as distinct specialist isolates on the spectral maps of both ID50s and ID90s. Isolates
o1 to -3 also formed a specialist cluster with specificity for the O1 and O2 sera in both cases. Serum B appeared as the most potent generalist serum on the spectral maps of 50 and 90% neutralization. Overall, the (logarithmic) ID50of the 16
iso-lates correlated well with the corresponding ID90(mean, 0.79;
range, 0.53 to 0.90).
For these reasons, we conclude that 50 and 90% neutraliza-tion data do not provide conflicting informaneutraliza-tion. The 50% data, however, contain less noise and reveal more structure. Hence, they are more useful for the prediction of specificities between sera and isolates by means of multivariate analysis of cross-sectional data such as that presented here.
Correlation of the results of spectral map analysis with se-quence and glycosylation information for the different isolates is ongoing. No correlation was observed between the clinical stage of the HIV-infected individual and the serum and/or neutralization spectrum (Table 1). For future vaccine develop-ment it may be of interest (i) to characterize the epitopes of the HIV-1 isolates which have induced antibodies in potent gen-eralist sera, (ii) to characterize the possible common epitopes in the key isolates, (iii) to determine whether potent specialist sera contain antibodies which recognize epitopes in the three key isolates that are different from common epitopes, and (iv) to monitor whether the common epitopes present in the three key isolates, when presented in a suitable vaccine preparation, can induce high-titered broad cross-neutralizing antibodies. A larger number of primary isolates and sera of genetic clades A to H of group M, and more isolates of group O, as well as isolates of newly discovered clades should be included in future
experiments in order to extend the scope of the multivariate analysis and to better define the key isolates.
There are two main conclusions from our work. First, the number of factors ruling the neutralization process of primary HIV-1 isolates of diverse genetic clades by polyclonal sera of HIV-1-infected patients is limited and may correlate with the most important epitopes. Second, a limited number of primary HIV-1 key isolates which allow discrimination of sera that are likely or unlikely to neutralize primary isolates from genetic clades A to H in group M as well as isolates in group O can be identified. These two observations will make it easier to iden-tify the sera that are able to neutralize efficiently primary HIV-1 isolates of diverse genetic clades as well as to identify the epitopes which induce them. The results of our analysis could be used to screen for HIV-1 vaccines that induce high-titer cross-neutralizing antibodies. It may also facilitate the selection as well as the design of antigens to be incorporated in suitable HIV-1 vaccine preparations.
APPENDIX
Spectral map analysis.Spectral map analysis, in its simplest form, can be defined as principal-component analysis of a logarithmic and double-centered data table. The method can be applied to data that are defined on ratio scales, such as those obtained in bioassays in the form of 50% effective dose, 50% inhibitory concentration, ID50, etc. A
generalized variant of the method makes use of variable weights that are assigned to the rows and columns of the table. We will define the various steps of the method below.
(i) Step 1. In the case of bioassay data it is mandatory to take reciprocals of the original data, such that the larger values correspond with the larger biological activities. Then, logarithms are taken, since the biological effect in bioassays is usually proportional to the loga-rithm of the (reciprocal) dose, concentration, dilution, etc., rather than to the untransformed data. We refer to logarithmic and reciprocal 50% effective doses, 50% inhibitory concentrations, ID50s, etc., as yij5log
1/xij, with i51. . .n and j51. . .p, where xijis the element in row i and
column j of the original n3p table of bioassay data X and yijis the
corresponding activity value in Y.
(ii) Step 2.In the generalized variant of the method, use is made of variable weights for the rows and columns of the table. These weights will enhance or reduce the effect of a particular row or column on the result of the calculation. Specifically, all sums over rows and columns in the calculation will be replaced by weighted sums over rows and columns. If all weights are identical (to an arbitrary constant), then the result of the calculation will be identical to that of the classical (con-stantly weighted) method. If one or more rows or columns are assigned a weight of 0, then these will not play any role in the analysis, which is carried out as if these rows or columns were not there. In the final result, however, their position is fitted (or predicted) to the result that is obtained from the functional rows and columns.
In the case of neutralization data the row and column weights can be simply defined as the mean values of the corresponding rows and columns in the table of activities Y. Because row and column means depend themselves on weighted sums, this definition appears to be circular. It can be shown, however, that the means and weights can be derived iteratively (i.e., circularly) from the data table, starting from an arbitrary set of weights, e.g., with all values equal to 1. The cycle of the algorithm is then defined as
wcj 5
O
i nwriyij wcj 4wcj
Y
O
j pwcj
wri5
O
j pwcjyij wri4 wri
Y
O
i nwri
where wrirepresents the ith element of the n vector of row weights wr
and wcjdefines the jth element of the p vector of column weights wc.
Note that within each cycle the row and column weights are renormal-FIG. 5. Schematic representation of the inferred epitopes which are thought
to be involved in the neutralization of primary isolates. The positions of the sensitive specialist isolates (large squares) correspond with those on the spectral map of Fig. 3. The analysis identifies a dimorphic epitope (triangles) which contrasts the cluster of isolates e, g1, and g2 with the cluster o1 to o3. This contrast accounts for the major horizontal factor of the spectral map. A second dimorphic epitope (small squares) opposes isolates a2 and b2. The latter contrast explains the second dominant factor, which is oriented along the vertical axis of the map. A third epitope, belonging to isolate c, defines the third factor, which is oriented perpendicularly to the plane of the diagram. The three factors con-tribute 37, 23, and 14% of the variance of the neutralization spectra, respectively.
on November 9, 2019 by guest
http://jvi.asm.org/
[image:6.612.61.291.66.298.2]ized to unit sums in order to prevent their becoming extremely large or small.
(iii) Step 3.Double centering of the elements of an n3p activity
table Y consists of subtracting at the same time the corresponding row and column means. In the case of bioassay data, this operation can be seen as a correction of the original activities for differences in poten-cies of the products, antibodies, sera, etc., as well as for differences in sensitivities of the tests, receptors, antigens, virus isolates, etc. The data that result after log double centering of Y are called specificities
Z:
zij 5yij 2mri 2mcj1 mg
mri 5
O
j pwcj yij
mcj 5
O
i nwri yij
mg 5
O
i n
O
j pwrj wcj yij
where zijis the general element at row i and column j in the n3p table
of specificities (or log double-centered data) Z, mriis the ith element of
the n vector of row means mr, mcjis the jth element of the p vector of
column means mc, and mg is the global mean over all rows and columns in the table of activities Y.
(iv) Step 4.The heart of the algorithm is the extraction of factors (or principal components) from the table of specificities Z. In its weighted form, this procedure is referred to as generalized singular value ex-traction (generalized SVD): Z 5 UzLzVT, with UTzWRzU 5
VTzWCzV5I
r, where Z is the n3p table of specificities, as defined
above, U is the n3r table of row-singular vectors (row-factor table), V is the p3r table of column-singular vectors (column-factor table), Lis the r3r diagonal matrix of associated singular values, and Iris the
r3r identity matrix of factor space. The number r is the rank of the
table of specificities Z. It defines the number of independent rows and the number of independent columns in Z. It is at most equal to the smallest of the number of rows and the number of columns, minus 1. It is assumed that the singular vectors (factors) in U and V are arranged in decreasing order of their associated singular values inL. Note that the vectors U and V are orthogonal in the matrices defined by WR and
WC. The diagonal weight matrices WR and WC are defined from the
corresponding weight vectors wr and wc as diag (wr) and diag (wc), respectively. In practice, the generalized SVD problem can be reduced to a simple SVD of a transformed Z table: WR1/2zZzWC1/2 5 U9zLzV9T, with U9TzU9 5V9TzV9 5I
r, and by means of a back
transformation of the resulting factor tables U9and V9: U5WR21/ 2zU9, V9 5WC21/2zV9.
(v) Step 5.The last step in the algorithm is the construction of tables which contain the coordinates of the rows and the coordinates of the columns in factor space: S5UzL1/2, L5VzL1/2, where S is the n3 r table of row factor coordinates (scores) and L is the n3p table of
column factor coordinates (loadings). The first two columns of S and
L contain the coordinates of the rows and columns, respectively, in the
plane of the spectral map. The values in the third column are, by convention, graphically encoded in the thickness of the symbols that represent the corresponding rows and columns.
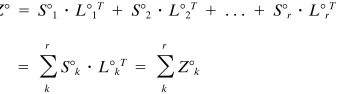
Note that the original table of specificities Z can be reconstructed from the computed row and column factor coordinates, S and L: Z5
SzLT5UzLzVT, according to our previous definition of SVD. Importance of factors.It can be shown that the variance v of the specificities Z is equal to the sum of squared singular values (or eigenvalues) inL2:
O
i nO
j pwriwcjzij25
O
k rlkk2
The contribution ckof a particular factor k to the total variance is then
defined as
lkk2
Y
O
k rlkk2
The contribution of a factor to the total variance is a measure of its importance. Usually, factors are arranged in decreasing order of their contribution to the total variance.
Cross-validation. It is assumed that the most dominant factors (which contribute most of the variances) express the systematic or structural variation in the data and that the higher-order factors (which account for lesser parts of the variances) are due to noise and artifacts in the data. Cluster analysis by the unweighted pair-group mean arith-metic method, for example, is best performed on a reduced table S* or
L*, defined by the r* structural factor (r* ,r) rather than on the
complete original data table Z. A standard method which allows dif-ferentiation between structural and noise factors is called PRESS, which is short for predicted error sum of squares (2). This approach is also referred to as cross-validation and can be defined as follows. In its simplest form the method consists of removing one value, say zij, in
table Z, which we now call Z8, and obtaining a prediction for the removed value from the remaining values in the table. The prediction can be derived by means of generalized partial least squares, which is closely related to the generalized SVD, which has been described above. Partial least squares can be regarded as an extension of SVD for the case of two or more data tables (36). This yields results S8and L8, which are slightly different from S and L: Z8 5S8zL8T, and by the
property of SVD which is called spectral decomposition we also have
Z8 5 S81 zL81T1 S82 zL82T1 . . .1 S8r zL8rT
5
O
k r
S8k zL8kT5
O
k rZ8k
where S8kand L8kare the kth column vectors of S8and L8, respectively.
This decomposition yields the predicted value z8ijas a sum of
contri-butions by the various factors. The quantity zij2 z8ijis called the
prediction error and can thus be split up into r contributions by the r singular vectors:
z8ij 5
O
k rz8ijk
If the operation described thus far is repeated for all elements i and j in table Z, we obtain the predicted error sum of squares (PRESS):
PRESS5
O
i n
O
j p~zij 2z8ij!2
which can also be split up into the various contributions by the r computed factors:
PRESS5
O
i n
O
j pS
zij 2O
k51r*
z8ijk
D
2
The quantity PRESS, when considered as a function of r*, indicates how the prediction error varies with an increasing number of com-puted factors r*. Initially, the graph of PRESS versus r* decreases as systematic or structural information is accounted for by the most dom-inant factors. With larger values of r*, however, an increasing amount of random variation or noise is expressed by the additional factors. While systematic variation is subtracted from PRESS, the random variation adds to it. For some particular value of r*, the systematic variation contributed by a factor will be (about) equal to the random variation. The contribution to PRESS of that factor will be 0. At that point, the graph of PRESS versus r* reaches a minimum. Further addition of factors will produce an increase of the graph of PRESS versus r*. Summarizing, the number of structural factors can be
on November 9, 2019 by guest
http://jvi.asm.org/
[image:7.612.354.523.344.391.2]mined from the minimum of the curve, which represents the prediction error PRESS as a function of the number of factors r* that have been extracted from the data.
Partial least-squares regression.We now briefly explain how pre-dictions are made in a multivariate way. Consider an n3p table X and
an n3q table Y, in which corresponding rows in X and Y refer to the
same objects (products, antibodies, sera, etc.). The problem can be defined as follows. Given X, what are the corresponding predictions for
Y? The solution can be obtained by means of generalized partial least
squares, introduced earlier. The method is called generalization be-cause all sums over rows and columns of X and Y are defined as weighted sums. We must, therefore, define a common n vector of row weights wr, a p vector of column vectors for X called wxr, and a q vector of column vectors for Y called wyr. The result of the analysis is con-ventionally defined in the form X5TzPTand Y'Yˆ5TzQT, with
TTzWRzT5I
r, where T is the n3r matrix of scores, P is the p3r
vector of loadings of X, Q is the q3r vector of loadings of Y, and Iris
the r3r identity matrix. The number r defines the number of factors
that have been extracted from X and Y and is at most equal to the rank of X. The symbol'indicates that the elements in Y are only approx-imately equal to the corresponding estimates in Yˆ. Note that matrix T is orthogonal in the matrix defined by WR, but P and Q are generally nonorthogonal. The analysis also yields a p3q matrix and regression
coefficients which allow calculation of estimates Yˆ from observed X:
Y'Yˆ5XzWXCzB. In terms of regression analysis, we refer to X
and Y as the matrices of independent and dependent variables, respec-tively. Matrix B contains the coefficients of regression Y upon X. We can use this procedure in order to predict a particular column in the original data table from a number of selected columns which serve as key elements. In that case X is formed by the columns in the original data table that have been defined as key variables, and Y is the column in the original data table that must be predicted. The correlation between observed and predicted values can be used as a measure for the quality of the prediction. This operation can be repeated for all columns that were not defined as key elements. The average correla-tion between observed and predicted columns provides an overall measure for the predictive ability of the columns that were chosen as key elements.
Prediction by internal validation.An improved assessment of the predictive ability of an independent matrix X with respect to a depen-dent matrix Y consists of removing one row at a time from table X and predicting the corresponding row in Y. (This can be achieved, for example, by setting the corresponding row weight to 0.) In the case of
n rows, we thus must repeat the prediction by linear regression n times,
one for each row that has been removed. This approach is called internal validation or the “leave-one-out” method. It is related to the method of cross-validation which was discussed above. Usually, the predictions obtained by internal validation correlate less well with the observed data than those derived from linear regression. The former, however, are more robust. Their quality is comparable to that of the predictions that will be made when new data are added to matrix X.
Weighted correlation.In order to be consistent with our generalized analysis, which assigns variable weights to the rows and columns of the data table, our statistics need to be defined accordingly. In particular, we have to replace sums over rows and columns by the corresponding weighted sums. In the case of the Pearson correlation r between two n vectors x and y, the n vector of weight coefficients wr is used in the formula
r 5
O
i nwri~xi 2 x¯!~yi2 y¯!
FO
niwri~xi 2x¯!2
O
i nwri~yi2 y¯!2
G
1/2
with
x¯ 5
O
i n
wri xi
and
y¯ 5
O
i n
wri yi
A similar formula can be defined for the correlation between two p vectors, with the p vector of weight coefficients wc. The concept of weighted correlation is analogous to weighted linear regression.
ACKNOWLEDGMENTS
This study was supported by grants from the Belgian Nationaal Fonds voor Wetenschappelijk Onderzoek and Fonds Geneeskundig Wetenschappelijk Onderzoek. P.N.N. is a recipient of a doctoral train-ing fellowship from Algemeen Bestuur voor Ontwikkeltrain-ingssamenwerktrain-ing. We thank B. Willems, K. Vereecken, and T. Ivens for technical assistance and J. Van Hoof and K. Van Reusel for assistance with computerized calculations.
REFERENCES
1. Abimiku, A. G., T. L. Stern, A. Zwandor, P. D. Markham, C. Calef, S. Kyari,
W. C. Saxinger, R. C. Gallo, M. Robert-Guroff, and M. S. Reitz.1994.
Subgroup G HIV type 1 isolates from Nigeria. AIDS Res. Hum. Retrovi-ruses 10:1581–1583.
2. Allen, D. M. 1974. The relationship between variable selection and data argumentation and a method for prediction. Technometrics 16:125–127. 3. Andries, K., B. Dewindt, J. Snoeks, L. Wouters, H. Moereels, P. J. Lewi, and
P. A. J. Janssen.1990. Two groups of rhinoviruses revealed by a panel of
antiviral compounds present sequence divergence and differential pathoge-nicity. J. Virol. 64:1117–1123.
4. Baskar, P. V., S. C. Ray, R. Rao, T. C. Quinn, J. E. K. Hildreth, and R. C.
Bollinger.1994. Presence in India of HIV type 1 similar to North American
strains. AIDS Res. Hum. Retroviruses 10:1039–1041.
5. Bobkov, A., R. Cheingsong-Popov, M. Garaev, A. Rzhaninova, P. Kallebu, S.
Beddows, M. H. Bachmann, J. I. Mullins, J. Louwagie, W. Janssens, G. van
der Groen, F. McCutchan, and J. Weber.1994. Identification of an env G
subtype and heterogeneity of HIV-1 strains in the Russian Federation and Belarus. AIDS 8:1649–1655.
6. Broliden, P. A., A. Von Gegerfelt, P. Clapham, et al. 1992. Identification of human neutralizing-inducing regions of the human immunodeficiency virus type 1 envelope glycoproteins. Immunology 89:461–465.
7. Bruce, C., C. Clegg, A. Featherstone, J. Smith, B. Biryahawaho, R. Downing,
and J. Oram.1994. Presence of multiple genetic subtypes of human
immu-nodeficiency virus type-1 proviruses in Uganda. AIDS Res. Hum. Retrovi-ruses 10:1543–1550.
8. Dumitrescu, O., M. L. Kalish, S. C. Kliks, C. I. Bandea, and J. A. Levy. 1994. Characterization of human immunodeficiency virus type 1 isolates from children in Romania: identification of a new envelope subtype. J. Infect. Dis.
169:281–288.
9. Earl, P. L., C. C. Broder, D. Long, S. A. Lee, J. Peterson, S. Chakrabarti,
R. W. Doms, and B. Moss.1994. Native oligomeric human immunodeficiency
virus type 1 envelope glycoprotein elicits diverse monoclonal antibody reac-tivities. J. Virol. 68:3015–3026.
10. Gao, F., L. Yue, S. Craig, C. L. Thortnon, D. L. Robertson, F. E. McCutchan,
J. A. Bradac, P. M. Sharp, B. H. Hahn, and the WHO Network for HIV
Isolation and Characterization.1994. Genetic variation of HIV type 1 in
four World Health Organization-sponsored vaccine evaluation sites: gener-ation of functional envelope (glycoprotein 160) clones representative of sequence subtypes A, B, C and E. AIDS Res. Hum. Retroviruses 10:1359– 1368.
11. Goudsmit, J., C. L. Kuiken, and P. L. Nara. 1989. Linear versus confirma-tional variation of V3 neutralization domains of HIV-1 during experimental and natural infection. AIDS 3(Suppl. 3):S119–S123.
12. Ho, D. D., J. A. McKeating, X. L. Li, T. Moudgil, E. S. Daar, N.-C. Sun, and
J. Robinson.1991. Conformational epitope on gp120 important in CD4
binding and human immunodeficiency virus type 1 neutralization identified by a human monoclonal antibody. J. Virol. 65:489–493.
13. Janssens, W., L. Heyndrickx, K. Fransen, J. Motte, M. Peeters, J. N.
Nken-gasong, P. M. Ndumbe, E. Delaporte, J.-L. Perret, C. Atende, P. Piot, and G.
van der Groen.1994. Genetic and phylogenetic analysis of env subtypes G
and H in Central Africa. AIDS Res. Hum. Retroviruses 10:877–879. 14. Janssens, W., L. Heyndrickx, Y. Van de Peer, A. Bouckaert, K. Fransen, J.
Motte, G.-M. Gershy-Damet, M. Peeters, P. Piot, and G. van der Groen.
1994. Molecular phylogeny of part of the env gene of HIV-1 strains isolated in Coˆte d’Ivoire. AIDS 8:21–26.
15. Kostrikis, L. G., E. Bagdades, Y. Cao, L. Zhang, D. Dimitriou, and D. D. Ho. 1995. Genetic analysis of human immunodeficiency virus type 1 strains from patients in Cyprus: identification of a new subtype designated subtype I. J. Virol. 69:6122–6130.
on November 9, 2019 by guest
http://jvi.asm.org/
16. Kostrikis, L. G., Y. Cao, H. Ngai, J. P. Moore, and D. D. Ho. 1996. Quan-titative analysis of serum neutralization of human immunodeficiency virus type 1 from subtypes A, B, C, D, E, F and I: lack of direct correlation between neutralization serotypes and genetic subtypes and evidence for prevalent serum-dependent infectivity enhancement. J. Virol. 70:445–458. 17. Lewi, P. J. 1976. Spectral mapping, a technique for classifying biological
activity profiles of chemical compounds. Drug Res. 26:1295.
18. Lewi, P. J. 1982. Multivariate data analysis in industrial practice. Research Studies Press, Wiley, Chichester, England.
19. Lewi, P. J. 1989. Spectral map analysis. Analysis of contrasts especially from log ratios. Chemometrics Intelligent Lab. Syst. 5:105–116.
20. Lewi, P. J. 1995. Spectral mapping of drug-test specificities, p. 219–253. In H. van de Waterbeemd (ed.), Chemometrics in molecular design. VCH, Wein-heim, Germany.
21. Louwagie, J., W. Janssens, J. Mascola, L. Heyndrickx, P. Hegerich, G. van
der Groen, F. E. McCutchan, and D. S. Burke.1995. Genetic diversity of the
envelope glycoprotein from human immunodeficiency virus type 1 isolates of African origin. J. Virol. 69:263–271.
22. Louwagie, J., F. McCutchan, J. Mascola, G. Eddy, K. Fransen, M. Peeters,
G. van der Groen, and D. Burke.1994. Session II. Technical challenges and
scientific issues: genetic subtypes of HIV-1. AIDS Res. Hum. Retroviruses
9(Suppl.):S147–S150.
23. Louwagie, J., F. E. McCutchan, M. Peeters, T. P. Brennan, E. Sanders-Buell,
G. A. Eddy, G. van der Groen, K. Fransen, G.-M. Gershy-Damet, R. Deleys,
and D. S. Burke.1993. Phylogenetic analysis of gag genes from 70
interna-tional HIV-1 isolates provides evidence for multiple genotypes. AIDS 7:769– 780.
24. Moore, J. P., Y. Cao, J. Leu, L. Qin, B. Korber, and D. D. Ho. 1996. Inter-and intraclade neutralization of human immunodeficiency virus type 1: ge-netic clades do not correspond to neutralization serotypes but partially correspond to gp120 antigenic serotypes. J. Virol. 70:427–444.
25. Moore, J. P., and D. D. Ho. 1992. Conformationally sensitive epitopes on the gp120 glycoprotein of human immunodeficiency virus type 1 are highly prevalent in sera of infected humans. J. Virol. 67:863–875.
26. Moore, J. P., M. Thali, B. A. Jameson, et al. 1993. Immunochemical analysis of the gp120 surface glycoprotein of human immunodeficiency virus type 1: probing the structure of the C4 and V4 domains and the interaction of the C4 domain with the V3 loop. J. Virol. 67:4785–4796.
27. Morgado, M. G., E. C. Sabino, E. G. Shpaer, V. Bongertz, L. Brigido,
M. D. C. Guimaraes, E. A. Castilho, B. Galva˜o-Castro, J. I. Mullins, R. M.
Hendry, and A. Mayer.1994. V3 region polymorphisms in HIV-1 from
Brazil: prevalence of subtype B strains divergent from North American/ European prototype and detection of subtype F. AIDS Res. Hum. Retrovi-ruses 10:569–576.
28. Nkengasong, J. N., W. Janssens, L. Heyndrickx, K. Fransen, P. M. Ndumbe,
J. Motte, A. Leonaers, M. Ngolle, J. Ayuk, P. Piot, and G. van der Groen.
1994. Genotypic subtypes of HIV-1 in Cameroon. AIDS 8:1405–1412. 29. Nkengasong, J., M. Peeters, B. Willems, M. Ngolle, P. Ndumbe, P. Piot, and
G. van der Groen.1994. Cross-neutralizing antibodies to HIV-1ANT-70and
HIV-1IIIBin sera of African and Belgian HIV-1 infected individuals. AIDS
8:1089–1096.
30. Nyambi, P. N., J. Nkengasong, M. Peeters, F. Simon, J. Eberle, W. Janssens,
K. Fransen, B. Willems, K. Vereecken, L. Heyndrickx, P. Piot, and G. van
der Groen.1995. Reduced capacity of antibodies from patients infected with
human immunodeficiency virus type 1 (HIV-1) group O to neutralize pri-mary isolates of HIV-1 group M viruses. J. Infect. Dis. 172:1228–1237. 31. Profy, A. T., P. A. Salina, L. I. Eckler, N. M. Dunlop, P. L. Nara, and S. D.
Putney.1990. Epitopes recognized by the neutralizing antibodies of an
HIV-1-infected individual. J. Immunol. 144:4641–4647.
32. Sneath, P. H., and R. R. Sokal. 1973. Numerical taxonomy. Freeman, San Francisco.
33. Stamatatos, L., and C. Cheng-Meyer. 1995. Structural modulations of the envelope gp120 glycoprotein of human immunodeficiency virus type 1 upon oligomerization and differential V3 loop epitope exposure of isolates dis-playing distinct tropism upon virion-soluble receptor binding. J. Virol. 69: 6191–6198.
34. Vanden Haesevelde, M., J.-L. Decourt, R. J. De Leys, B. Vanderborght, G.
van der Groen, H. van Heuverswijn, and E. Saman.1994. Genomic cloning
and complete sequence analysis of a highly divergent African human immu-nodeficiency virus isolate. J. Virol. 68:1586–1596.
35. Weiss, R. A., P. R. Clapham, J. N. Weber, A. G. Dalgleish, L. A. Lasky, and
P. W. Berman.1986. Variable and conserved neutralisation antigens of HIV.
Nature (London) 324:572–575.
36. Wold, S., C. Albano, W. J. Dunn III, K. Esbensen, S. Hellberg, E. Johansson,
and M. Sjostrom.1983. Pattern recognition: finding and using patterns in
multivariate data, p. 147. In H. Martens and H. Russwurm, Jr. (ed.), Food research and data analysis. Applied Science, London.
37. World Health Organization. WHO case definitions for AIDS surveillance in adults and adolescents. 1994. Wkly. Epidemiol. Rec. 69:273–275.