METHOD DEVELOPMENT AND VALIDATION OF SIMULTANEOUS ESTIMATION OF TELMISARTAN AND HYDROCHLOROTHIAZIDE IN
PHARMACEUTICAL DOSAGE FORMS BY RP-HPLC
Dissertation work submitted to
The Tamilnadu Dr. M. G. R. Medical University, Chennai In partial Fulfillment for the award of degree of
MASTER OF PHARMACY IN
PHARMACEUTICAL ANALYSIS
Submitted by
KOUMUDI ANNAMANENI Reg. No: 26106436
Under the guidance of
Institutional Guide Industrial Guide Mr. P. Kumar Nallasivan , M.pharm(Ph.D), Ms.P.Usha Rani, Asst. Professor , Sr. Research Analyst,
Department of Pharmaceutical Analysis, Aurobindo pharma Pvt Limited, R V S College of Pharmaceutical Sciences , Hyderabad.
Sulur, Coimbatore.
NOV 2012
DEPARTMENT OF PHARMACEUTICAL ANALYSIS R.V.S. COLLEGE OF PHARMACEUTICAL SCIENCES
CERTIFICATE
This is to certify that the dissertation work entitled “METHOD DEVELOPMENT AND VALIDATION OF SIMULTANEOUS ESTIMATION OF TELMISARTAN AND HYDROCHLOROTHIAZIDE IN PHARMACEUTICAL DOSAGE FORMS BY RP-HPLC” is a bonafide work of Ms. KOUMUDI ANNAMANENI carried out in AUROBINDO PHARMA LABORATORIES, HYDERABAD under my guidance and under the supervision of Ms. P.USHA RANI Senior research Analyst and has completed to my fullest satisfaction for partial fulfillment of the award of degree of Master of Pharmacy in Pharmaceutical Analysis, RVS college of Pharmaceutical Sciences, Sulur, Coimbatore, which is affiliated to The Tamilnadu Dr. M.G.R Medical University, Chennai. It is to certify that the part or whole of the work has not been submitted either to this university or any other university. This work is original and confidential.
INSTITUTIONAL GUIDE
Mr.P.KUMARNALLASIVAN, M.Pharm,(PhD) Assistant Professor,
Department of Pharmaceutical Analysis, R.V.S College of Pharmaceutical Sciences, Sulur, Coimbatore-641402.
CERTIFICATE
This is to certify that the dissertation work entitled “METHOD DEVELOPMENT AND VALIDATION OF SIMULTANEOUS ESTIMATION OF TELMISARTAN AND HYDROCHLOROTHIAZIDE IN PHARMACEUTICAL DOSAGE FORMS BY RP-HPLC” is a bonafide research work done by Ms.KOUMUDI ANNAMANENI carried out in , AUROBINDO PHARMA LABORATORIES, HYDERABAD under the guidance of Mr.P.KUMAR NALLASIVAN,M.Pharm.,(Ph.D.),Assistant Professor, RVS College of pharmaceutical science, Sulur and Ms. P.USHA RANI Senior research Analyst , for partial fulfillment of the requirement for the award of Master of Pharmacy in Pharmaceutical Analysis, RVS college of Pharmaceutical Sciences, Sulur, Coimbatore, which is affiliated to The Tamilnadu Dr.M.G.R Medical University, Chennai.
Dr.R.VENKATANARAYANAN, M.Pharm. Ph.D PRINCIPAL,
R.V.S College of Pharmaceutical Sciences, Sulur, Coimbatore-641402.
CERTIFICATE
This is to certify that the dissertation work entitled “METHOD DEVELOPMENT AND VALIDATION OF SIMULTANEOUS ESTIMATION OF TELMISARTAN AND HYDROCHLOROTHIAZIDE IN PHARMACEUTICAL DOSAGE FORMS BY RP-HPLC” is a bonafide research work done by Ms. KOUMUDI ANNAMANENI carried out in AUROBINDO PHARMA LABORATORIES ,HYDERABAD under the guidance Of Mr.P. KUMAR NALLASIVAN M.Pharm.,(Ph.D.),Assistant Professor, RVS College of pharmaceutical sciences, Sulur and Ms. P.USHA RANI Senior research Analyst for partial fulfillment of the requirement for the award of Master of Pharmacyin Pharmaceutical Analysis, RVS college of Pharmaceutical Sciences, Sulur, Coimbatore, which is affiliated to The Tamilnadu Dr.M.G.R Medical University, Chennai.
Dr. W.D. SAMSOLOMON, M.Pharm., Ph.D Professor and Head,
Department of Pharmaceutical Analysis, R.V.S College of Pharmaceutical Sciences, Sulur, Coimbatore-641402.
CERTIFICATE
This is to certify that the dissertation work entitled “METHOD DEVELOPMENT AND VALIDATION OF SIMULTANEOUS ESTIMATION OF TELMISARTAN AND HYDROCHLOROTHIAZIDE IN PHARMACEUTICAL DOSAGE FORMS BY RP-HPLC” is a bonafide research work done in AUROBINDO PHARMA LABORATORIES , HYDERABAD by Ms. KOUMUDI ANNAMANENI in partial fulfillment of the requirement for the award of Master of Pharmacy in Pharmaceutical Analysis, R V S college of Pharmaceutical Sciences, Sulur, Coimbatore,. under the supervision and guidance of Mr.P.KUMAR NALLASIVAN. M.Pharm, (Ph.D.), Assistant Professor, Department of Pharmaceutical Analysis, RVS College of pharmaceutical science, Sulur and Ms. P.USHA RANI Senior research Analyst.
INTERNAL EXAMINER EXTERNAL EXAMINER
Place: Place: Date: Date:
ACKNOWLEDGEMENT
Firstly, I would like to express my whole hearted gratitude to ‘The Almighty’, without whose blessings, this endeavor would not have been completed.
It gives me immense pleasure to convey my deep sense of gratitude and heartfelt thanks to my guide Mr. P.KUMAR NALLASIVAN, Assistant Professor, Department of Pharmaceutical Analysis, RVS college of Pharmaceutical Sciences, Sulur, Coimbatore for his help, suggestions, guidance, and the confidence that he has shown in me throughout the course of my work.
My profound gratitude to Ms. P.USHA RANI Senior Research Analyst, who owed best on me to bring about successful completion of the project.
I sincerely thank Dr. R. VENKATANARAYANAN, Professor and Principal, RVS college of Pharmaceutical Sciences, Sulur, Coimbatore, for his inspirations and for being a great facilitator.
It gives me immense pleasure to convey my deep sense of gratitude and heartfelt thanks to Dr.W.D. SAM SOLOMON, Professor and HOD, Department of Pharmaceutical Analysis, RVS College of Pharmaceutical Sciences, Sulur, Coimbatore
I express my sincere gratitude to my teachers, Mr. SIVA KUMAR , Mr.VIJAYANAND for their meticulous guidance and encouragement provided to me for the completion of my dissertation work.
Above all, I am very grateful to my family, for providing me moral support, encouragement and blessings.
My special thanks to Pravallika, Jyosthna, Pulla Reddy, Manju, Nikhila ,Divya, Deepti, Asha, Anusha , Kalyani, Kavitha, Markandeya, Ashok, Baiju, Gajanan and fellow trainees for their support, encouragement and help with abilities in completing my project work.
However, it would not have been possible without the kind support and help of many individuals. As a final word, I would like to extend my sincere thanks to each and every individual who have been a source of support and helped me to complete my dissertation work successfully.
KOUMUDI ANNAMANENI Reg.No: 26106436
ABBREVIATIONS
ACN : Acetonitrile
g : gram
HPLC : High performance liquid chromatography pH : Hydrogen ion concentration
ICH : International conference on harmonization
mg : Milligram
ml : Milliliter
µg : Microgram
µg/ml : Microgram per milliliter µg : Microgram
nm : Nanometer
PA : Purity Angle
PDA : Photo diode array
TH : Purity threshold
RSD : Relative standard deviation
k : Retention time
SD : Standard deviation
UV : Ultra violet
S.NO
TITLE
PAGE NO
1 INTRODUCTION 1-30
2 LITERATURE REVIEW & DRUG PROFILE 31-41
3 AIM & PLAN OF WORK 42-43
4 EXPERIMENTAL PART 44-94
5 RESULTS & DISCUSSION 95-100
6 CONCLUSION 101
RVS College of Pharmaceutical Sciences, Coimbatore Page 1 1. INTRODUCTION
1.1 CHROMATOGRAPHY1:
Chromatography is a valuable technique for the separation, purification, and
identification of the constituents in a mixture. This technique was originally confined to
the seperation of coloured substances such as plant pigments and dyestuffs. But the
technique is now well applied to colourless substances also.
The chromatographic technique was first invented by M.TSWETT in 1906. The
term chromatography (greek :- khromatos – colour and graphos – written) and its
principles were first discovered by Michel Tswett .
On the general progress of science, chromatography may be regarded as an
analytical technique employed for the purification and separation of organic and
inorganic substances. It is also found useful for the fractionation of complex mixture,
separation of closely related compound such as isomers and in the isolation of unstable
substances.
Principles of chromatographic separation2:
• Adsorption chromatography: A solid stationary phase and a liquid or gaseous
mobile phase.
• Partition chromatography: A liquid stationary phase and a liquid or gaseous
mobile phase.
• Ion exchange chromatography: A solid polymeric stationary phase containing
replaceable ions.
• Size exclusion chromatography: An inert gel which acts as a molecular sieve, and
liquid mobile phase.
Adsorption chromatography:
In adsorption chromatography, the mobile phase containing the dissolved solutes
which are passed over the surface of stationary phase, due to the affinity of the solute
RVS College of Pharmaceutical Sciences, Coimbatore Page 2 phase is non polar and the stationary phase is polar where in reverse phase the mobile
phase is polar and the stationary phase is non polar.
Partition chromatography:
In partition chromatography the principle of separation is readily understood by
considering the partitioning behaviour of substance between two immiscible liquids. Few
substances, when shaken with two immiscible liquids, partition take place completely in
to one or other liquid. Instead, most distribute them selves between the liquids such that
the partition coefficient (the ratio of concentrations of the substance in each phase) is a
constant value independent of the total amount, provided neither phase is saturated with
the substance.
Mode of chromatographic operations3:
There are three modes of chromatographic operation they are as follows:
• Elution techniques
- Isocratic method
- Gradient method
• Frontal techniques
• Displacement techniques
Types of chromatography techniques:
• Planar chromatography
• Column chromatography
TYPES OF LIQUID CHROMATOGRAPHY4
• Liquid – Solid chromatography
• Liquid – liquid chromatography
RVS College of Pharmaceutical Sciences, Coimbatore Page 3 These three types are the basic types of chromatography and these are modified to
different types of chromatography. They are as follows:
• Normal phase chromatography
• Reverse phase chromatography
• High performance liquid chromatography
• Ion exchange chromatography
• Size exclusion liquid chromatography
• Super critical fluid chromatography
• Chiral chromatography
• Affinity chromatography
1.2. HIGH PERFORMANCE LIQUID CHROMATOGRAPHY5:
The modern form of column chromatography has been called high performance, high pressure, and high-resolution and high-speed liquid chromatography.
High-Performance Liquid Chromatography (HPLC) is a special branch of column
chromatography in which the mobile phase is forced through the column at high speed.
As a result the analysis time is reduced by 1-2 orders of magnitude relative to classical
column chromatography and the use of much smaller particles of the adsorbent or support
becomes possible increasing the column efficiency substantially.
HPLC has the following important features.
• High resolution power
• Speedy separation
• Continuous monitoring of the column effluents
• Accurate quantitative measurement
• Repetitive and reproducible analysis, using the same columns
RVS College of Pharmaceutical Sciences, Coimbatore Page 4 Normal Phase Chromatography
In normal phase chromatography, the stationary phase is a polar adsorbent and the mobile
phase is generally a mixture of non-aqueous solvents.
The silica structure is saturated with silanol groups at the end. These OH groups are
statistically disturbed over the whole of the surface. The silanol groups represent the
active sites (very polar) in the stationary phase. This forms a weak type of bond with any
molecule in the vicinity when any of the following interactions are present.
♦ Dipole-induced dipole
♦ Dipole-dipole
♦ Hydrogen bonding
♦ π-Complex bonding
These situations arise when the molecule has one or several atoms with lone pair
electron or a double bond. The absorption strengths and hence k’ values (elution series)
increase in the following order. Saturated hydrocarbon < olefins < aromatics < organic
halogen compounds < sulphides < ethers< esters < aldehydes and ketones < amines <
sulphones < amides < carboxylic acids. The strength of interactions depends not only on
the functional groups in the sample molecule but also on steric factors. If a molecule has
several functional groups, then the most polar one determines the reaction properties.
Chemically modified silica, such as the aminopropyl, cyanopropyl and diol phases
is useful alternatives to silica gel as stationary phase in normal phase chromatography.
The aminopropyl and cyanopropyl phases provide opportunities for specific
interactions between the analyte and the stationary phases and thus offer additional
options for the optimizations of separations. Other advantages of bonded phases lie in
their increased homogeneity of the phase surface.
Resolution with water in weak mobile phase may be most conveniently achieved
by drying the solvents and then adding a constant concentration of water or some very
polar modifier such as acetic acid or trietylamine (TEA) to the mobile phase. The
addition of such polar modifiers serves to deactivate the more polar shape as well as the
RVS College of Pharmaceutical Sciences, Coimbatore Page 5 Reversed Phase Chromatography
In 1960’s chromatographers started modifying the polar nature of silanol group by
chemically reacting silica with organic silanes. The objective was to make less polar or
non polar so that polar solvents can be used to separate water-soluble polar compounds.
Since the ionic nature of the chemically modified silica is now reversed i.e. it is non-polar
or the nature of the phase is reversed. The chromatographic separation carried out with
such silica is referred to as reversed- phase chromatography.
A large number of chemically bonded stationary phases based on silica are
available commercially. Table 1 lists some of the functional groups bonded in chemically
modified silica. Silica based stationary phases are still most popular in reversed phase
chromatography however other absorbents based on polymer (styrene-divinyl benzene
copolymer) are slowly gaining ground.
Simple compounds are better retained by the reversed phase surface, the less water-
soluble (i.e. the more non-polar) they are. The retention decreases in the following order:
aliphatics > induced dipoles (i.e.,CCl4) > permanent dipoles (e.g.CHCl3) > weak lewis
bases (ethers, aldehydes, ketones) > strong lewis bases (amines) > weak lewis acids
(alcohols, phenols) > strong lewis acids (carboxylic acids). Also the retention increases as
the number of carbon atoms increases.
As a general rule the retention increases with increasing contact area between
sample molecule and stationary phase i.e., with increasing number of water molecules,
which are released during the adsorption of a compound. Branched chain compounds are
eluted more rapidly than their corresponding normal isomers.
In reversed phase systems the strong attractive forces between water molecules
arising from the 3-dimentional inter molecular hydrogen bonded network, from a
structure of water that must be distorted or disrupted when a solute is dissolved. Only
higher polar or ionic solutes can interact with the water structure. Non- polar solutes are
squeezed out of the mobile phase and are relatively insoluble in it but with the
hydrocarbon moieties of the stationary phase.
Chemically bonded octadecyl silane (ODS) an alkaline with 18 carbon atoms it is
RVS College of Pharmaceutical Sciences, Coimbatore Page 6 pharmaceutical compounds are polar and water soluble, the majority of HPLC methods
used for quality assurance, decomposition studies, quantitative analysis of both bulk
drugs and their formulations use ODS HPLC columns. The solvent strength in reversed
phase chromatography is reversed from that of adsorption chromatography (silica gel) as
stated earlier. Water interacts strongly with silanol groups, so that adsorption of sample
molecules become highly restricted and they are rapidly eluted as a result. Exactly
opposite applies in reversed phase system; water cannot wet the non-polar (hydrophobic)
alkyl groups such as C18 of ODS phase and therefore does not interact with the bonded
moiety. Hence water is the weakest solvent of all and gives slowest elution rate. The
elution time (retention time) in reversed phase chromatography increases with increasing
amount of water in the mobile phase.
The essential equipment consists of an eluent, reservoir, a high-pressure pump,
and an injector for introducing the sample, a column containing the stationary phase, a
detector and recorder. The development of highly efficient micro particulate bonded
phases has increased the versatility of the technique and has greatly improved the
analysis of multicomponent mixtures.
The systems used are often described as belonging to one of four mechanistic
types, adsorption, partition, ion exchange and size-exclusion. Adsorption chromatography
arises from interaction between solutes on the surface of the solid stationary phase.
Partition chromatography involves a liquid stationary phase, which is immiscible with the
eluent and coated on an inert support. Adsorption and partition systems can be normal
phase (stationary phase more polar than eluent) or reversed phase (stationary phase less
polar than eluent). Ion-exchange chromatography involves a solid stationary phase with
anionic or cationic groups on the surface to which solute molecules of opposite charge
are attracted. Size-exclusion chromatography involves a solid stationary phase with
controlled pore size. Solutes are separated according to their molecular size, the large
molecules enable to enter the pores eluting first.
RVS College of Pharmaceutical Sciences, Coimbatore Page 7 Fig.No.1. Schematic diagram of the HPLC system
Instrumentation6,7 Solvent delivery system
The mobile phase is pumped under pressure from one or several reservoirs and
flows through the column at a constant rate. With micro particulate packing, there is a
high-pressure drop across a chromatography column. Eluting power of the mobile phase
is determined by its overall polarity, the polarity of the stationary phase and the nature of
the sample components. For normal phase separations eluting power increases with
increasing polarity of the solvent but for reversed phase separations, eluting power
decreases with increasing solvent polarity. Optimum separating conditions can be
achieved by making use of mixture of two solvents. Some other properties of the
solvents, which need to be considered for a successful separation, are boiling point,
viscosity, detector compatibility, flammability and toxicity.
The most important component of HPLC in solvent delivery system is the pump,
because its performance directly effects the retention time, reproducibility and detector
sensitivity. Among the several solvent delivery systems (direct gas pressure, pneumatic
intensifier, reciprocating etc.) reciprocating pump with twin or triple pistons is widely
RVS College of Pharmaceutical Sciences, Coimbatore Page 8 Solvent degassing system
The constituents of the mobile phase should be degassed and filtered before use.
Several methods are employed to remove the dissolved gases in the mobile phase. They
include heating and stirring, vacuum degassing with an aspirator, filtration through 0.45µ
filter, vacuum degassing with an air-soluble membrane, helium purging ultra sonication
or purging or combination of these methods. HPLC systems are also provided an online
degassing system, which continuously removes the dissolved gases from the mobile
phase.
Gradient elution devices
HPLC columns may be run isocratically, i.e., with constant eluent or they may be
run in the gradient elution mode in which the mobile phase composition varies during
run. Gradient elution is a means of over coming the problem of dealing with a complex
mixture of solutes.
Sample introduction systems
Two means for analyte introduction on the column are injection in to a flowing
stream and a stop flow injection. These techniques can be used with a syringe or an
injection valve. Automatic injector is a microprocessor-controlled version of the manual
universal injector. Usually, up to 100 samples can be loaded in to the auto injector tray.
The system parameters such as flow rates, gradient, run time, volume to be injected, etc.
are chosen, stored in memory and sequentially executed on consecutive injections.
Liquid chromatographic detectors8,9
The function of the detector in HPLC is to monitor the mobile phase as it emerges
from the column. Generally, there are two types of HPLC detectors, bulk property
RVS College of Pharmaceutical Sciences, Coimbatore Page 9 Bulk property detectors
These detectors are based on differential measurement of a property, which is
common to both the sample and the mobile phase. Examples of such detectors are
refractive index, conductivity and dielectric constant detectors.
Solute property detectors
Solute property detectors respond to a physical property of the solute, which is not
exhibited by the pure mobile phase. These detectors measure a property, which is specific
to the sample, either with or without the removal of the mobile phase prior to the
detection. Solute property detectors which do not require the removal of the mobile phase
before detection include spectrophotometric (UV or UV-Vic) detector, fluorescence
detectors, polarographic, electro-chemical and radio activity detectors, whilst the moving
wire flame ionization detector and electron capture detector both require removal of the
mobile phase before detection.
UV-Vis and fluorescent detectors are suitable for gradient elution, because
many solvents used in HPLC do not absorb to any significant extent.
Column and Column-packing materials10
The heart of the system is the column. In order to achieve high efficiency of
separation, the column material (micro-particles, 5-10 µm size) packed in such a way that
highest numbers of theoretical plates are possible.
Silica (SiO2,H2O) is the most widely used substance for the manufacture of
packing materials. It consists of a network of siloxane linkages (Si-O-Si) in a rigid three
dimensional structure containing inter connecting pores. Thus a wide range of
commercial products is available with surface areas ranging from 100 to 800 m2/g. and
particle sizes from 3 to 50 µm.
The silanol groups on the surface of silica give it a polar character, which is
exploited in adsorption chromatography using non-polar organic eluents. Silica can be
drastically altered by reaction with organo chloro silanes or organo alkoxy silanes giving
RVS College of Pharmaceutical Sciences, Coimbatore Page 10
produces a non-polar surface suitable for reversed phase chromatography
where mixtures of water and organic solvents are used as eluents. The most popular
material is octadecyl-silica (ODS-Silica), which contains C18 chains, but materials with
C2, C6, C8 and C22 chains are also available. During manufacture, such materials may be
reacted with a small mono functional silane (e.g. trimethyl chloro silane) to reduce
further the number of silanol groups remaining on the surface (end-capping). There is a
vast range of materials which have intermediate surface polarities arising from the
bonding to silica of other organic compounds which contain groups such as phenyl, nitro,
amino and hydroxyl. Strong ion exchangers are also available in which sulphonic acid
groups or quaternary ammonium groups are bonded to silica. The useful pH range for
columns is 2 to 8, since siloxane linkages are cleaved below pH-2 while at pH values
above eight silica may dissolve.
In HPLC, generally two types of columns are used, normal phase columns
and reversed phase columns. Using normal phase chromatography, particularly of
non-polar and moderately non-polar drugs can make excellent separation. It was originally
believed that separation of compounds in mixture takes place slowly by differential
adsorption on a stationary silica phase. However, it now seems that partition plays an
important role, with the compounds interacting with the polar silanol groups on the silica
or with bound water molecules.
While normal phase seems the passage of a relatively non-polar mobile
phase over a polar stationary phase, reversed phase chromatography is carried out using a
polar mobile phase such as methanol, Acetonitrile, water, buffers etc., over a non-polar
stationary phase. Ranges of stationary phases (C18, C8, -NH2, -CN, -phenyl etc.) are
available and very selective separations can be achieved. The pH of the mobile phase can
be adjusted to suppress the ionization of the drug and thereby increase the retention on
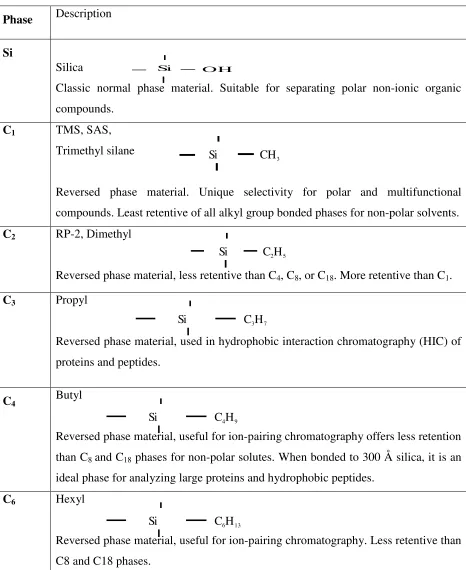
RVS College of Pharmaceutical Sciences, Coimbatore Page 11 Table 1.Bonded Phases for HPLC and their Abbreviations
Phase Description
Si
Silica
Classic normal phase material. Suitable for separating polar non-ionic organic
compounds.
C1 TMS, SAS,
Trimethyl silane
Reversed phase material. Unique selectivity for polar and multifunctional
compounds. Least retentive of all alkyl group bonded phases for non-polar solvents.
C2 RP-2, Dimethyl
Reversed phase material, less retentive than C4, C8, or C18. More retentive than C1.
C3 Propyl
Reversed phase material, used in hydrophobic interaction chromatography (HIC) of
proteins and peptides.
C4 Butyl
Reversed phase material, useful for ion-pairing chromatography offers less retention
than C8 and C18 phases for non-polar solutes. When bonded to 300 Å silica, it is an
ideal phase for analyzing large proteins and hydrophobic peptides.
C6 Hexyl
Reversed phase material, useful for ion-pairing chromatography. Less retentive than
C8 and C18 phases.
Si OH
Si CH3
C2H5 Si
Si C3H7
Si C4H9
RVS College of Pharmaceutical Sciences, Coimbatore Page 12
C8 MOS, RP-8, LC8, Octyl
Reversed phase material, similar selectivity to C18 but less retentive. Wide
applicability (e.g. pharmaceuticals, nucleosides, steroids). When bonded to300 Å
silica, it is an ideal phase for peptides, peptide mapping and small hydrophilic
proteins.
C18 ODS, RP-18, LC18, Octadecyl
Classic reversed phase material is most retentive for non-polar solutes and is
excellent for ion-pairing chromatography. It is having wide applicability for the
assay of nucleosides, nucleotides, steroids, pharmaceuticals, vitamins, fatty acids
and environmental compounds when bonded to 300 Å silica, this phase is perfect
for separating small hydrophilic peptides.
Derivatization
In HPLC derivatization is used to enhance the sensitivity and selectivity of
detection when available detectors are not satisfactory for the underivatized compounds.
Both ultra violet absorbing and fluorescence derivatives have been widely used. Ultra
violet derivatization reagents include N-succinimidyl p-nitro phenyl acetate, phenyl
hydrazine and 3, 5-dinitro benzyl chlorides, while fluorescent derivatives can be formed
with reagents such as dansyl chloride, 4-bromo methyl-7-methoxy-coumarin and
fluorescamine. Derivative formation can be carried out before the sample is injected on to
the column or by online chemical reactions between the column out let and the detector.
Gradient elution
Gradient elution or solvent programming is the change of solvent
composition during a separation in which the solvent strength increases from the
beginning to the end of the separation. It is well suited to the analysis of samples of
unknown complexity since good resolution is automatically provided for a wide range of
Si C8H17
RVS College of Pharmaceutical Sciences, Coimbatore Page 13 sample polarities. There are two types of gradient systems: Low-pressure gradient
mixtures and high- pressure gradient mixtures. In the former the solvents are mixed at
atmosphere pressure and then pumped to the column, where as in the later, solvents are
pumped in to a mixing chamber at high pressure before going in to the column.
1.3. METHOD DEVELOPMENT AND OPTIMIZATION11
During the optimization stage, the initial sets of conditions that have evolved from
the first stages of development are improved or maximized in terms of resolution and
peak shape, plate counts asymmetry, capacity, elution time, detection limits, limit of
Quantitation, and overall ability to quantify the specific analyte of interest.
Optimization of a method can follow either of two general approaches:
1. Manual
2. Computer driven
The manual approach involves varying one experimental variable at a time, while
holding all others constant, and recording changes in response .The variables might
include flow rates, mobile or stationary phase composition, temperature, detection
wavelength, and pH this univariate approach to system optimization is slow, time
consuming and potentially expensive. However, it may provide a much better
understanding of the principles and theory involved and of interactions of the variables.
In the second approach, computer driven automated methods development,
efficiency is optimized while experimental input is minimized. Computer driven
automated approaches can be applied to many applications .In addition, they are capable
of significantly reducing the time, energy and cost of virtually all-instrumental methods
development.
The various parameter s that include to be optimized during method development 12
1. Mode of separation
2. Selection of stationary phase
3. Selection of mobile phase
RVS College of Pharmaceutical Sciences, Coimbatore Page 14 1.3.1 Selection of mode of separation
In reverse phase mode, the mobile phase is comparatively more polar than the
stationary phase. For the separation of polar or moderately polar compounds, the most
preferred mode is reverse phase. The nature of the analyte is the primary factor in the
selection of the mode of separation. A second factor is the nature of the matrix.
1.3.2. Selection of stationary phase / column
Selection of the column is the first and the most important step in method
development the appropriate choice of separation column includes three different
approaches
1. Selection of separation system
2. The particle size and the nature of the column packing
3. The physical parameters of the column i.e. the length and the diameter
Some of the important parameters considered while selecting chromatographic columns
are
♦ Length and diameter of the column.
♦ Packing material.
♦ Shape of the particles.
♦ Size of the particles.
♦ % of Carbon loading
♦ Pore volume.
♦ Surface area.
♦ End capping.
The column is selected depending on the nature of the solute and the information
about the analyte. Reversed phase mode of chromatography facilitates a wide range of
columns like dimethyl silane (C2), butylsilane (C4), octylsilane (C8), octadecylsilane
(C18), base deactivated silane (C18) BDS phenyl, cyanopropyl (CN), nitro, amino etc. C18
was chosen for this study since it is most retentive one. The sample manipulation
RVS College of Pharmaceutical Sciences, Coimbatore Page 15 Generally longer columns provide better separation due to higher theoretical
plate numbers. As the particle size decreases the surface area available for coating
increases. Columns with 5-µm particle size give the best compromise of efficiency,
reproducibility and reliability. In this case, the column selected had a particle size of 5
µm and a internal diameter of 4.6 mm
Peak shape is equally important in method development. Columns that
provide symmetrical peaks are always preferred while peaks with poor asymmetry can
result in,
♦ In accurate plate number and resolution measurement
♦ Imprecise quantitation
♦ Degraded and undetected minor bands in the peak tail
♦ Poor retention reproducibility
A useful and practical measurement of peak shape is peak asymmetry factor and peak
tailing factor. Peak asymmetry is measured at 10% of full peak height and peak tailing
factor at 5%. Reproducibility of retention times and capacity factor is important for
developing a rugged and repeatable method.
A column which gives separation of all the impurities and degradants from
each other and from Analyte peak and which is rugged for variation in mobile phase shall
be selected.
1.3.3. Selection of mobile phase
The primary objective in selection and optimization of mobile phase is to achieve
optimum separation of all the individual impurities and degradants from each other and
from analyte peak
In liquid chromatography, the solute retention is governed by the solute
distribution factor, which reflects the different interactions of the solute – stationary
phase, solute – mobile phase and the mobile phase – stationary phase .For a given
RVS College of Pharmaceutical Sciences, Coimbatore Page 16 phase, the nature and the composition of which has to be judiciously selected in order to
get appropriate and required solute retention. The mobile has to be adapted in terms of
elution strength (solute retention) and solvent selectivity (solute separation) Solvent
polarity is the key word in chromatographic separations since a polar mobile phase will
give rise to low solute retention in normal phase and high solute retention in reverse
phase LC. The selectivity will be particularly altered if the buffer pH is close to the pKa
of the analytes; the solvent strength is a measure of its ability to pull analyte from the
column. It is generally controlled by the concentration of the solvent with the highest
strength.
The following are the parameters, which shall be taken into consideration while
selecting and optimizing the mobile phase.
♦ Buffer
♦ pH of the buffer
♦ Mobile phase composition.
1.3.3.1. Buffer, if any and its length.
Buffer and its strength play an important role in deciding the peak symmetries and
separations. Some of the most, commonly employed buffers are
♦ Phosphate buffers prepared using salts like KH2PO4,
K2HPO4,NaH2PO4,Na2HPO4,etc
♦ Phosphoric acid buffers prepared using H3PO4.
♦ Acetate buffers – Ammonium acetate, Sodium acetate, etc.
♦ Acetic acid buffers prepared using CH3COOH.
The retention times also depend on the molar strengths of the buffer –
Molar strength is increasingly proportional to retention times. The strength of the buffer
can be increased, if necessary, to achieve the required separations.
The solvent strength is a measure of its ability to pull analytes from the column.
RVS College of Pharmaceutical Sciences, Coimbatore Page 17 1.3.3.2. pH of the buffer
pH plays an important role in achieving the chromatographic separations as it
controls the elution properties by controlling the ionization characteristics. Experiments
were con ducted using buffers having different pH to obtain the required separations.
It is important to maintain the pH of the mobile phase in the range of 2.0 to 8.0 as
most columns does not withstand to the pH which are outside this range. This is due to
the fact that the siloxane linkage area cleaved below pH 2.0, while pH valued above 8.0
silica may dissolve.
1.3.3.Mobile phase composition:
Most chromatographic separations can be achieved by choosing the optimum mobile
phase composition. This is due to that fact that fairly large amount of selectivity can be
achieved by choosing the qualitative and quantitative composition of aqueous and
organic portions. Most widely used solvents in reverse phase chromatography are
Methanol and Acetonitrile. Experiments were conducted with mobile phases having
buffers with different pH and different organic phases to check for the best separations
between the impurities. A mobile phase which gives separation of all the impurities and
degradants from each other and from Analyte peak and which is rugged for variation of
both aqueous and organic phase by at least ±0.2% of the selected mobile phase
composition.
1.3.4. Selection of detector:
The detector was chosen depending upon some characteristic property of the analyte like
UV absorbance, fluorescence, conductance, oxidation, reduction etc. characteristics that
are to be fulfilled by a detector to be used in HPLC determination are,
♦ High sensitivity, facilitating trace analysis
♦ Negligible baseline noise. To facilitate lower detection
♦ Large linear dynamic range
♦ Low dead volume
RVS College of Pharmaceutical Sciences, Coimbatore Page 18
♦ Inexpensive to purchase and operate
Pharmaceutical ingredients do not all absorb UV light equally, so that selection
of detection wavelength is important. An understanding of the UV light absorptive
properties of the organic impurities and the active pharmaceutical ingredient is very
helpful.
For the greatest sensitivity λmax should be used. UV wavelengths below 200 nm should be avoided because detector noise increases in this region. Higher
wavelengths give greater selectivity.
VALIDATION OF ANALYTICAL METHOD DEVELOPMENT
Introduction:
Analytical method validation13,14 is the process of demonstrating that analytical procedures are suitable for their intended use and provide accurate test results
that evaluate a product against its defined specification and quality attributes.
It is process involving confirmation or establishing by laboratory studies
the method / procedure/ system/ analyte gives accurate and reproducible result for
intended application in a proven and established range. That performance characteristic
of the method (accuracy, precession, sensitivity, ruggedness etc)..
Types of validation:15
Prospective Validation: At least three successive production size (US Via) batches, all batches made tested and report approved before distribution facilities and equipment
qualified.
Concurrent Validation: Generation of validation data concurrent or simultaneously with normal production schedules used in exceptional cases (low volume products); interim
reports required.
Retrospective Validation: This is establishing documented evidence that the process is performed satisfactorily and consistently over time, based on review and analysis of
RVS College of Pharmaceutical Sciences, Coimbatore Page 19 be addressed here are charged to equipment, process, specification and other relevant
changes in the past.
1.4.1 VALIDATION OF ANALYTICAL PROCEDURES 16,17 Definitions, Methodologyand Acceptance Criteria:
Different Types of Validation characteristics:
Precision
Accuracy
Specificity and Selectivity
Linearity and Range
Solution stability
Limit of Detection (LOD)
Limit of Quantification (LOQ)
Robustness
Ruggedness.
System Suitability
Generalized validation process for an HPLC assay method:
Validation2 is the process of collecting documented
evidence that the method performs according to its intended purpose. The validation
process has been described as follows:
1. Accuracy
Accuracy18 is the closeness of test results obtained by that method to the true value. The accuracy of an analytical method should be established across its range. There
are several methods that can be used for determining accuracy. The most common
include
Analyze a sample of known concentration and compare the measurement to the
true value. In this case, method accuracy is the agreement between the difference in the
measured analyte concentration and the known amount of analyte added. That is the
RVS College of Pharmaceutical Sciences, Coimbatore Page 20 Cm × 100
Ct
Where Cm is the measured concentration
Ct is the theoretical concentration.
Accuracy has also been reported as a sample is analyzed and the measured value should
ideally be identical to the true value. Accuracy is represented and determined by recovery
experiments. The usual range is being 10% above or below the expected range of claim.
The % recovery was calculated using the formula,
(a + b) -a
Percentage Recovery =
b×100
Where,
a – Amount of drug present in sample
b – Amount of standard added to the sample
ICH states that accuracy should be assessed using a maximum 9 determination over a
minimum of 3 concentration levels covering the specified range (eg. 3 concentration /3
replicates each of the total analytical procedure).
Acceptance Criteria:
1. For an assay method, mean recovery will be 100%± 2% at each concentration over the range of 80-120% of the target concentration.
2. For an impurity method, mean recovery will be 0.1% absolute of the theoretical concentration or 10% relative, whichever is greater for impurities in the range of 0.1-2.5
% (V/W).
2. Precision:
Precision14,19 of an analytical procedure expressed the closeness of agreement
(degree of scatter) between a series of measurement obtained from multiple samplings of
RVS College of Pharmaceutical Sciences, Coimbatore Page 21 The precision of test method is usually expressed as the standard deviation or relative
standard deviation of a series of measurements. Precision may be considered at three
levels: Repeatability, Intermediate Precision and Reproducibility.
System precision:
A System precision was evaluated by measuring the peak response of drug for six
replicate injection of the standard solution preparation as per the proposed method.
Method precision:
The method precision was determined by preparing the sample of a single batch of
the drug for tablet formulation six times and analysed as per the propsed method.
Acceptance Criteria:
1.Percentage Relative standard deviation (%RSD) NMT 1 % (Instrument precision) 2.(%RSD) NMT -2% (Intra- assay precision)
3.
Specificity: Specificity19 is the ability to assess unequivocally the analyte in the presence of components which may be expected to be present. Typically these mightinclude impurities, degradants, matrix, etc. Specificity shall be demonstrated by
performing Placebo / blank interference and forced degradation studies.
a. Blank interference:
Blank solution is prepared and analysed as per test method.
b. Placebo interference (In case of Drug products):
The placebo solution equivalent to the test concentration is also prepared and
RVS College of Pharmaceutical Sciences, Coimbatore Page 22
4.
Forced Degradation studies:The sample is degraded forcefully under the various stress conditions like
Light, heat, humidity, acid / base / water hydrolysis and oxidation to ensure the
degradation ranging 1 % to 20 %.
a) Light: The Drug product, drug substance and placebo are exposed to UV light for about 200 watt hours / square meter and the overall illumination not less than 1.2 million
Lax hours for visible light. The sample and placebo solution are prepared as per test
method and analyzed.
b) Humidity: The Drug product, drug substance and placebo are exposed for about 80%
RH at about 25°C for about one week. Prepare the sample and placebo solution as per test
method and analyzed.
c) Heat: The Drug product, drug substance and placebo are exposed at 105°C for about 12 hours (For substance having low melting point below 10°C of its melting point). The
sample and placebo solution are prepared as per test method and analyzed.
d) Acid / Base: The 0.1N acid or base solution of the drug refluxes the sample and placebo with 50 ml of acid / base solution for about 1 hour at 60°C. Neutralize the
solution and dissolve the contents in diluents as per test method. Change the strength of
acid and base or reflux time to ensure the desired degradation.
e) Oxidation: The sample was refluxed for 12 hour at 60°C with 1 % H2O2 or suitable
oxidant and dissolved the contents in diluents as per test method. The reflux time was
changed so as to ensure the desired degradation.
f) Water: The sample / placebo was refluxed with 100 ml of purified water for 12 hour at 60°C. Dissolve the contents in diluents as per test method. Change the reflux time so as
RVS College of Pharmaceutical Sciences, Coimbatore Page 23 Note: Based on the physic-chemical properties and literature stress conditions can be decided.
Acceptance Criteria:
1.Placebo / Blank should not elute at the retention time of analyte peak and known impurity peak.
2.Peak purity of analyte peak should be confirmed.
3.Degradation of active analyte peak should be from 1% to 20%.23
5. Limit of Detection:
The limit of detection20 is the lowest concentration of analyte in a sample that can be
detected but not necessarily determined in quantitatively using a specific method under
the required experimental conditions. Such a limit is expressed in terms of concentration
of analyte in the sample.
Following are different approaches: 1. Visual Evaluation Method:
The sample solutions have to be prepared with known lowest concentrations of
analyte and establish the minimum concentration at which the analyte can be reliably
detected by analyzing as per test method.
a. Based on Signal to Noise Ratio Method:
The LOD can be expressed as a concentration at specified signal-to-noise (S/N) ratio obtained from samples spiked with analyte. A signal-to-noise(S/N) ratio
between 3:1 and 2:1 is generally considered acceptable.
b. Based on the standard Deviation of the Response and the Slope:
1. The blank solution has to be prepared as per test method and inject six times into the chromatographic system.2. Similarly the linearity solution staring from lowest possible
concentration of analyte to 150 % (or as per protocol) of target concentration have to be
prepared to establish the linearity curve.
RVS College of Pharmaceutical Sciences, Coimbatore Page 24 3.3 X Standard deviation of the response of the blank (σ)
LOD =
Slope S= slope of the calibration curve of the analyte.
The slope shall be estimated from the calibration curve of the analyte.
6. Limit Of Quantitation:
The limit of quantitation20 is the lowest concentration of the analyte in a sample
that can be determined with acceptable precision and accuracy under the stated
experimental conditions quantitation limit is expressed as the concentration of analyte
(eg. Percentage, parts per million) in the sample.
Following are different approaches: a. Visual Evaluation Method:
The sample solutions with known lowest possible concentrations of analyte
and establish the minimum concentration at which the analyte can be reliably
quantified by analyzing as per test method.
b. Based on signal to noise ratio method :
The LOQ can be expressed as a concentration at specified signal-to-noise ratio obtained from samples spiked with analyte. A signal-to-noise ratio of 10:1 is generally
considered acceptable. The ratio recognized by the ICH (1996) is a general rule. It has
been stated that “the determination of LOQ is a compromise between the concentration
and the required precision and accuracy. That is, as the LOQ concentration level
decreases, the precision increases.
c. Based on the standard Deviation of the Response and the Slope:
The blank solution as per test method and inject six times into the chromatographic
system. Similarly the linearity solution staring from lowest possible concentration of
analyte to 150% (or as per protocol) of target concentration and establish the linearity
curve.
RVS College of Pharmaceutical Sciences, Coimbatore Page 25 10 X Standard deviation of the response of the blank(σ) LOQ =
Slope
The slope shall be estimated from the calibration curve of the analyte.
Acceptance Criteria:
1. In Pharmaceutical application, the LOQ is typically set at minimum 0.05% for active pharmaceutical ingredients.
2.LOQ is defined as the lowest concentration providing a RSD of 5%.
3.LOQ should be at least 10% of the minimum effective concentration for clinical applications.
4.Signal -to- noise ratio is 10:1.
7
. Linearity and range:Linearity: Linearity is the ability of the method to obtain test results that are
directly proportional to the analyte concentration within a given range.
Range: Range of analytical procedure is the interval between the upper and lower concentration of analyte in the sample (including concentrations) for which it has been
demonstrated that the analytical procedure has a sutable level of precision, accuracy, and
linearity.
Measurement: A range of standards should be prepared containing at least 5 different concentration of analyte which are approximately evenly spaced and span 50-150% of the
label claim.
At least 6 replicates per concentration to be studied. Plot a graph of
concentration (on X-axis) Vs mean response (on Y-axis) calculates the regression
equation.
Y – Intercept and correlation coefficient. Plot another graph of concentration (on
RVS College of Pharmaceutical Sciences, Coimbatore Page 26 The range of the method is validated by verifying that the analytical method provides
acceptable precision, accuracy, and linearity when applied to sample containing analyte
at the extreme of the range as well as within the range.
Acceptance criteria:
Coefficient of correlation should be NLT 0.99.
8. Ruggedness:
Degree of reproducibility of test results obtained by the analysis of the same
sample under a verity of conditions, such as different laboratories, different analysts,
different instruments etc.
Normally expressed as the lack of influence on test results of operational and
environmental variable of the analytical method.
Ruggedness is a measure of reproducibility of test results under the variation in
condition normally expected from laboratory to laboratory and from analyst to analyst
The following are the typical method parameters need to tested during method
validation:
Analyst-to-Analyst variability.
Column-to-Column variability.
System-to-System variability.
Different days.
Different Laboratories.
Stability of Solutions and mobile phase. ( At least for 48 hours )
9. Robustness:
Robustness of an analytical method is a measure of its capacity ti remain un affectedly small but deliberate variations in method parameters and provides an
indication of its reliability during normal usage.
For example a chromatographic method, the typical method parameters need to
change deliberately and verify during method validation:
Flow rate : (+/- 0.2ml/minutes).
Mobile phase composition : (+/- 10% of organic phase).
RVS College of Pharmaceutical Sciences, Coimbatore Page 27 PH of buffer in mobile phase : (+/- 0.2 units).
Filter suitability : (At least two filters).
For Variations:
1. System suitability should meet the acceptance criteria as per test method.
2. If system suitability doesn’t meet, the variation range is narrowed and carried out the
experiment again to meet system suitability.
10. SYSTEM SUITABILITY TESTING
System suitability testing21 is an integral part of many analytical procedures. The tests are
based on the concept that the equipment, electronics analytical operation and samples to
be analyzed constitute an integral system that can be evaluated as such. System suitability
test parameters to be established for a particular procedure depend on the type of
procedure being validated.
System Suitability Parameters
Tailing factor
Theoretical plate number
Theoretical plate per meter
Resolution factor
Capacity factor
Precision / Injection repeatability
Relative retention
a. Tailing factor:
Asymmetry factor13 of a peak was calculated from the following expression:
Peak tailing factor =
A
2
B
A
+
A – Left half of the peak at 5% peak height when the peak is bisected with a
perpendicular line dropped from the maximum of peak interest.
B – Right half of the peak at 5% peak height when the peak is bisected with a
perpendicular line dropped from the maximum of peak interest.
RVS College of Pharmaceutical Sciences, Coimbatore Page 28 The assessment of performance of column efficiency of a column is in terms of number
of theoretical plate
An equation shown below:
N = 5.54[t/wh/2]
Where,
t = Retention time
Wh/2 = width of peak at half weight
Theoretical plate number is a measure of column efficiency. i.e. how many peaks can
be located per unit run time of the chromatogram ,‘H’ or ‘HETP’, the height equivalent
to the theoretical plate, measures the column efficiency per unit length of the column.
Parameters which can affect ‘N’ or ‘H’ include peak position particle size in column,
flow rate of mobile phase and molecular weight of the analyte.
c. Capacity factor:21
It reflects the location of peak of interest with respect to the void volume i.e. elution time
of the unretained compound.
K1= (tr-to)-to
[tr – retention of analyte, to – retention of void or unretained component.]
Methods used for the examination of pharmaceutical material may be broadly classified
as;
d. Resolution: 17
R = 2 [(t2-t1)/ w2+w1] t2, t1 are the retention time
w2, w1 are the peak width at base line respectively.
Resolution is to measure how well the resulting two peaks are separated. For reliable
quantitation well separated peaks are essential for quantitation. This is a very useful
parameter if potential interference peak may be of concern. The closest eluting peak to
the analyte should be selected.
System Suitability Parameters and Recommendations (ICH Guidelines)
RVS College of Pharmaceutical Sciences, Coimbatore Page 29 Capacity Factor (k’) the peak should be well-resolved from other peaks and
the void volume, generally k’>2.0
Repeatability RSD </= 1% for N >/= 5 is desirable.
Relative retention not essential as long as the resolution is stated.
Resolution (Rs) Rs of > 2 between the peak of interest and the closest
eluting potential interferent (impurity, excipients,
degradation product, internal standard, etc).
Tailing Factor (T) T of </= 2
Theoretical Plates (N) In general should be > 2000
Class A: Test designed to establish identity, whether of bulk drug substances or
particular ingredient in a finished dosage form.
Class B: Method designed to detect and quantitative impurities in a bulk
drug substance or finished dosage form.
Class C: Methods used to determine quantitatively the concentration of a
bulk drug substance or of a major ingredient in a finished dosage form.
Class D: Methods used to assess the characteristics of finished dosage forms
such as dissolution profile and content uniformity.
Table No: 2 Characteristics that should be considered for different Type of analytical procedure:-
S.No Parameters Class A
Class B
Class C Class D
Quantitative
test
Limit
RVS College of Pharmaceutical Sciences, Coimbatore Page 30
1. Accuracy - Yes - Yes Yes
2. Precision - Yes - Yes Yes
3. Robustness Yes Yes Yes Yes Yes
4. Linearity and
Range - Yes - Yes Yes
5. Selectivity Yes Yes Yes Yes Yes
6. LOD Yes Yes Yes - -
7. LOQ - Yes - - -
RVS College of Pharmaceutical Sciences, Coimbatore Page 31
2. LITERATURE REVIEW & DRUG PROFILE
2.1.LITERATURE REVIEW:
1.V.Amudhavalli et al22 .,(2001) have done determination of Olmesartan and hydrochlorothiazide in the pharmaceutical formulation by RP-HPLC.A simple and sensitive method was developed on the shimadzu class HPLC system using c18 column. Using mobile
phase mixture Acetontrile and ammonium acetate buffer(ph-3.5) in the ratio of 55:45.Flow rate was 1.0ml/min and the effluents were monitored at 252nm and eluted at 2.14 and 4.62.The assay was validated for parameters like accuracy, precision, robustness, and system suitability.
2.Sudhakar Nandipati et al23 .,(2012) have done Development and validation of RP-HPLC method for the estimation of Telmisartan in bulk and tablet dosage form .A simple RP-HPLC method in the bulk dosage form for estimation of Telmisartan has developed .Mobile phase was potassium di-hydrogen phosphate buffer and acetonitrile(60:40) pH adjusted with phosphoric acid,c18 sun fire column(250×4.6×5µm) flow rate 1ml/min,wave
length 243 nm ,column temperature 45˚c,injection volume 10µl.System suitability parameters of Telmisartan retention time 3.4,plate count 8968,tailing 1.086,%RSD 0.1 those all are within the limit method is suitable for analysis.Validation parameters selectivity, precision, linearity, accuracy ,robustness all are within the limit so method was validated it is use full to the pharmaceutical analysis.
3.Paul Richards M et al24 .,(2011) have done Simultaneous estimation of Telmisartan and Amlodipine Besylate in the pharmaceutical dosage form. The chromatographic analysis was performed on ODS symmetry c18 column(150x4.6mm,5µ particle size) with mobile phase
consisting if acetonitrile and phosphate buffer(ph-4.0) in the ratio of 60:40 v/v,at the flow rate of 1.2ml/min and eluents monitored at the 237 nm. The method was validated for linearity ,accuracy ,precision ,robustness and application for assay as per the ICH guidelines.The retention times of amlodipine besylate and telmisartan were 2.633 and 5.6 min, respectively.The proposed method is simple, economical, accurate and precise , and could be successfully employed in the routine quality control for the simultaneous analysis of amlodipine besylate and telmisartan in tablets.
RVS College of Pharmaceutical Sciences, Coimbatore Page 32
forms. Its a simple, precise, accurate and rapid high performance thin layer chromatographic method has been developed and validated for the estimation of telmisartan and hydrochlorothiazide simultaneously in the combined dosage forms. The stationary phase used was precoated silica gel 60F254.The mobile phase used was the mixture of
chloroform :methanol: toluene(2:5:5v/v/v).The detection of the spots was carried out at 272 nm. The method was validated in the terms of linearity, accuracy, precision and specificity .The calibration curve was found to be linear between 250 to 500ng/spot for telmisartan and 200 to 700 ng/spot for hydrochlorothiazide. The limit of the detection and the limit of quantification for the telmisartan were found to be 75 and 190ng/spot, respectively used to determine the drug content of the mareted formulation.
5.Ajit Pandey et al26 .,(2011) have done UV- Spectrophotometric method for estimation of telmisartan in the bulk and tablet dosage form .A simple , precise and accurate UV spectrophotometric method has been developed and validated for the estimation of Telmisartan in the bulk and tablet dosage form. The zero order spectra of Telmisartan in 0.1 N NaOH shows λmax at 234.0 nm and the estimation was carried out by A(1% 1cm)and by comparison with standard. Calibration graph was found to be linear(r2=0.999) over the concentration range 4-24µg/ml. The proposed method was validated for its accuracy, precision, specificity , ruggedness and the robustness .The method can be adopted in its routine analysis.
6.R.Vijayamirtharaj et al27 .,(2010) have done Development and validation of the RP-HPLC method for the simultaneous estimation of telmisartan and atrovastatin calcium in tablet dosage forms. The present research deals with the development of RP-HPLC method for the determination of telmisartan and atrovastatin calcium in bulk and formulation using uv-detector. Selected mobile phase was a combination of acetoniltrile:buffer(0.001 potassium dihydrogen phosphate ) 65:35 ph -4.0 (adjusted with orthophosphoric acid) and the wavelength selected was 250 nm. The flow rate was kept at 2.0 ml/min, and the injection volume was 10µl. Retention times of telmisartan and atrovastatin calcium was found to be 3.72 and 6.14 min respectively. Linearity of the method was found to be 319-480µg/ml for telmisartan and 86-130µg/ml for atrovastatin calcium.This method was validated according to ICH guidelines.
RVS College of Pharmaceutical Sciences, Coimbatore Page 33
.Accurate, precise, rapid and economical method was developed for the estimation of telmisartan and metoprolol in bulk and tablet dosage form using second order derivative spectrophotometry. Wavelengths selected for quantitation were 299.5nm for telmisartan and 224nm for the metoprolol. Linearity was observed in the concentration range of 3-15µg/ml for both telmisartan and for metoprolol .The accuracy and precision were determined and found to comply with ICH guidelines.The proposed method was successfully applied for simultaneous estimation of both drugs in the commercial tablet preparation.
8.Zaveri Maitreyi et al29 .,(2010) have done Development and validation of the RP-HPLC for the simultaneous estimation of atenolol and hydrochlorothiazide in the pharmaceutical dosage forms. The reverse phase high performance liquid chromatography method of atenolol and hydrochlorothiazide is individually available in USP-27 but no reference is available for combined estimation of atenelol and hydrochlorothiazide in tablet formulation. The aim of our present work was to develop a precise and validated RP-HPLC method for simultaneous determination of atenolol and hydrochlorothiazide in tablet formulation.the quantification was carried out by using Zorbax SB-CN column in isocratic mode with mobile phase, water :buffer: methanol(50:35:15).The flow rate was 1.2ml/min.The pea purity of atenolol and hydrochlorothiazide were 0.999 and 1.000 respectively.
9.Sushant K Shrivastava et al30 .,(2012) have done Development and validation of a HPLC method for simultaneous estimation of amlodipine and telmisartan in the pharmaceutical dosage form. The chromatographic separation was achieved by using mobile phase acetonitrile and 0.05M sodium dihydrogen phosphate buffer(60:40) adjusted to ph-6.0,a c-18 column, perfectsil target ODS3.The mobile phase was pumped a flow rate of 0.8ml/min and eluents were monitored at 254nm.Retention times were 4.0 and 8.2 for amlodipine and telmisartan respectively. The method was validated in terms of accuracy, precision, linearity, range, specificity, limit of detection and limit of quantitation. The method was found to be efficient, accurate, precise, specific and economic and is suitable for routine quality control analysis.
RVS College of Pharmaceutical Sciences, Coimbatore Page 34
previous separation was developed .In simultaneous equation method ,hydrochlorothiazide and telmisartan were quantified using their absorptivity values of at selected wavelengths, via., 273 nm and 295 nm resp