This is a repository copy of
Explaining variations in public acceptability of road pricing
schemes
.
White Rose Research Online URL for this paper:
http://eprints.whiterose.ac.uk/2430/
Article:
Jaensirisak, S., Wardman, M. and May, A.D. (2005) Explaining variations in public
acceptability of road pricing schemes. Journal of Transport Economics and Policy, 39 (2).
pp. 127-153. ISSN 0022-5258
[email protected] https://eprints.whiterose.ac.uk/ Reuse
See Attached
Takedown
If you consider content in White Rose Research Online to be in breach of UK law, please notify us by
White Rose Research Online
http://eprints.whiterose.ac.uk/
Institute of Transport Studies
University of Leeds
This is a publisher produced version of a paper from the Journal of Transport
Economics and Policy. This final version is uploaded with the permission of the
publishers, and can originally be found at
http://www.bath.ac.uk/e-journals/jtep/
White Rose Repository URL for this paper:
http://eprints.whiterose.ac.uk/
2430/
Published paper
Jaensirisak, S., Wardman, M. and May, A.D. (2005)
Explaining Variations in
Public Acceptability of Road Pricing Schemes.
Journal of Transport Economics
and Policy, 39(2), pp.127-153
Explaining Variations in Public Acceptability
of Road Pricing Schemes
S. Jaensirisak, M. Wardman, and A. D. May
Address for correspondence: Dr Mark Wardman, Institute for Transport Studies, Uni-versity of Leeds, Leeds LS2 9JT UK. The authors thank the Government of Thailand and Ubon Ratchathani University for financial support for Dr Jaensirisak during his PhD study.
Abstract
The literature on acceptability of road pricing schemes is reviewed, and a number of limitations of that research are identified. In particular, little evidence is found of the differences between users and non-users and the effects of scheme design and level of charge. A stated preference survey was conducted in two UK cities to provide evidence on these issues. Charging was found to be more acceptable to non-users, those who perceived pollution and congestion to be very serious, those who considered current conditions unacceptable, and those who judged road pricing to be effective. It proved possible to identify design combinations, for both cities, which would be voted for by a majority.
Date of receipt of final manuscript: June 2004
127
1.0 Introduction
It has long been recognised by economists (Pigou, 1920; Walters, 1954; Vickrey, 1955) that road use should be charged on the grounds of economic efficiency. Transport planners (Ministry of Transport, 1964; May, 1975, 1992) subsequently proposed that road pricing is an appropriate technique for alleviating traffic congestion, reducing environmental impacts and generating revenue. While the efficiency properties of road user charging have long been appreciated, it is only more recently that its acceptability properties have been addressed.
To date the only successful implementations of road pricing have been in Singapore, several Norwegian cities, and most recently London. One of the principal barriers to the implementation of pricing for the use of road space is how to design acceptable schemes (Jones, 1998). The purpose of this paper is to contribute to what is now an extensive literature on the public acceptability of urban road pricing and in particular to investigate variations in acceptability in terms of scheme benefits, system features, personal attitudes, and socio-economic characteristics. Variations in acceptability across a number of British studies have been inspected and supplemented with a review of other relevant evidence. This review, covered in Section 2, yielded important insights and informed the design of a Stated Preference (SP) exercise that systematically examined the impact of a range of variables on public acceptability. The study methodology is explained in Section 3 and the empirical results are presented in Section 4. The estimated voting model is used to ‘‘forecast’’ acceptance levels for various road pricing schemes and for different groups of people and these are illustrated in Section 5. The concluding section sets the study findings in the context of other research in this area and also provides guidelines for the design of acceptable charging schemes.
2.0 Review of Acceptability of Road Pricing
2.1 Factors influencing acceptability of road pricing in the UK
Table 1 summarises the large number of British studies dealing with attitudes to road pricing. What is immediately apparent is that although the accep-tance level tends to be low it does exhibit considerable variation. There are a number of possible causes of this variation.
The need for revenue hypothecation and its use to benefit as many as possible so that opposition to the scheme is minimised has long been
Journal of Transport Economics and Policy Volume 39, Part 2
recognised (Goodwin, 1989; Jones, 1991; Small, 1992). Jones (1991) found acceptability to increase from 30 per cent where there was no explicit mention of the use to which the revenue would be put to 57 per cent when it was stated that the revenue would be used for improving public transport and facilities for pedestrians and cyclists. Increases in acceptability when hypothecation of the revenue was specified were also apparent in several other studies (CfIT/MORI, 2000, 2001; GOL, 2000; NEDO, 1991; Thorpe et al., 2000). Across all the results reported in Table 1, the mean acceptability was 35 per cent across the 32 cases where there was no hypothecation and 55 per cent across the 19 cases where hypothecation was specified. In the nine studies that provide acceptability rates both with and without hypothecation, the mean figure increases from 34 to 54 per cent.
Surprisingly, CfIT/MORI (2000) found that the intention to use the revenue to reduce fuel costs does not seem to have a larger impact on acceptability than its use to improve public transport. This could have resulted from the rather vague definition of the improvements, which is also a feature of several other studies. The findings contrast with Lex (2002), which, as would be expected, found the impact on accept-ability to be greater when the revenue was used to reduce other car taxes than to reduce public transport fares. Noticeably, acceptance levels are high where there is an ‘‘equivalent’’ reduction in other car taxes. There is some evidence that more significant improvements in public transport can contribute to encouragingly high levels of accept-ability (Schlag and Schade, 2000). Jones (1998, p. 275) concluded that, ‘‘In relation to the use of revenues, the evidence from public attitude surveys in the UK is clear: road pricing will not be publicly acceptable unless the money raised is hypothecated for local transport and environ-mental projects’’.
A key issue is the extent to which attitudes towards road pricing vary over time. Taylor and Brook (1998) and NCSR (2000) report four values for years between 1993 and 1999. There is evidence of a slight increase over time but this could well be due to the introduction of hypothecation and different system features in the two later years. In addition, the time series is not a long one. The Lex (2002) studies cover eight different years between 1989 and 2002. While a time series of this length is sufficient to detect whether there have been changes in attitudes over time, there are a number of confounding effects that make interpretation difficult. The system features, hypothecation, and terminology all vary, while the introduction of the White Paper in 1998 that allowed local authorities to implement road pricing (DETR, 1998) might have had an impact. On balance, however, it seems that there is some trend towards accept-ance of the principle. This of course is separate from any ‘‘mellowing’’
Explaining Variations in Public Acceptability Jaensirisaket al.
Table 1
Review of Acceptability of Road Pricing in UK
Context Source
Year of
survey Acceptance Respondents
Terminology
used System features presented Hypothecation of revenue used
Nationwide Jones (1991) 1991 30% 57%
General public Support Charging in heavily congested/polluted areas of cities
–
Improving public transport and facilities for pedestrians and cyclists, and reducing accidents
National Social Attitudes survey (Taylor and Brook, 1998; NCSR, 2000)
1993 18% General public In favour Charging in city centre – 1995 25% General public In favour Charging in city centre – 1996 30% General public Support Charging motorists £2 for
entering a city centre at peak time
Raising money to improve public transport
1999 25% General public Support Charging motorists £2 for entering a city centre at peak time
Raising money to improve public transport
CfIT/MORI (2000, 2001)
2000 27% General public Support Charging in city centre –
39% To invest in public transport
41% To reduce VED/fuel duty
2001 37% General public Support Charging in city centre –
54% To invest in public transport
PATS Consortium (2001)
2000 35% General public Agree –
Journal
of
Transport
Economics
and
Policy
Volume
39,
Part
2
Nationwide Lex/RAC Report on Motoring 1989–2002 Lex (2002) 1989 1990 1994 1995 1997 1998 1999 2002 14% Net34%
Net15%
Net23%
Net10%
Net15%
Net32%
Net58%
54%
71%
65%
73%
76%
Motorists Should be introduced to reduce pollution/ congestion Support Acceptable
Tolls for city centre Drivers charged £3 a day to drive in city
Tolls on certain main roads and motorways
Drivers charged £3 a day to drive in city
Charge people who want to drive into town centres Drivers charged £3 a day to drive in city
Charge motorists to drive into town centres (after introducing the White Paper) Charge motorists to drive into town centres
If the level of tolls were set in accordance with level of congestion
Road tolls as part of a package of better roads, public transport and traffic management – – – – – – – – – – – – –
If there were equivalent reductions in public transport fare
If there were equivalent reductions in tax disc If there were equivalent reductions in fuel duty
Table 1continued
Case study Source
Year of
survey Acceptance Respondents
Terminology
used System features presented Hypothecation of revenue used
London NEDO (1991) 1991 43% General public Acceptance – –
63% – As suggested by respondents
HFA (1992) 1992 37% Car users Acceptance – –
GOL (2000) 1999 53% General public Good thing A daily charge of £5 for driving within Central London and £2.50 for Inner London
–
67% On transport improvements
73% On a mix of spending package
30% Car users Good thing –
45% On transport improvements
62% On a mix of spending package
London First (1999)
1999 76% General public Support A £5 daily charge for cars, between 7 a.m. and 7 p.m., inside the Inner Ring Road, with discount for residents
–
Edinburgh Cainet al. (2002)
1999 65% General public Support A £1 charge to cross the city boundary, or for a permit to drive in the city centre
Raising around £30M p.a. for major investment and significant transport improvements 2000 60% General public Support Only the first time crossing a
cordon into the central area –
21% Each time crossing a cordon
into the central area
Journal
of
Transport
Economics
and
Policy
Volume
39,
Part
2
34% Area Licence for driving within the central area
32% Inbound cordon toll for
crossing the City by-pass, plus a central area charge 2000 64% General public Support A £1 charge to cross two
inbound cordons, between 7:30 a.m. and 6:30 p.m. (unlimited number of crossings), on working days
–
47% A £1.50 charge to cross a city centre inbound cordon, between 7:30 a.m. and 6:30 p.m. (unlimited number of crossings), on working days
43% A £2 charge to cross a city
centre inbound cordon during a.m. peak time (unlimited number of crossings)
22% A £3 charge to cross two
inbound cordons during a.m. peak time (unlimited number of crossings)
Cambridge Thorpeet al. (2000)
1994 34% General public Acceptable Charging in the city centre –
51% Guaranteed as suggested by
respondents Bristol Collis and
Inwood (1996)
1996 32% General public Acceptable –
Explaining
Variations
in
Public
Acceptability
Jaensirisak
et
al
.
Table 1continued
Case study Source
Year of
survey Acceptance Respondents
Terminology
used System features presented Hypothecation of revenue used
Leeds Bonsallet al. (1998)
1997 30% General public A good idea Charging people for using roads at busy times of day
–
Newcastle upon Tyne
Thorpeet al. (2000)
1998 48% 56%
General public Acceptable Charging in the city centre –
Guaranteed as suggested by respondents
Leeds Schlag and Schade (2000)
1998 8% General public Support Distance-based pricing –
14% Congestion pricing –
16% Cordon pricing for the
inner city
–
44% Cordon pricing for the
inner city
To provide much better and cheaper public transport, and to improve the urban living conditions and facilities for pedestrians and cyclists York Schlag and
Schade (2000)
1998 10% General public Support Distance-based pricing –
23% Congestion pricing –
20% Cordon pricing for the
inner city
–
53% Cordon pricing for the
inner city
To provide much better and cheaper public transport, and to improve the urban living conditions and facilities for pedestrians and cyclists
Note: The net acceptance figures denote the difference between those in favour and those against but excluding the no opinion responses.
Journal
of
Transport
Economics
and
Policy
Volume
39,
Part
2
towards road pricing after its actual introduction, which we return to below.
While there could be effects from the terminology used to define acceptability, which in Table 1 covers ‘‘support’’, ‘‘in favour of ’’, ‘‘acceptable’’, ‘‘a good idea’’, ‘‘agree’’, and ‘‘should be introduced’’, it is not possible to detect whether these differences influence the outcome. Noticeably, the concept of a referendum/voting for a scheme has not been addressed.
Surprisingly little attention has been paid to the impact of the level of charge on acceptability. Cain et al. (2002) consider different charges and, as expected, acceptability diminishes as the charge increases, although con-founding effects could be at work. Comparing the results across different studies is not conclusive in this regard and the lack of controlled variation in charge levels within studies is a defect of attempts to explain variations in acceptability.
Cainet al. (2002) demonstrate that there are large differences in accept-ability according to system features. For example, an area licence that would include residents was acceptable to 34 per cent whereas a system with a daily charge that would not impact on local residents was acceptable to 60 per cent. However, Schlag and Schade (2000) found little difference in acceptability according to whether the system involved distance based, con-gestion based or cordon pricing. Introducing road tolls as part of a package of measures to tackle transport problems, including better roads, public transport and traffic management, appears to have a large impact on acceptability (Lex, 2002).
As expected, there are large differences according to whether the general public is interviewed or just car users. GOL (2000) found that support amongst the general public ranged between 53 and 73 per cent but fell to between 30 and 62 per cent amongst car users. The HFA (1992) study restricted to car users obtained a relatively low acceptability figure of 37 per cent.
We might expect differences amongst cities, particularly between London and other cities. In part, this is because congestion problems are more serious in London but also because road pricing has been on the political agenda in London for some time. Schlag and Schade (2000) is the only study to have compared two British locations. However, Leeds and York are not greatly different and it is not surprising that acceptability does not vary greatly between the two places. Comparing across the studies in Table 1, and ignoring the nationwide studies, acceptability in London averages 62 per cent when there is hypothecation and 48 per cent when there is not. The corresponding figures across the other cities are somewhat lower at 54 and 31 per cent.
Explaining Variations in Public Acceptability Jaensirisaket al.
2.2 Predictive models of acceptability
The acceptability variation in section 2.1 largely arises from comparisons across studies, which limits the level of detail and tells us little about varia-tions due to personal characteristics and attitudes. Several studies have sought to explain variations in acceptability across individuals.
Verhoefet al. (1997) were the first to develop a predictive model of road pricing acceptability. Motorists in the Randstad area expressed their opinions about road pricing and an ordered probit model was estimated to explain the influence of various factors. The most significant influence was the willingness to pay for time savings while acceptance was higher where congestion was seen as a general social problem and there was an expectation of being compensated. Where public transport was seen as the best alternative, there was greater acceptance of road pricing. Acceptance also increased with journey length, income, and the severity of congestion.
Rienstra et al. (1999) examined public support for policies in the Netherlands impacting upon congestion, traffic safety, and the environ-ment. An ordered probit model was developed to explain variations in support for all policies by reference to numerous socio-economic and attitudinal variables. Support for pricing measures tends to increase with educational level and to be somewhat lower for car owners and driving licence holders but income did not have an impact. The perceived effective-ness of a measure had a strong impact on acceptance. The perception of problems increased acceptance of transport policies, with much stronger impacts from social than individual problems.
Schade and Schlag (2000) developed a regression model to explain variation in acceptability across samples of motorists in each of Athens, Como, Dresden, and Oslo. The emphasis was upon social and psychological factors and unfortunately the variation in user charge was not systematically controlled. The variation in acceptability was instead explained by attitudinal variables specific to individuals, such as who has responsibility for resolving transport problems, perceptions of transport problems and beliefs relating to socially important transport objectives, and attitudinal variables specific to each strategy, including the perceived effectiveness in reducing traffic, personal benefits of the strategy, prior knowledge of the strategy and social norms.
Harringtonet al. (2001) estimated a binary probit model as to whether Southern Californian residents would support in a referendum congestion pricing on all roads in the region. It was found that, as expected, support was less at higher levels of the congestion charge but was increased as the amount used in tax rebates increased. There was also a positive impact on support from the perceived seriousness of the congestion problem, the
Journal of Transport Economics and Policy Volume 39, Part 2
amount of time it would save, and from household size, but negative impacts from the level of car ownership and income. However, the tax rebate had only a small impact on voting support.
2.3 Other evidence
Numerous studies illustrate the critical impact of hypothecation on accept-ability (Schlag and Teubel, 1997; PATS Consortium, 2001; Gu¨ller, 2002; Tretvik, 2003). Jones (1998, p. 276) concluded that ‘‘Most professional and governmental bodies in the UK now accept that hypothecation of revenues will be part of the price that will have to be paid to gain sufficient public support for urban road pricing to ensure its introduction in this country’’. There are, however, inconsistent findings across studies. Some have found that the greatest impact is obtained from spending on improved public transport (Jones, 1991; GOL, 2000; Schlag and Schade, 2000; CfIT/ MORI, 2001; Thorpe et al., 2000; Ha˚rsman, 2001) while in others it is investment in the road network (Larsen, 1995; PATS Consortium, 2001) and in yet others it is reduction in taxes (CfIT/MORI, 2000; Harrington et al., 2001; Lex, 2002).
Acceptability has been found to be influenced by attitudes to transport problems and the perceived effectiveness of the scheme (Bartley, 1995; Sheldon et al., 1993; van der Loop and Veling, 1994; Luk and Chung, 1997; Schlag and Teubel, 1997; Rietveld and Verhoef, 1998; PATS Consor-tium, 2001). It is also influenced by attitudes relating to the environment and towards the hazards of car traffic (Jones et al., 1996; Verhoef et al., 1997; Nilsson and Kuller, 2000; Gu¨ller, 2002). Other attitudinal aspects of acceptability relate to perceptions of freedom and fairness (Baron, 1995; Jones, 1998; Jakobssonet al., 2000; Golob, 2001; PATS Consortium, 2001) and concerns over equity issues (Giuliano, 1992, 1994; Langmyhr, 1997; Teubel, 1997; Ha˚rsman, 2001).1 An interesting point about conges-tion was observed by Sheldonet al. (1993) who stated, ‘‘no-one appears willing to accept that they contribute to the problem: it is typically some-thing that is caused by someone else’’. Nonetheless, Rienstraet al. (1999) recognise that social concerns do influence preferences towards road pricing, while Schade and Schlag (2000) identified social norms to be important. Finally, scheme benefits that will influence acceptability are time savings and environmental improvements.
NPRA (1999) demonstrates clearly how attitudes towards road pricing can change over time with the introduction of an actual scheme. In Oslo,
1Of course, claims that pricing would be ineffective or unfair could simply stem from a general
opposi-tion to having to pay.
Explaining Variations in Public Acceptability Jaensirisaket al.
only 30 per cent had positive attitudes towards the proposed toll ring in 1989, the year prior to implementation. The figures increased to 36 per cent immediately after implementation and there has been an almost mono-tonic annual increase up to the 46 per cent achieved in 1998. The use of the money raised for transport investment is regarded to be central to these findings. Larsen (1988) reports that in Bergen before the toll ring was intro-duced 54 per cent were against with only 13 per cent unreservedly in favour. A year after its introduction, 50 per cent were in favour with 37 per cent opposed.
Acceptability is likely to relate to personal characteristics and con-straints, which may include income, age, education, transport mode used, frequency of car use, the availability and quality of alternative modes, location of household and workplace, household type, and life style (Jones, 1995; Stokes and Taylor, 1995; Odeck and Brathen, 1997; Rietveld and Verhoef, 1998; Harringtonet al., 2001). However, it is clear from a number of studies (Bartley, 1995; Rienstra et al., 1999; Schade and Schlag, 2000) that socio-economic factors have a somewhat lesser impact on acceptability than do attitudinal factors.
The importance of the communication process to acceptability has been highlighted (Sheldon et al., 1993; Schade and Schlag, 2000; Ha˚rsman, 2001), making clear the main objectives, addressing public concerns and spelling out the benefits. Frey (2003) claims that the key barriers to public acceptance are: misunderstanding of the role of prices in allocating scarce resources; aversion to price as a means of allocating resources as inherently unfair; mistrust of government intervention; and distributional concerns. He concludes that a fundamental change in decision making in the form of local referenda offer the potential to overcome resistance. The experience of the Swiss alpine village of Saas Fee is cited where 57 per cent voted in favour of a pricing scheme in April 1998, after this form of direct democracy induced widespread discussion, in contrast with rejection of previous proposals in 1993.
Last but not least, the fundamental issue of the level of user charge has not received the attention that it deserves. A few studies have presented a level of charge (Schade and Schlag, 2000; PATS Consortium, 2001) but, with one notable exception (Harringtonet al., 2001), no quantified relation-ship between acceptance and the charge has been developed
2.4 Lessons from previous research
Although there is, as we have demonstrated, a wealth of evidence on public attitudes towards urban road pricing, it is clear that some important issues have not received the attention that they deserve.
Journal of Transport Economics and Policy Volume 39, Part 2
First, some encouragingly high levels of acceptability can be achieved given the appropriate design of a scheme. However, in the British context there has been no systematic attempt to estimate the separate effects on acceptability of a comprehensive range of relevant explanatory variables. It is essential that analysis of the expected large variation in acceptability is quantified so as to provide the maximum guidance to policy makers and to complement the few instances where formal models have been estimated.
Second, the effects of different charge levels on acceptability need to be examined since they can be expected to be of fundamental importance yet most studies considered only a single charge level and in some no actual level was mentioned.
Third, the effects on acceptability of scheme benefits, other than those arising from revenue hypothecation, and of system features, such as charging method, area and period, have not received a great deal of attention.
Fourth, the important distinction between users and non-users has received relatively little attention. It is reasonable to focus on users when the issue is the effectiveness of road pricing but as far as acceptability is concerned the views of non-users also count in a democratic society.
Finally, various definitions of acceptability have been used, but a fundamental issue is whether the public would vote for a scheme. Using a referendum response scale within SP would send the clearest signal to policy makers not only of what individuals most want but also of what is politically feasible. The exercise then becomes a form of direct democracy, the attractions of which in this context have been discussed by Frey (2003).
3.0 Stated Preference Method and Data Collection
Stated Preference (SP) is a suitable methodology to allow the development of quantitative relationships explaining variations in the acceptability of road pricing given the absence of opportunities to express actual voting preferences. Jones (1998) identified five key questions that need to be addressed prior to designing a charging scheme. These are: who should be charged; how much should they be charged; where should they be charged; when should they be charged; and how should they be charged? The attributes selected in this study cover all but the first issue. In addition, previous research indicates that key points to cover are personal benefits, environmental benefits, and the use to which the revenue is put. The issue of whether the revenue is hypothecated was not addressed since
Explaining Variations in Public Acceptability Jaensirisaket al.
previous studies overwhelmingly indicate that there is little point in advanc-ing for consideration scenarios where there is no use of the revenues raised to benefit the public directly.
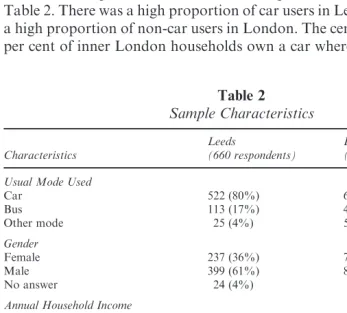
[image:16.523.21.368.282.594.2]The five SP exercises used contained three common attributes of road charge, which could be £1, £3, £5, and £7, and car and bus delayed travel time, both of which could be reduced by 25, 50 or 75 per cent. Each exercise also included an attribute from revenue allocation, environmental improve-ment, charged area, charged time and charging method. Greater detail about the development of the SP exercises is provided in Jaensirisak (2002). Data collection was conducted in Leeds and London during November 2000 and March 2001. There were 830 respondents in total, split 80 per cent Leeds and 20 per cent London, and sample characteristics are given in Table 2. There was a high proportion of car users in Leeds but, as expected, a high proportion of non-car users in London. The census indicates that 49 per cent of inner London households own a car whereas 65 per cent do in
Table 2
Sample Characteristics
Leeds London
Characteristics (660 respondents) (170 respondents)
Usual Mode Used
Car 522 (80%) 69 (41%)
Bus 113 (17%) 47 (28%)
Other mode 25 (4%) 54 (32%)
Gender
Female 237 (36%) 79 (47%)
Male 399 (61%) 83 (49%)
No answer 24 (4%) 8 (5%)
Annual Household Income
Less than £10,000 71 (11%) 19 (11%)
£10,000–£19,999 111 (17%) 23 (14%)
£20,000–£29,999 132 (20%) 31 (18%)
£30,000–£39,999 80 (12%) 19 (11%)
£40,000–£49,999 58 (9%) 21 (12%)
£50,000–£59,999 36 (6%) 14 (8%)
£60,000 or more 46 (7%) 20 (12%)
No answer 126 (19%) 23 (14%)
Age
24 or below 8 (1%) 6 (4%)
25–34 77 (12%) 58 (34%)
35–44 137 (21%) 41 (24%)
45–54 174 (26%) 27 (16%)
55 or over 248 (38%) 31 (18%)
No answer 16 (2%) 7 (4%)
Journal of Transport Economics and Policy Volume 39, Part 2
Leeds. Not surprisingly, incomes tended to be higher in the London sample. The gender and age distribution of the sample from London was not sub-stantially different from the 2001 census while the Leeds sample includes a slightly higher proportion of men and respondents over 45 than expected from the census figures.
Respondents were asked to indicate their general perceptions. Over half (56 per cent) of the Leeds respondents perceived their current travel situa-tion as acceptable while not surprisingly, given the worse condisitua-tions in London, only a third from London did. Three quarters from Leeds per-ceived transport related problems of congestion and pollution to be serious or very serious, yet over 90 per cent from London did.
The majority of car users did not perceive that charging would be an effective solution in reducing congestion and pollution. About a third of car users from Leeds but nearer a half from London, where road pricing had been on the political agenda for some time, believed that charging is effective in reducing the problems. However, over half of non-car users from both Leeds and London believed in the effectiveness of charging.
Some respondents pointed out that they have a strong dislike of charging, and not surprisingly the proportion was higher in Leeds (33 per cent) than in London (11 per cent). These responses reflect opinions that car users already pay enough and should not have to pay more, that charging is not a solution, that they would have some difficulties without cars, or simply that they were against the charge in principle.
4.0 Voting Behaviour Model
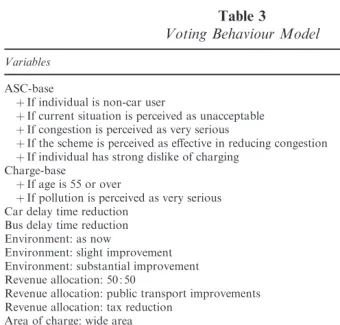
The logit model of SP voting preferences is reported in Table 3 and was estimated using LIMDEP (Econometric Software, 1999). All variables are entered into the utility function relating to the yes responses, with the utility of a no response set to zero. The charge is specified in pence per day and the delayed time reductions are in minutes per day. All other terms are dummy variables.
The model contains segmentations representing systematic variation in coefficients across different categories of person type and attitudes that were statistically significant. However, estimation of a random parameters logit model found the standard deviations of the parameter distribution to be far from significant, indicating that the coefficients vary little across individuals other than that accounted for by the segmentation variables. The overall r2 goodness of fit is very satisfactory, particularly for such an unfamiliar choice context, and compares favourably with figures
Explaining Variations in Public Acceptability Jaensirisaket al.
around 0.1 that SP models typically achieve in more conventional travel choice contexts.
The model reported in Table 3 contains some main effects that are not sig-nificant at the usual 5 per cent level but which were retained since they had the expected effect on voting intentions. The omitted main effects, which all had negligible impacts, are bus delayed time, slight environmental improve-ment, and revenue allocation entirely to public transport improvements.
[image:18.523.20.361.63.388.2]The alternative specific constant (ASC) allows for any preference of one alternative over the other, all other things being equal. It is here expected to be negative because of opposition to charging regardless of the level of the charge. The results show that in general the charging system is not accept-able to the public. However, different groups of people evaluate the system differently, with attitudes having a noticeable moderating effect. Charging
Table 3
Voting Behaviour Model
Variables Coeff. (t-ratio)
ASC-base 1.0754 (7.1)
þIf individual is non-car user 0.8472 (7.1)
þIf current situation is perceived as unacceptable 0.3906 (3.4)
þIf congestion is perceived as very serious 0.7136 (3.3)
þIf the scheme is perceived as effective in reducing congestion 0.4865 (2.3)
þIf individual has strong dislike of charging 0.5669 (4.1)
Charge-base 0.0028 (9.4)
þIf age is 55 or over 0.0013 (3.9)
þIf pollution is perceived as very serious 0.0022 (7.6)
Car delay time reduction 0.0096 (2.4)
Bus delay time reduction n.s.
Environment: as now Base
Environment: slight improvement n.s
Environment: substantial improvement 0.6655 (3.0)
Revenue allocation: 50 : 50 Base
Revenue allocation: public transport improvements n.s.
Revenue allocation: tax reduction 0.2846 (1.2)
Area of charge: wide area Base
Area of charge: small area 0.7562 (4.2)
Time of charge: all day Base
Time of charge: peak time 0.1924 (1.0)
Method of charge: fixed charge Base
Method of charge: distance-based dummy 1.1001 (2.9)
Method of charge: time-based dummy 1.1477 (3.4)
Method of charge: delay-based dummy 1.0276 (3.4)
Observations 2277
r2 with respect to constants 0.210
Note: Wide and small areas are within the North/South Circular Roads and Inner Ring Road for
London, and the Outer Ring Road and Inner Ring Road for Leeds.
Journal of Transport Economics and Policy Volume 39, Part 2
is somewhat more acceptable to non-car-users and to those who perceive congestion to be very serious. Lesser effects are apparent for those who stated that the current situation is unacceptable and who perceive road charging schemes as an effective means of reducing congestion. However, as expected, charging is less acceptable to those who have a strong dislike of charging in principle and object strongly to paying more for using their car.
The system becomes less acceptable, as expected, as the level of charge increases. Those who are 55 or older are more averse to charging than others. This category will contain retired individuals who have relatively low incomes but we might also speculate that there is a ‘‘generation gap’’ effect here, whereby greater concerns about the environment and conges-tion lead to different attitudes towards car restraint. Those who perceive pollution to be very serious are much more likely to tolerate charging, and their charge coefficient is not far removed from zero. Surprisingly, the sensitivity to the charge does not vary with income group.
Table 3 indicates that the acceptability of charging systems can be improved by reducing car delayed time. A one-minute reduction in car delay time is equivalent to 3.42 pence for the base group. However, this should not be interpreted as a value of time in the conventional sense since the response to charge variations reflects factors not directly related to will-ingness to pay for time savings such as protest responses and social concerns, while no payment would be involved for non-users or those who would change behaviour to avoid the charge. Given the likely range of time savings, this factor will only have a limited effect on forecast levels of acceptability.
An appreciable increase in acceptability results if the scheme yields substantial environmental improvements. An incremental variable was specified to determine whether those who thought pollution was currently a serious problem had a higher value of the environmental improvement variable. Surprisingly, the coefficient was not significant. It may be that the interpretation of exactly what a substantial improvement is varies across individuals; for example, those with stronger environmental concerns might be more sceptical of the magnitude of any possible improvements.
There is a preference for using the revenue raised to reduce taxes but it is small. This is not unreasonable given that the sample contains a mix of car users, who might be expected to prefer tax reductions, and non-car users, who would prefer the revenue to be spent on public transport. There is also the issue here as to the likelihood of promised tax reductions occurring, while some car users would wish public transport to be improved to provide a more attractive alternative under such a scheme. With hindsight, an indication of the financial benefit from the tax reductions should have
Explaining Variations in Public Acceptability Jaensirisaket al.
been provided. The lack of any strong preference between the use of the revenue raised for tax reductions or public transport improvements is in line with the findings of other studies cited in section 2.3.
Charging systems would be much more acceptable if the area of charge was limited to within the central area. This will stem not only from the more tightly defined area reducing the incidence of charge but also, given that the central area is the most congested, from notions of fairness, effectiveness and need. There is also a preference for charges at peak times only, although the effect is only minor. Presumably concerns of fairness and need also apply here, but the impact on tax incidence of the shorter charged period is less than the impact of the smaller charged area.
Finally, a series of dummy variables was specified for each of the schemes other than fixed charge. The charge that would be incurred under distance, time, and delay based schemes for travel in the charged area was calculated by respondents and this was, where appropriate, entered as the charge variable. Thus the incremental variables indicate any preference amongst the different charging systems over and above the level of charge.
It can be seen that respondents have a preference for a fixed charge system. All the three other systems were disliked to very similar and very appreciable extents. This is probably because people prefer to know how much the charge would be before travelling (Bonsall and Cho, 1999). While this aspect of uncertainty would fall with familiarity with a system, the time, distance, and delay based charging mechanisms will be associated with greater variability, due to variability in congestion and route switch-ing, and hence risk averse individuals will prefer a fixed charge system. Some people may be concerned with safety under time and delay based charges, which tend to influence speeding.
It is possible to estimate statistically significant effects from attitudinal and socio-economic variables on terms other than the ASC and the charge, but not simultaneously with the latter, and it was the incremental effects in Table 3 that provided the best fit. As tends to be the case in studies of the acceptability of road user charging, attitudinal factors explain much more variation in acceptability than do socio-economic variables.
5.0 Prediction of Variations in Acceptance Levels
This section examines the effects of person types and charging schemes on the predicted acceptability of user charging using the sample enumeration procedure.
Journal of Transport Economics and Policy Volume 39, Part 2
5.1 Predicted voting acceptance levels for different groups of people
In order to demonstrate different levels of acceptance in different groups of the public, a basic charging scenario is defined as a fixed daily charge in the wider area between 7 a.m. and 7 p.m. involving no car delayed time reduc-tion or environmental improvement and with revenue allocated between public transport improvements and tax reductions. Table 4 demonstrates how the acceptability of this base scenario varies across four charge levels for the socio-economic factors found to have a significant effect on voting behaviour. The level of charge has a very considerable impact on acceptability for every group. Age group makes only a modest difference to the proportions voting in favour but in contrast, and as expected, there is a very large difference between car users and non-users. Even at the low rate of £1 per day, only 27 per cent of car users would support such a scheme, whereas a majority of non-car users would vote in favour. Nonetheless, the effect of the charge is such that it does not take a large increase before a majority of even non-car users would not vote for the scheme. At a charge of £5 per day, the basic scenario attracts very little support amongst car users. The results clearly indicate the importance to politicians of taking into account the views of non-car users and demon-strate the fundamental role, as expected, that the actual charge level has to play in acceptability.
[image:21.523.21.363.431.581.2]Table 5 demonstrates how the acceptability for the basic scenario varies with the charge level and individuals’ attitudes. Acceptance levels for a £1 per day charge are relatively high at around 50 per cent amongst those who perceive their current travel situation to be unacceptable, those who per-ceive congestion and pollution problems to be very serious, and those
Table 4
Predicted Acceptance Levels for Different Personal Characteristics
Charging level (per day)
All
respondents Car users
Non-car
users Age<55 Age 555
£1 (base) 35.0% 27.2% 56.2% 36.8% 31.5%
£2 30.2%
(13.7%)
22.5%
(17.3%)
51.0%
(9.3%)
32.7%
(10.9%)
25.3%
(19.9%)
£3 26.0%
(25.6%)
18.6%
(31.6%)
46.0%
(18.1%)
29.0%
(21.2%)
20.1%
(36.2%)
£5 19.4%
(44.6%)
12.8%
(52.9%)
37.2%
(33.8%)
22.9%
(37.8%)
12.5%
(60.3%)
£7 14.7%
(58.0%)
9.0%
(66.9%)
30.4%
(45.9%)
18.3%
(50.3%)
7.9%
(74.9%)
Note: Figures relate to the base charging scenario.
Explaining Variations in Public Acceptability Jaensirisaket al.
who perceive charging to be effective in reducing congestion and pollution. The figure is a little lower for those with no strong dislike of charging. For those who do not have these attitudes, the acceptance levels are low at around 25 per cent. However, once again the acceptance rates drop steadily as the charge is increased, and even at £3 per day there is no majority in favour of the scheme even amongst those whose attitudes most predispose them towards it.
[image:22.523.19.364.83.416.2]Not only have we been able to discern more significant effects on model coefficients from attitudinal than socio-economic variables, as is typical in studies of charging acceptability, but the magnitude of the individual effects on acceptability are generally larger for the attitudinal variables.
Table 5
Predicted Acceptance Levels for Different Personal Attitudes
Charging level (per day) Current situation perceived acceptable Current situation perceived unacceptable Congestion perceived as very serious Congestion perceived as not very serious Pollution perceived as very serious Pollution perceived as not very serious
£1 (base) 27.4% 47.8% 53.8% 27.1% 52.6% 29.2%
£2 22.6%
(17.5%)
43.0%
(10.0%)
49.5%
(8.0%)
22.1%
(18.5%)
50.0%
(4.9%)
23.6%
(19.2%)
£3 18.6%
(32.1%)
38.4%
(19.7%)
45.4%
(15.6%)
17.9%
(33.9%)
47.4%
(9.9%)
18.9%
(35.3%)
£5 12.7%
(53.6%)
30.7%
(35.8%)
37.9%
(29.6%)
11.6%
(57.2%)
42.4%
(19.4%)
11.7%
(60.0%)
£7 8.8%
(67.9%)
24.7%
(48.3%)
31.8%
(40.9%)
7.6%
(72.0%)
37.8%
(28.1%)
7.1%
(75.7%)
Charging level (per day) Perceived effective in reducing congestion Perceived ineffective in reducing congestion Perceived effective in reducing pollution Perceived ineffective in reducing pollution Strong dislike of charging No strong dislike of charging
£1 (base) 46.4% 27.4% 46.2% 28.2% 21.4% 40.6%
£2 41.1%
(11.4%)
22.9%
(16.4%)
40.8%
(11.7%)
23.7%
(16.0%)
17.5%
(18.2%)
35.4%
(12.8%)
£3 36.3%
(27.8%)
19.2%
(29.9%)
35.9%
(22.3%)
19.9%
(29.4%)
14.4%
(32.7%)
30.8%
(24.1%)
£5 28.2%
(39.2%)
13.5%
(50.7%)
27.8%
(39.8%)
14.2%
(49.6%)
10.9%
(49.1%)
23.2%
(42.9%)
£7 22.3%
(51.9%)
9.7%
(64.6%)
21.9%
(52.6%)
10.3%
(63.5%)
7.2%
(66.4%)
17.8%
(56.2%)
Note: Figures relate to the basic charging scenario.
Journal of Transport Economics and Policy Volume 39, Part 2
5.2 Predicted voting acceptance levels for different charging schemes
This section presents the forecasts of acceptance levels for various road pricing systems in Leeds and London characterised in Table 6. The nine scenarios show the cumulative effects of system features. Scenario 1 is the base system, where charging is the wide area within the Outer Ring Road of Leeds and the North/South Circular Roads of London between 7 a.m. and 7 p.m., but with no car or bus delayed time reduction or environmental improvement. Scenarios 2 and 3 show the effects of charging only in the small area and of substantial environmental improvement. Scenarios 4 to 6 illustrate the impacts of different reductions in car delayed time, and scenarios 7 to 9 demonstrate the effects of different methods of charging. We have not covered the impact of allocating the revenue entirely to tax reductions instead of an equal allocation between tax reductions and public transport improvements since it is very minor.
The predicted acceptance levels across five different charge levels are presented in Table 7 for Leeds and Table 8 for London. These illustrate a wide range of acceptance levels across the charging scenarios, rather than a single general acceptance as presented in many attitudinal studies, and again the strong variation with the charge is very much evident.
[image:23.523.18.365.398.571.2]Scenario 2 shows that the system will be dramatically more acceptable when it covers just the smaller area. Scenario 3 shows a further appreci-able increase in acceptance when the environment is substantially improved. Scenarios 4 to 6 illustrate that car delayed time reductions have only a minor effect on acceptance. By comparing scenarios 7 to 9
Table 6
The Road User Charging Scenarios Tested
Scenario Effects of
Car delayed-time reduction
Environmental improvement
Area of charge
Method of charge
1 Base 0 As now Wide Fixed charge
2 Area of charge 0 As now Small Fixed charge
3 Environmental
improvement
0 Substantial Small Fixed charge
4 Car delayed-time
reduction (mins./day)
10 Substantial Small Fixed charge
5 20 Substantial Small Fixed charge
6 30 Substantial Small Fixed charge
7 Method of charge 30 Substantial Small Distance-based
8 30 Substantial Small Time-based
9 30 Substantial Small Delay-based
Note: The charge applies all day and the revenue is allocated equally to public transport
improve-ment and tax reduction.
Explaining Variations in Public Acceptability Jaensirisaket al.
with scenario 6, the results demonstrate that fixed charges are significantly more acceptable than distance-based, time-based, and delay-based charges. There are slightly different acceptance levels for these latter three features but it is quite clear that all are highly undesirable features of a charging scheme.
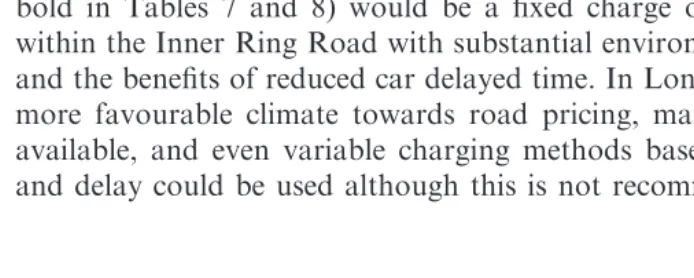
[image:24.523.21.365.62.202.2]In Leeds, the options for designing acceptable schemes are limited. The only schemes that would achieve over 50 per cent acceptance (shown in bold in Tables 7 and 8) would be a fixed charge of £3 or less per day within the Inner Ring Road with substantial environmental improvement and the benefits of reduced car delayed time. In London, where there is a more favourable climate towards road pricing, many more options are available, and even variable charging methods based on distance, time, and delay could be used although this is not recommended. The level of
Table 7
Predicted Acceptance Levels of Road User Charging Systems in Leeds
1 2 3 4 5 6 7 8 9
Level of
charge Area of
Environ-mental
Car delayed-time reduction Method of charge
(per day) Base charge improvement 10 mins 20 mins 30 mins Dist. Time Delay
£1 30.1% 45.6% 60.2% 62.2% 64.2% 66.2% 42.4% 41.4% 44.0%
£2 25.2% 39.4% 53.7% 55.8% 57.9% 60.0% 36.4% 35.7% 37.9%
£3 21.1% 33.8% 47.4% 49.4% 51.5% 53.5% 31.0% 30.2% 32.4%
£5 14.7% 24.4% 35.7% 37.5% 39.4% 41.3% 22.2% 21.6% 23.3%
£7 10.5% 17.6% 26.4% 27.9% 29.4% 30.9% 16.0% 15.5% 16.8%
Table 8
Predicted Acceptance Levels of Road User Charging Systems in London
1 2 3 4 5 6 7 8 9
Level of
charge Area of
Environ-mental
Car delayed-time reduction Method of charge
(per day) Base charge improvement 10 mins 20 mins 30 mins Dist. Time Delay
£1 53.4% 69.0% 80.1% 81.4% 82.7% 83.9% 66.1% 65.2% 67.5%
£2 49.4% 65.1% 76.9% 78.4% 79.8% 81.1% 62.2% 61.3% 63.7%
£3 45.7% 61.3% 73.5% 75.0% 76.5% 78.0% 58.3% 57.4% 59.8%
£5 39.0% 53.7% 66.2% 67.9% 69.5% 71.1% 50.9% 49.9% 52.3%
£7 33.6% 47.0% 59.0% 60.7% 62.3% 63.9% 44.4% 43.5% 45.7%
Journal of Transport Economics and Policy Volume 39, Part 2
[image:24.523.17.364.454.593.2]charge can be set at up to £5 per day,2even with variable charging methods, and can be £7 per day provided the public believe that the environment will be substantially improved. However, the systems need to be within the Inner Ring Road.
The results clearly indicate that charging is far more acceptable in London than in Leeds. However, the voting model analysis found that there was no significant difference in any of the coefficients of the model reported in Table 3 between people who live in Leeds and in London. The difference in acceptance levels is because the two samples are different in terms of relevant socio-economic characteristics and particularly atti-tudes to road pricing, congestion and pollution. For example, in Leeds the proportion of car users is higher, but the proportions who perceive transport problems to be very serious and believe charging to provide effective solutions are lower than in London.
6.0 Conclusions
There is an extensive literature on the acceptability of road pricing schemes, and the factors affecting acceptability. Among these factors are perceptions of the seriousness of the underlying problems of congestion, pollution, and danger; attitudes to the effectiveness of road pricing in overcoming these problems; image of the car and its implications for lifestyle; perceptions of freedom and fairness and concerns over possible equity implications; and, of particular importance, the use to which revenues are put. Some more limited research has been conducted into the impact of system features including the location, timing, and level of charge, exemptions available, and the complexity of the charging regime. There is also some evidence that personal characteristics and constraints influence acceptability.
However, there are a number of weaknesses in the current literature. Various definitions of acceptability have been used, but little reference has been made to respondents’ willingness to vote for a road pricing scheme. Few attempts have been made to understand the differences in acceptability between users and non-users, or to isolate the impacts of selfish and social preferences. Particularly surprisingly there has been little research into the effects of system design, and specifically of level of charge, on acceptability. Finally, it is difficult to assess, from the current evidence, the relative impact on acceptability of these different factors.
2This is the amount charged under the scheme introduced in February 2003.
Explaining Variations in Public Acceptability Jaensirisaket al.
The research reported here used a stated preference survey in Leeds and London to assess the effect on acceptability of level of charge, charge area and time period, type of charge regime, impacts on car and bus travel time, impacts on the environment, and use of revenue. It related these responses to personal characteristics including age, gender, household income, and usual mode, and to attitudes towards current levels of congestion and pollution, perceived effectiveness of charging in reducing those levels, and the principle of charging.
While road pricing was found overall to be unacceptable, some personal characteristics made it more or less so. Charging was more acceptable to non-car users, those who perceived pollution and congestion as very serious and, to a lesser extent, those who considered the current situation unacceptable, and who judged road pricing to be an effective means of reducing congestion. Conversely, older respondents were more likely to judge charging as less acceptable. Somewhat surprisingly, income did not influence acceptability. As has generally been found, attitudinal factors have a greater impact on acceptability than personal socio-economic characteristics.
Among the potential impacts of charging, an ability to achieve substantial environmental improvements was the single most important contributor to increased acceptability, followed by contributions to reducing delayed time for cars. There was a preference for using the revenue to reduce taxes, but the impact was small.
As expected, design features were found to influence acceptability, which could be increased by limiting charging to the central area and, to a lesser extent, peak periods, using cordon-based charges rather than continuous charging regimes, and imposing lower levels of charge.
Taking all these results together, it is possible to specify design combina-tions that will be voted for by the majority of the population. In London a cordon charging scheme limited to the central area, with a charge of £5 per day, would be acceptable to the majority, and a charge of £7 would be, provided that it generated substantial environmental benefits and reduc-tions in delayed time for cars. In Leeds, charge levels of £2 or £3 would be acceptable to the majority, but only given substantial environmental improvements and reductions in delay for cars.
References
Baron, J. (1995): ‘‘Blind Justice: Fairness to Groups and the Do-no-harm Principle,’’
Journal of Behavioral Decision Making, 8, 71–83.
Journal of Transport Economics and Policy Volume 39, Part 2
Bartley, B. (1995): ‘‘Mobility Impacts, Reactions and Opinions. Traffic Demand Manage-ment Options in Europe: The MIRO Project,’’Traffic Engineering and Control, 596–602. Bonsall, P., H.-J. Cho, I. Palmer, and N. Thorpe (1998): ‘‘Experiments to Determine Drivers’ Response to Road User Charges,’’Proceedings of European Transport Confer-ence: Seminar D, PTRC, UK.
Bonsall, P. and H.-J. Cho (1999): ‘‘Travellers’ Response to Uncertainty: the Particular Case of Drivers’ Response to Imprecisely Known Tolls and Charges,’’Proceedings of European Transport Conference: Seminar F, PTRC, UK.
Cain, A., N. Celikel, and P. Jones (2002): ‘‘Incorporating Public Participation into the Detailed Design of a Congestion Charging Scheme for Edinburgh,’’ Paper presented at the 34th UTSG Annual Conference, 3–5 January 2002, Transport Research Insti-tute, Napier University, Edinburgh, UK.
Collis, H. and H. Inwood (1996): ‘‘Attitudes to Road Pricing in the Bristol Area,’’Traffic Engineering and Control, 37, 580–4.
CfIT/MORI (2000):The CfIT Report: Public Attitudes to Transport in England, Commis-sion for Integrated Transport, UK (available from www.cfit.gov.uk).
CfIT/MORI (2001):The CfIT Report 2001: Public Attitudes to Transport in England, Com-mission for Integrated Transport, UK (available from www.cfit.gov.uk).
DETR (1998): Breaking the Logjam: the Government’s Consultation Paper on Fighting Traffic Congestion and Pollution through Road User and Workplace Parking Charges, Department of Environment, Transport and the Regions, UK.
Econometric Software (1999):LIMDEP 7.0 for Windows, Econometric Software Inc., New York.
Frey, B. S. (2003): ‘‘Why are Efficient Transport Policy Instruments so Seldom Used?’’ In J. Schade and B. Schlag (Eds.):Acceptability of Transport Pricing Strategies, Oxford: Elsevier, 63–76.
Giuliano, G. (1992): ‘‘An Assessment of the Political Acceptability of Congestion Pricing,’’
Transportation, 19, 335–58.
Giuliano, G. (1994): Equity and Fairness Considerations of Congestion Pricing. Curbing Gridlock: Peak-Period Fees to Relieve Traffic Congestion, Special Report 242, Volume 2, Transportation Research Board, National Research Council, USA.
GOL (2000):Road Charging Options for London: a Technical Assessment, ROCOL Report, Government Office for London, UK (available from www.go-london.gov.uk). Golob, T. F. (2001): ‘‘Joint Models of Attitude and Behaviour in Evaluation of the San
Diego I-15 Congestion Pricing Project,’’Transportation Research A, 35, 495–514. Goodwin, P. B. (1989): ‘‘The Rule of Three: a Possible Solution to the Political Problem of
Competing Objectives for Road Pricing,’’Traffic Engineering and Control, 30, 495–7. Gu¨ller, P. (2002): ‘‘The Pricing Measures Acceptance (PRIMA) Research Project of DG
Tren,’’ Paper Presented at the MC ICAM Conference on Acceptability of Transport Pricing Strategies, 23–24 May, Dresden.
HFA (1992):Road Pricing in London: Review and Specification of Demand Model Elastici-ties. Prepared for The UK Department of Transport, London.
Harrington, W., A. J. Krupnick, and A. Alberini (2001): ‘‘Overcoming Public Aversion to Congestion Pricing,’’Transportation Research Part A, 35, 87–105.
Ha˚rsman, B. (2001): ‘‘Urban Road Pricing Acceptance,’’ Paper presented at IMPRINT-EUROPE seminar, Brussels, Nov 21–22, 2001. See also www.imprint-eu.org.
Jaensirisak, S. (2002):Road User Charging: Acceptability and Effectiveness, PhD Thesis, Institute for Transport Studies, University of Leeds, UK.
Jakobsson, C., S. Fujii, and T. Ga¨rling (2000): ‘‘Determinants of Private Car Users’ Acceptance of Road Pricing,’’Transport Policy, 7, 153–8.
Explaining Variations in Public Acceptability Jaensirisaket al.
Jones, P. (1991): ‘‘Gaining Public Support for Road Pricing through a Package Approach,’’Traffic Engineering and Control, 32, 194–6.
Jones, P., T. Grosvenor, and D. Wofinden, (1996):Public Attitudes to Transport Policy and the Environment, Summary Report to the Department of Transport.
Jones, P. (1995): ‘‘Road Pricing: the Public Viewpoint,’’ In B. Johansson and L. Mattson (eds.):Road Pricing: Theory,Empirical Assessment and Policy, Kluwer Academic Pub-lishers, USA.
Jones, P. (1998): ‘‘Urban Road Pricing: Public Acceptability and Barriers to Implementa-tion,’’ In K. J. Button and E. T. Verhoef (eds.):Road Pricing,Traffic Congestion and the Environment, Edward Elgar, USA.
Langmyhr, T. (1997): ‘‘Managing Equity: The Case of Road Pricing,’’Transport Policy, 4, 25–39.
Larsen, O. I. (1988): ‘‘The Toll Ring in Bergen, Norway: The First Year of Operation,’’
Traffic Engineering and Control, 29, 216–21.
Larsen, O. I. (1995): ‘‘The Toll Cordons in Norway: an Overview,’’Journal of Transport Geography, 3, 187–97.
Luk, J. and E. Chung (1997): Public Acceptance and Technologies for Road Pricing, Research Report (ARR 307), ARRB Transport Research Ltd, Australia.
May, A. D. (1975): ‘‘Supplement Licensing: an Evaluation,’’ Traffic Engineering and Control, 16.
May, A. D. (1992): ‘‘Road Pricing: an International Perspective,’’Transportation, 19, 313– 33.
Ministry of Transport (1964): Road Pricing: The Economic and Technical Possibilities, HMSO: London.
NCSR (2000):British Social Attitudes: the 17th Report 2000, National Centre for Social Research, Sage Publication, UK.
NEDO (1991):A Road User Charge? Londoners’ View, National Economic Development Office, UK.
Nilsson, M. and R. Kuller (2000): ‘‘Travel Behaviour and Environmental Concern,’’
Transportation Research Part D, 5, 211–34.
Norwegian Public Roads Administration (1999):Bompengeringen. Holdningsundersøkelse 1989–1998. PROSAM Report 59, Oslo.
Odeck, J. and S. Brathen (1997): ‘‘On Public Attitudes Toward Implementation of Toll Roads – the Case of Oslo Toll Ring,’’Transport Policy, 4, 73–83.
PATS Consortium (2001):Recommendations on Transport Pricing Strategies, Final Report of the PATS Project. European Commission, Brussels. See also www.tis.pt/proj/pats/ pats.html.
Pigou, A. C. (1920):Wealth and Welfare, MacMillan, UK.
Rienstra, S. A., P. Rietveld, and E. T. Verhoef (1999): ‘‘The Social Support for Policy Measures in Passenger Transport. A Statistical Analysis for the Netherlands,’’ Trans-portation Research D, 181–200.
Rietveld, P. and E. T. Verhoef (1998): ‘‘Social Feasibility of Policies to Reduce External-ities in Transport,’’ In K. J. Button and E. T. Verhoef (eds.): Road Pricing, Traffic Congestion and the Environment, Edward Elgar, USA.
Schade, J. and B. Schlag (2000): Acceptability of Urban Transport Pricing, Research Report 72, Government Institute for Economic Research, Helsinki.
Schlag, B. and J. Schade (2000): ‘‘Public Acceptability of Traffic Demand Management and Pricing Measures in Europe,’’Traffic Engineering and Control, 41, 314–8.
Schlag, B. and U. Teubel (1997): ‘‘Public Acceptability of Transport Pricing,’’IATSS Research, 21, 134–42.
Journal of Transport Economics and Policy Volume 39, Part 2
Sheldon, R., M. Scott, and P. Jones (1993): ‘‘London Congestion Charging: Exploratory Social Research Among London Residents,’’Proceedings 21st PTRC Summer Annual Meeting: Seminar L, 129–45.
Small, K. A. (1992): ‘‘Using the Revenues from Congestion Pricing,’’Transportation, 19, 359–81.
Stokes, G. and B. Taylor (1995): ‘‘The Public Acceptability of Sustainable Transport Policies: Finding from the British Social Attitudes Survey,’’Proceedings 23rd European Transport Forum: Seminar C, 69–83, PTRC, UK.
Taylor, B. and L. Brook (1998): ‘‘Public Attitudes to Transport Issues: Findings from the British Social Attitudes Surveys,’’ In D. Banister (ed.): Transport Policy and the Environment, E&FN SPON, UK.
Teubel, K. (1997): ‘‘Verteilungswirkungen von Straßenbenutzungsgebu¨hren in einem Sta¨dtischen Ballungsraum,’’Internationales Verkehrswesen, 49, 97–103.
Thorpe, N., P. Hills, and S. Jaensirisak (2000): ‘‘Public Attitudes to TDM Measures: A Comparative Study,’’Transport Policy, 7, 243–57.
Tretvik, T. (2003): ‘‘Urban Road Pricing in Norway: Public Acceptability and Travel Behaviour,’’ In J. Schade and B. Schlag (eds.): Acceptability of Transport Pricing Strategies. Oxford: Elsevier.
Van der Loop, J. T. A. and I. H. Veling (1994): ‘‘Developments in the Acceptance of the Transport Structure Plan by the Dutch Population and how to Increase the Acceptance of Measures,’’Proceedings 22nd PTRC Summer Annual Meeting: Seminar D, 125–34. Verhoef, E. T., P. Nijkamp, and P. Rietveld (1997): ‘‘The Social Feasibility of Road
Pricing: a Case Study for the Randstad Area,’’ Journal of Transport Economics and Policy, 31, 255–76.
Vickrey, W. (1955): ‘‘Some Implications of Marginal Cost Pricing for Public Utilities,’’
American Economic Review, 45, 605–20.
Walters, A. (1954): ‘‘Track Costs and Motor Taxation,’’Journal of Industrial Economics, 2, 135–46.
Explaining Variations in Public Acceptability Jaensirisaket al.