2(1): 24-42, 2014, Article no. OR.2014.004 SCIENCEDOMAINinternational
www.sciencedomain.org
Perimetry Comparisons for Octopus G Top and
Dynamic Programmes versus Humphrey 24-2
SITA Fast and SITA Standard Programmes
Fiona J. Rowe
1*, Manijeh Wishart
2and Sarah Spencer
21Department of Health Services Research, University of Liverpool, Liverpool L69 3GB,
England.
2Department of Ophthalmology, Warrington and Haltom Hospitals NHS Foundation Trust,
Warrington WA5 1QC, England.
Authors’ contributions
This work was carried out in collaboration between all authors. Author FJR designed the study, performed the statistical analysis, wrote the protocol, and wrote the drafts of the manuscript. Author MW provided oversight for the study and contributed to the drafts of the manuscript. Author SS managed the recruitment and data collection for the study. All authors read and approved the final manuscript.
Received 23rdSeptember 2013 Accepted 18thOctober 2013
Published 8thNovember 2013
ABSTRACT
Aims: Previous comparisons of Octopus and Humphrey threshold programmes have shown differences, particularly for depth of defects. Recent developments have altered the Octopus background illumination. Thus, we sought to determine the subsequent extent of differences in results from commonly used central static programmes using Octopus and Humphrey perimeters.
Study Design:Diagnostic accuracy study.
Place and Duration of Study: Department of Ophthalmology, Warrington and Halton Hospitals NHS Foundation Trust, between June 2009 and July 2012.
Methodology: We utilised Octopus G-TOP or G-dynamic programmes and Humphrey 24-2 SITA fast or standard programmes. Poor reliability was taken as errors >25%. Comparison was made for global indices (mean sensitivity, mean deviation, pattern standard deviation/loss variance), test duration from each perimeter using unpaired t tests, and Bland Altman plots for correlation of individual differences between perimeters. Clinical agreement for presence/absence of visual field loss was determined by
independent assessment of results by two authors (kappa test).
Results: Eighty patients (159 eyes) were recruited. 38 eyes were excluded due to poor reliability. 34 patients (55 eyes) underwent fast static visual field assessment: 17 males and 17 females with a mean age of 63 years (SD 14). 38 patients (64 eyes) underwent standard static visual field assessment: 18 males and 20 females with a mean age of 65 years (SD 13). For both full and fast perimetry, both perimeters showed good agreement for inter observer comparison (K=0.5-0.6). SITA standard perimetry showed a higher mean sensitivity value (+2.5dB±1.0) and SITA fast perimetry showed a higher mean sensitivity value (+3.4dB±1.1) than Octopus values. Bland-Altman analysis showed increasing variability with increasing severity of defect indicating a lack of correlation for moderate to severe visual field results.
Conclusions: Visual field results were comparable for mild defects. Octopus perimetry continues to show greater defect size where there is more extensive visual field loss relating to the different strategies used by both perimeters.
Keywords: Octopus; Humphrey; G programme; 24-2 programme; threshold perimetry.
1. INTRODUCTION
Visual field assessment is an important clinical tool in the assessment of patients with acute and chronic ocular and/or neurological diseases. Automated static visual field assessment has been undertaken since the 1970’s using Humphrey and Octopus perimeters, with both perimeters undergoing extensive hardware and software upgrades over the past two decades.
The literature reports a number of comparisons of Humphrey and Octopus automated static perimetry using various programme strategies. Comparisons of fast versus slow threshold strategies have been undertaken to evaluate whether an altered strategy that significantly reduces test time loses detection sensitivity [1-5]. Comparisons of Humphrey SITA fast (SF) with SITA standard (SS) have been shown to have excellent sensitivity and specificity for glaucomatous visual field loss with significantly faster test durations for SF [6]. Scherrer and colleagues [7] compared the results of Octopus tendency oriented perimetry (TOP) versus dynamic strategies and found the faster test strategy also provided accurate and reliable results.
Again, the authors converted the Humphrey values taking into account the differences between the Humphrey and Octopus luminance values. Following conversion a good correlation was achieved.
Furthermore, differences between perimeters may also be due to the method in which the test programme is undertaken. A stair step or bracketing process is used for Humphrey central threshold strategies. Initially four points are tested in order to determine the threshold level at those points which are then used as a starting level for neighboring points and so on until the entire visual field has been completed. Points are tested twice where the anticipated response is outside 5 decibels of that expected and the second response obtained is bracketed on the final printout of results [11]. For full threshold testing, a 4-2 decibel step bracketing process is used. The fastpac strategy uses a 3-1 bracketing process which speeds up the test. Octopus TOP is a systematic method that assesses the thresholds of neighbouring points by interpolation [12]. However, boundary edges of visual field defects are slightly rounded as a result and thus the tendency is to give shallower field defects than with Humphrey [12]. For the dynamic test strategy, step sizes adapt to the slope of the frequency of seeing curve using a bracketing process of 2dB to 10dB [12].
Langorhorst [13] reported that the dynamic strategy showed more mild defects than on SS. However, with early or moderate defects, Octopus indicated a higher local defect value. Langorhorst postulated that this difference may relate to fluctuations of thresholds in areas of relative local defects in glaucoma patients. Octopus dynamic strategy determines the threshold value after the threshold has been crossed only once. SS is more complicated in its estimation of threshold based on comparison to normative data, intratest responses and neighbouring responses. For more severe field defects, Octopus showed less deep defects than SS which may be due to determination of defect depth by large threshold step sizes.
In recent years, Octopus perimetry has undergone further development culminating in the release of the Octopus 900 perimeter which combines static and kinetic operation modes. The Octopus now operates at the same background illumination as Humphrey perimetry for static visual field assessment. In this study, we sought to determine what differences persist between the Octopus and Humphrey perimeters given the, now, same background illumination for both perimeters and utilising commonly used and previously compared threshold strategies on Humphrey and Octopus static perimetry: SITA-standard (SS) or SITA-fast (SF) and G-dynamic (GD) or G-Tendency Oriented Perimetry (G-TOP) respectively.
2. MATERIALS AND METHODS
A prospective cohort study for diagnostic evaluation was undertaken in accordance with the Tenets of the Declaration of Helsinki. Institutional Research and Development unit approval was obtained.
2.1 Patients
Participants were not pre-selected for the study but were identified randomly, i.e. notes were taken consecutively from the list waiting for visual field assessment without prior knowledge of patient ability and cognition. A selection bias existed in that the patients recruited to this study had been booked to an out-patient visual field clinic for static perimetry. Thus, there was an assumption that these patients had sufficient ability and cognition to undertake standard automated perimetry. We did not exclude patients with other ocular pathology such as cataract or external eye disease. We excluded children under the age of 18 years but did not set an upper age limit. We excluded patients who had visual acuity worse than 6/36 Snellen or 0.8 logMAR who were unable to view the central perimetry fixation target.
2.2 Visual Field Protocol
The 24-2 programme was utilised on Humphrey perimetry as this programme is the standard choice in our clinics for visual field assessment requiring threshold evaluation. This programme consists of 54 stimulus locations offset from the vertical and horizontal meridia and interspaced by 6 degree intervals. The programme assesses the visual field out to 30 degrees nasally and out to 24 degrees superiorly, inferiorly and temporally. The background illumination is set at 31.5asp.
For 24-2 programme full threshold testing, the stimulus intensity is increased in 4 decibel steps until recorded and then decreased to below the threshold level and increased again until recorded, in 2 decibel steps, to confirm the threshold level at that point. The 24-2 fastpac strategy for threshold testing determines threshold sensitivity in 3 decibel steps, thus speeding up the test process. The Swedish Interactive Thresholding Algorithm (SITA) considers many factors in determining what stimuli to present at each point during the test. These factors include age, normative data, detailed characteristics of abnormal and normal tests and patient responses so far in the test. They are combined and weighted into the SITA visual field model which continually produces updated calculations of the threshold at each point.
The G programme was utilised on Octopus 900 perimetry (Haag Streit International, Switzerland) as this programme is advised for general threshold evaluation of the visual field. This programme consists of 59 stimulus locations offset from the vertical and horizontal meridia and which assess a 30 degree visual field area. The test is a physiology related test pattern that offers a higher density of stimuli in the centre (interspaced at 2.8 degrees). Distribution of test locations follow the nerve fibre bundle layer to allow improved correlation of functional and structural results. Background illumination is set at 31.4asp.
The Octopus TOP method takes into account that the threshold values of neighbouring locations are correlated. It assesses the thresholds of neighbouring points by interpolation. During the test every answer at a particular point is also taken into account in the adjustments of the neighbouring locations [12]. However, abrupt edges are slightly rounded as a result and thus the tendency is to give shallower field defects than with Humphrey [12]. For the dynamic test strategy, step sizes adapt to the slope of the frequency of seeing curve. With increased depth of defect the stimulus luminance step size increases from 2dB to 10dB. The final measured value is calculated as the mean between the two last stimuli [12]. The threshold is only crossed once and all locations are subsequently retested in a second phase.
on the same day. The order of testing was randomised as to which of the two assessment types was used first in order to take fatigue effect in to consideration. A short break of 5-10 minutes was allowed between testing on either perimeter. Randomisation was not undertaken using a computer generated table. Patients were assigned to one perimeter or another according to which perimeter was available for use at the time the patient was called for assessment. Inclusion criteria were adult patients attending for visual field assessment, able to sit at the perimeter unaided, able to press the response button, able to understand and follow instructions for performing the test. The exclusion criteria were patients who were unable to sit for the duration of perimetry assessment, follow instructions for performing the test or too ill to complete the full assessment. All patients were provided with full explanation of the purpose of the test and procedure prior to undertaking any perimetry exmination. After explanation, patients were given the choice to opt out if they chose (for example if the Humphrey visual field test was performed first and it was of a particularly long duration). However, in practice, very few patients declined to take part in the study.
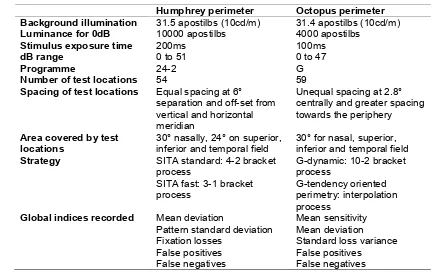
Table 1. Humphrey and Octopus programme specifications
Humphrey perimeter Octopus perimeter Background illumination 31.5 apostilbs (10cd/m) 31.4 apostilbs (10cd/m) Luminance for 0dB 10000 apostilbs 4000 apostilbs
Stimulus exposure time 200ms 100ms
dB range 0 to 51 0 to 47
Programme 24-2 G
Number of test locations 54 59
Spacing of test locations Equal spacing at 6° separation and off-set from vertical and horizontal meridian
Unequal spacing at 2.8° centrally and greater spacing towards the periphery
Area covered by test
locations 30° nasally, 24° on superior,inferior and temporal field 30° for nasal, superior,inferior and temporal field Strategy SITA standard: 4-2 bracket
process
SITA fast: 3-1 bracket process
G-dynamic: 10-2 bracket process
G-tendency oriented perimetry: interpolation process
Global indices recorded Mean deviation
Pattern standard deviation Fixation losses
False positives False negatives
Mean sensitivity Mean deviation Standard loss variance False positives
False negatives
2.3 Comparison of Results and Analysis
We analysed the results from each eye of patients (where available). As our study is of diagnostic accuracy and, as visual field loss can affect each eye to quite different extents, we wished to compare the accuracy of each perimeter programme to detect the same type and location of field loss.
perimetry. Poor reliability was deemed present with fixation losses of >25% and false positive and negative responses of >25% [9].
In order to determine clinical agreement for the two perimeters, qualitative comparisons of the visual fields were carried out by two authors (FR, MW) for inter observer agreement. The criteria for abnormality on Octopus perimetry included:
• MD>2dB and/or sLV value of >6dB
• ≥3 contiguous points <5dB forming a focal defect • A combination of the above two
The criteria for abnormality on Humphrey perimetry included:
• MD>2dB and/or PSD value of >6dB
• ≥3 contiguous points at p<5% forming a focal defect • Glaucoma hemifield test outside normal limits • A combination of any two of the above
Visual field results in both groups were assessed as binary responses for presence or absence of visual field defects (normal or abnormal) and for the latter, were further assessed for type of visual field defect (glaucoma or neurological). One author assessed the results of Octopus perimetry (FR) and the second author assessed the results of Goldmann perimetry (MW). A ‘match’ between perimeters was subsequently determined as ‘Yes/No’ for presence of defect.
A score of visual field defect size and severity was generated for all results as described by King et al. [9]. For defect size, significantly depressed points (<1% and <0.5%) on the total deviation and pattern deviation plots were counted and summed. A percentage score was obtained by dividing the sum by 52 (number of points on Humphrey probability plots) and by 59 (number of points on Octopus probability plots). For calculation of the defect severity each abnormal point on the total deviation and pattern deviation plots was assigned a defect score: 1 for <5%, 2 for <2%, 3 for <1% and 4 for <0.5%. All point scores were counted and summed. A percentage severity score was obtained by dividing the sum by the maximum score possible (208 on Humphrey perimetry: 52 points x4; 236 on Octopus perimetry: 59 points x4).
The mean deviation on Octopus perimetry is recorded as a positive value but may be positive or negative on Humphrey results. Therefore the Humphrey results were multiplied by -1 to yield a positive value for statistical analysis[9]. Values for global indices (mean deviation (MD), pattern standard deviation (PSD)/loss variance (sLV)) were taken for direct comparison as were values of mean sensitivity (MS). MS was automatically calculated on Octopus results. However, this was manually calculated for Humphrey perimetry as the mean of the sum of all calculated threshold points.
Bland-Altman strategy (Graphpad) was used to compare the differences between two independent measurements for global indices versus the average of both. When analysing the Bland-Altman results, we expected most of the differences to lie within ±1.96SD if normally distributed. Provided the differences within ±1.96SD would not be clinically important, we considered that the two results of both methods could be considered as similar. We therefore set a clinical cut-off as to what difference we would regard as clinically acceptable.
In order to determine clinical significance of differences between Octopus and Humphrey perimetry results, we determined that a departure of >5dB on MS would be significant. This cut-off was based on the static perimetry programming that threshold values exceeding 5dB from age-expected values, are automatically re-tested. We determined our cut-off as 2.5dB for a clinically significant departure for MD and PSD.
Kappa (K, SPSS) evaluation of agreement was used to correct the proportion of agreement between perimeters due to chance when evaluating intraobserver interpretation of visual field results. K values range from 0 to 1. A K value of 1 was defined as perfect agreement and a value of >0.7 was deemed a strong agreement [14].
3. RESULTS AND DISCUSSION
Eighty patients (159 eyes) were recruited to this study with equal division of 40 patients across two groups. The visual field results were first evaluated for reliability to exclude results that exceeded the cut-off of >25% errors. Of 159 visual field results, 38 were excluded with 121 visual field results suitable for analysis.
3.1 Octopus G-TOP versus Humphrey SITA fast 24-2 Perimetry
Group a consisted of 34 patients (55 eyes) undergoing Humphrey 24-2 SF versus Octopus G-TOP perimetry. There were 17 males and 17 females with a mean age of 63 years (SD 14: range 29-89).
3.1.1 Comparison of visual field indices
The mean values for MS, MD, sLV/PSD and duration of test are shown in Table 2. There is a significant difference between G-TOP and SF results for MS with a difference between means of -3.4±1.1, p=0.004 (unpaired t test) and mean higher values for SF results. There is no significant difference between G-TOP and SF results for MD (p=0.516), sLV/PSD (p=0.579) and test duration (p=0.107) with a difference between means of 0.71±1.1, -0.34±0.61 and 0.04±0.22 respectively.
Bland-Altman analysis (Fig. 1) shows a wide distribution of differences for MS differences for G-TOP and SF results with variability across comparisons. Despite no significant differences for MD, sLV/PSD and test duration, Bland-Altman analysis shows increasing variability in comparisons with increasing average values.
3.1.2 Comparison of defect size and severity
for defect size on total deviation plots with a difference between means of -25.16±5.87, p=0.001 (unpaired t test) and mean higher values for G-TOP results. There is also a significant difference between G-TOP and SF results for defect size on pattern deviation plots with a difference between means of -8.07±3.93, p=0.043 (unpaired t test) with mean higher values for G-TOP results. There is no significant difference between G-TOP and SF results for defect severity on either total deviation (p=0.06) and pattern deviation (p=0.97) plots with a difference between means of -10.85±8.69 and -0.11±3.84 respectively.
Table 2. G-TOP and SITA-fast 24-2 mean values: visual field indices
G-TOP SF 24-2
Mean SD Mean SD
MS vs MS
(dB) 21.73 6.10 25.09 5.80
MD vs MD
(dB) 5.27 5.54 4.57 5.81
sLV vs PSD 3.96 2.50 4.30 3.80
Test duration
(minutes) 3.35 1.29 3.71 1.02
MS: mean sensitivity; dB: decibel; MD: mean deviation; sLV: standard loss variance PSD: pattern standard deviation; SD: standard deviation
A: Mean sensitivity differences
Bland-Altman:Difference vs average
10 20 30 40
-12.5 -10.0 -7.5 -5.0 -2.5 0.0
2.5 Difference
Average
G
TO
P
- S
F2
4-2
B: Mean deviation differences
Bland-Altman:Difference vs average
5 10 15 20 25 30
-5.5 -3.0 -0.5 2.0 4.5
7.0 Difference
Average
G
TO
P
- S
F2
4-2
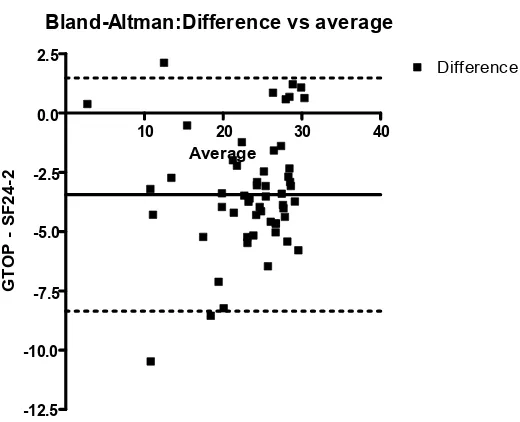
The solid line represents the mean bias of +0.706 with a lower mean MD from SF 24-2 results compared to G-TOP results. The dotted lines represent ±1.96SD (-3.68 to 5.09). At low values there is good agreement between both measures but greater variability at increasing differences between both measures with differences exceeding a cut-off for clinical significance of ±2.5dB.
C: Loss variance versus Pattern standard deviation differences
Bland-Altman:Difference vs average
2.5 5.0 7.5 10.0 12.5 15.0
-7.5 -5.0 -2.5 0.0 2.5
Difference
Average
G
TO
P
- S
F2
4-2
D: Test duration differences Bland-Altman:Difference vs average
1 2 3 4 5 6 7 8
-7.5 -6.0 -4.5 -3.0 -1.5 0.0 1.5 3.0 4.5 6.0
7.5 Difference
Average
G
TO
P
- S
F2
4-2
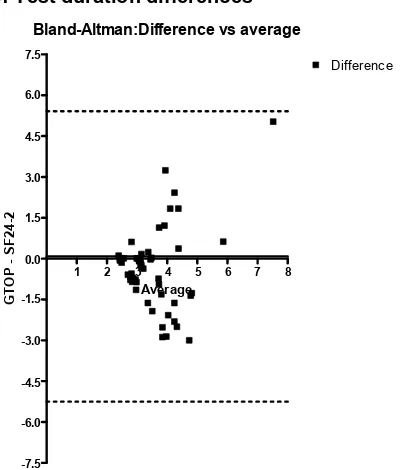
[image:10.612.107.313.109.344.2]The solid line represents the mean bias of -0.362 with a higher mean test duration for SF 24-2 compared to G-TOP. The dotted lines represent LoA ±1.96SD (-3.23 to 2.50). Variability increases with longer test duration averages.
Fig. 1. Bland-Altman analysis of G-TOP versus SF 24-2 results
Table 3. G-TOP and SITA-fast 24-2 mean values: Defect size and severity
G-TOP SF 24-2
Mean SD Mean SD
Total deviation plot
Defect size 47.03 4.40 21.87 3.89
Total deviation plot
Defect severity 36.52 4.24 25.67 3.80
Pattern deviation plot
Defect size 24.39 2.85 16.33 2.71
Pattern deviation plot
Defect severity 19.17 2.79 19.06 2.63
3.1.3 Comparison of inter observer agreement
[image:10.612.95.516.440.560.2]3.2 Octopus G-dynamic Versus Humphrey SITA Standard 24-2 Perimetry
Group b consisted of 38 patients (64 eyes) undergoing Humphrey 24-2 SS versus Octopus GD perimetry. There were 18 males and 20 females with a mean age of 65 years (SD 13: range 23-81).
3.2.1 Comparison of visual field indices
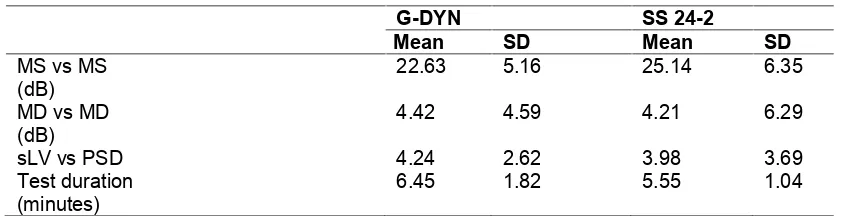
The mean values for MS, MD, sLV/PSD and duration of test are shown in Table 4. There is a significant difference between GD and SS results for MS with a difference between means of -2.5±1.0, p=0.015 (unpaired t test) and mean higher values for SS results. There is also a significant difference for test duration with a difference between means of +0.89±0.26, p=0.001 (unpaired t test) and mean longer durations for GD results. There is no significant difference between GD and SS results for MD (p=0.828) and sLV/PSD (p=0.648) with a difference between means of +0.21±0.97 and +0.26±0.57 respectively.
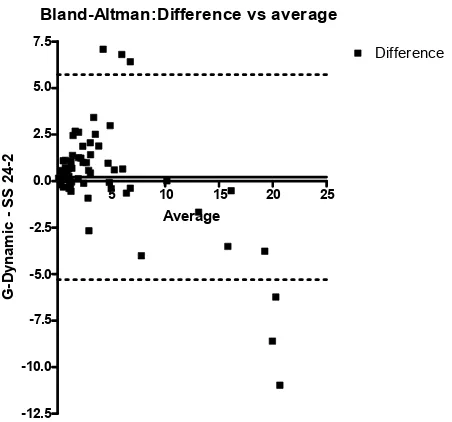
[image:11.612.96.518.377.485.2]Bland-Altman analysis (Fig. 2) shows no correlation between MS differences for GD and SS results with variability across comparisons but with increasing variability for test duration with longer test times. Despite no significant differences for MD and sLV/PSD, Bland-Altman analysis shows increasing proportional variability in comparisons with increasing average values.
Table 4. G-dynamic and SITA-standard 24-2 mean values
G-DYN SS 24-2
Mean SD Mean SD
MS vs MS
(dB) 22.63 5.16 25.14 6.35
MD vs MD
(dB) 4.42 4.59 4.21 6.29
sLV vs PSD 4.24 2.62 3.98 3.69
Test duration
(minutes) 6.45 1.82 5.55 1.04
MS: mean sensitivity; dB: decibel; MD: mean deviation; sLV: standard loss variance PSD: pattern standard deviation; SD: standard deviation
3.2.2 Comparison of defect size and severity
A: Mean sensitivity differences
Bland-Altman:Difference vs average
10 20 30 40
-10.0 -7.5 -5.0 -2.5 0.0 2.5 5.0 7.5
10.0 Difference
Average
G
-D
yn
am
ic
-
SS
2
4-2
The solid line represents the mean bias of -2.519 with a higher mean MS from SS 24-2 results compared to G-Dyn results. The dotted lines represent limits of agreement (LoA) ±1.96SD (-7.77 to 2.73). There is no consistent bias between mean sensitivities with variability noted across all comparisons. The LoA are within ±5dB from the mean bias suggesting that the differences are not clinically significant.
B: Mean deviation differences
Bland-Altman:Difference vs average
5 10 15 20 25
-12.5 -10.0 -7.5 -5.0 -2.5 0.0 2.5 5.0 7.5
Difference
Average
G
-D
yn
am
ic
-
SS
2
4-2
C: Loss variance versus Pattern standard deviation differences Bland-Altman:Difference vs average
5 10 15 20 25
-12.5 -10.0 -7.5 -5.0 -2.5 0.0 2.5 5.0 7.5
Difference
Average
G
-D
yn
am
ic
-
SS
2
4-2
The solid line represents the mean bias of +0.259 with a lower mean PSD from SS 24-2 results compared to the mean sLV on G-Dyn results. The dotted lines represent LoA ±1.96SD (-3.22 to 3.74). There is a proportional response with an increase in variability as the difference from average comparison of sLV and PSD values increases. At low and high values, most differences are within a cut-off for clinical significance of ±2.5dB. However, some differences exceed the cut-off.
D: Test duration differences
Bland-Altman:Difference vs average
5 6 7 8 9 10 11 12
-4.0 -2.5 -1.0 0.5 2.0 3.5 5.0 6.5 8.0 9.5
Difference
Average
G
-D
yn
am
ic
-
SS
2
4-2
[image:13.612.196.422.118.329.2]The solid line represents the mean bias of +0.892 with a lower mean test duration for SS 24-2 compared to G-Dyn. The dotted lines represent LoA ±1.96SD (-2.48 to 4.26). Variability increases with longer test duration averages.
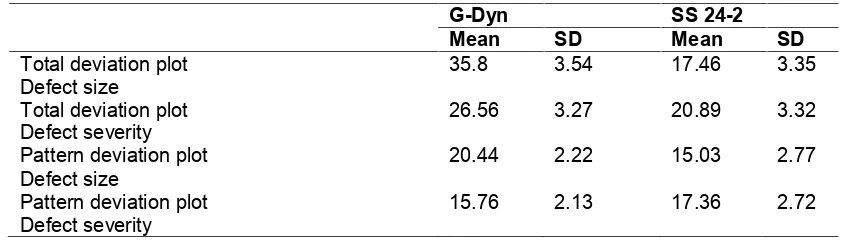
Table 5. G-Dyn and SITA-standard 24-2 mean values: defect size and severity
G-Dyn SS 24-2
Mean SD Mean SD
Total deviation plot
Defect size 35.8 3.54 17.46 3.35
Total deviation plot
Defect severity 26.56 3.27 20.89 3.32
Pattern deviation plot
Defect size 20.44 2.22 15.03 2.77
Pattern deviation plot
Defect severity 15.76 2.13 17.36 2.72
3.2.3 Comparison of inter observer agreement
Intra-observer evaluation of presence or absence of visual field defect was found to be substantial (K=0.6). Five GD results were classed as abnormal by examiner 1 (FR) where corresponding SS results were classed as normal by examiner 2 (MW). Six SS results were classed as abnormal by examiner 2 where corresponding GD results were classified as normal by examiner 1. The remaining 53 sets of results were equally classed as normal or abnormal by both examiners.
This study has aimed to compare two different strategies commonly used for general assessment of static perimetry of the central visual field: the 24-2 programme versus the G programme. Our comparison of SF and G-TOP results and SS and GD results found a significant difference for MS with Humphrey perimetry values being on average 3.4dB higher for SF and 2.5dB higher for SS. Our findings are comparable to previous studies reporting differences in mean sensitivity. Humphrey perimetry has a higher maximum stimulus luminance (range up to 51dB) compared to Octopus perimetry (range up to 47dB) and as a result the normal values are higher by 3-4dB compared to Octopus perimetry [12]. Table 1 shows a comparison of Octopus 900 and Humphrey parameters.
MS is automatically calculated on Octopus 900 results whereas it is not provided as a value on Humphrey perimetry. Therefore, we sought to evaluate the values that would be immediately available for comparison including the MD and PSD/sLV. A number of explanations have previously been suggested for the differences found for MD and PSD/sLV at higher value differences which include the number, location and weighting of test locations within the different programmes, the strategy used for each programme (bracketing versus tendency-oriented) and differences in background illumination for each perimeter. The latter explanation can be removed for this study as both Humphrey and Octopus perimeters operated at the same background illumination. Thus the differences reported in past literature have been minimized. We did not have to convert our Humphrey values for direct comparison and found no significant difference between MD and PSD/sLV on initial statistical analysis comparing overall MD and PSD/sLV values.
Thus for normal visual field results or results with slight visual field impairment, results were similar. However, for higher values, results from both perimeters were considerably different.
The same was found for PSD/sLV measurements in that a proportional agreement was found on Bland Altman analysis. At low values, differences largely fell within the clinically acceptable difference of 2.5dB but not with higher value differences. This was further shown for G-TOP as there was a significant difference for defect size on pattern deviation plots with mean higher values for G-TOP.
It is important to consider the alternative explanations to explain the differences found between both perimeters including the number, location and weighting of test locations within the different programmes plus the strategy used for each programme (bracketing versus tendency-oriented).
The 24-2 and G programmes are both assessments within the central 30 degree visual field but the 24-2 programme only extends to 30 degrees nasally and extends to 24 degrees for inferior, superior and temporal visual field. Conversely, the G programme extends out to 30 degrees in all areas of the visual field. The more extensive peripheral assessment of visual field by the G programme may partly explain the significant difference between programmes in the presence of more severe visual field loss as the G programme may pick up larger defects in more advanced ocular disease.
The 24-2 and G programmes also have different patterns of stimulus location. The 24-2 programme has equal spacing between stimuli which are located 6 degrees apart. The G programme has a greater concentration of stimuli in the central 10 degrees of visual field and less towards the outer 30 degrees. These stimuli follow arrangements to mirror nerve fibre bundle pathways. The Octopus mean defect is the average of the total deviation values in the field test. The more important and less variable deviations are near the centre of the field and are weighted more than those at the periphery [12]. Humphrey MD is the overall departure of the average deviation of the visual field result from that expected of a normal field of the same age group. It is derived from the results of the total deviation plot and is the weighted mean of all numbers in the plot which are the deviation from the average normal values for age [11]. Each deviation from normal is weighted according to the variance of normal values at that location. Therefore points with low variance closer to fixation are more important than points with higher variance more peripherally.
The Octopus loss variance is the local heterogeneity of a defect. It is small in fields with generalized damage and increased with the number of depth of localized scotomas [12]. The Humphrey PSD is a global index that measures the degree to which the shape of the patient’s field departs from normal age-corrected reference field model. It is determined by variation from the normal hill of vision. A normal hill of vision will give a low PSD as will a generalized elevation or depression of sensitivity across the entire visual field. Areas of focal loss of vision give rise to higher PSD values [11]. It is possible that the differences in weighting of these calculations give rise to the variances seen with greater magnitudes of defect. Funkhouser & Fankhauser [15] previously reported that unweighted and fluctuation-weighted indices measured by Octopus perimetery show negligible differences for the G1 programme.
to the slope of the frequency of seeing curve [12]. However, Octopus TOP does not use a bracketing process but assesses the thresholds of neighbouring points by interpolation, i.e. it uses the subject’s response at each point to estimate the sensitivity at that point but also to contribute to the sensitivity estimation at neighbouring points [12].
Langorhorst [13] reported that the dynamic strategy showed more mild defects than on SS. However, with early or moderate defects, Octopus indicated a higher local defect value. Langorhorst postulated that this difference may relate to fluctuations of thresholds in areas of relative local defects in glaucoma patients. Octopus dynamic strategy determines the threshold value after the threshold has been crossed only once. SS is more complicated in its estimation of threshold based on comparison to normative data, intratest responses and neighbouring responses. For more severe field defects, Octopus showed deeper defects than SS which may be due to determination of defect depth by large threshold step sizes. Similar differences have been noted when utilizing the TOP strategy with under-estimation of sLV in comparison to traditional bracketing processes [1]. Anderson reported poor spatial resolution characteristics for TOP with the depth of defect typically over-estimated and with blurring of defect boundaries due to the use of linear interpolation between test locations [16].
In addition to our comparisons of global indices and test duration, we evaluated inter-observer variances. Using a similar method, King and colleagues [9] reported a very high level of clinical agreement between two investigators in judging their results as normal or glaucoma. They suggested that this high agreement indicated the identical qualitative similarity between assessments in a clinical environment. Our comparison of inter-observer differences was found to be moderate on Kappa analysis for G-TOP versus SF and substantial agreement for GD and SS. Our interobserver disagreement was higher than that reported by King et al. This is unlikely to relate to a greater familiarity with either the Octopus 900 or Humphrey perimeters as a similar number of normal/abnormal results were found for Octopus versus Humphrey perimetry results as determined independently by two of the authors. It is more likely that the disagreements related to the different representations of results given the different testing strategies used for 24-2 or G programmes. Each author used pre-specified criteria to determine the presence or absence of visual field loss as outlined in section 2.3. Classic patterns of visual field loss were noted using both perimeters such as nasal step, arcuate defects, and scotoma defects. We classified our results as normal or abnormal and, for the latter, as glaucoma or neurological pattern. We did not further evaluate these results for patterns of visual field loss and acknowledge this as a potential limitation.
Duration of perimetry testing is an important aspect of achieving accurate and reliable visual field results. An excessive period of test duration can give rise to increased variability and fatigue-related defects. G-TOP was found to have a significantly quicker test time in the study by King et al. [9] whereas there was no significant difference in duration of test in our study for SF versus G-TOP. A further study compared SS 30-2 with Octopus 101 32 dynamic programme [13]. The test time was comparable but the Octopus strategy took less time for more severe defects. This was also found in our study for GD versus SS. It is important to consider the trade-off between faster test duration and accuracy and reliability of the visual field result.
outlines advantages and disadvantages of each perimeter. With consideration to the clinical use of these perimeters, it should be noted that MS for the Humphrey perimeter remains consistently higher than the Octopus 900 perimeter for both standard and fast strategies. Mean deviation and PSD/sLV, which overall did not appear to differ significantly, did show significant differences when analysed for increasing severity of visual field loss. Thus, clinically, these differences mean that both perimeters should be used independently and not interchangeably.
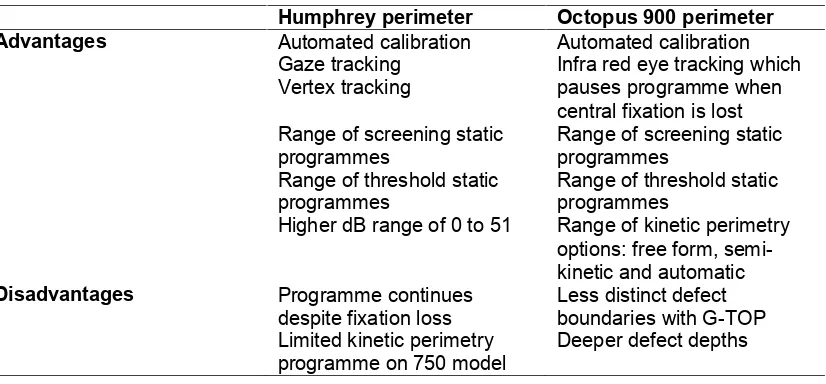
Table 6. Advantages and disadvantages of Octopus 900 and Humphrey perimeters
Humphrey perimeter Octopus 900 perimeter Advantages Automated calibration
Gaze tracking Vertex tracking
Range of screening static programmes
Range of threshold static programmes
Higher dB range of 0 to 51
Automated calibration Infra red eye tracking which pauses programme when central fixation is lost Range of screening static programmes
Range of threshold static programmes
Range of kinetic perimetry options: free form, semi-kinetic and automatic Disadvantages Programme continues
despite fixation loss Limited kinetic perimetry programme on 750 model
Less distinct defect boundaries with G-TOP Deeper defect depths
4. CONCLUSION
Following comparison for detection of global or localised visual field deficit and quantitative evaluations of global indices and defect size and severity, moderate to substantial inter-observer agreement was found, and visual field results showed similar results for normal or mildly affected visual fields. Although there were no significant differences on overall analysis of MD and PSD/sLV when sub-analysed for defect severity, greater deficits were recorded for Octopus perimetry in more severely affected visual fields. Thus, despite both perimeters operating the same background illuminations, differences persist and particularly for moderate to severe visual field loss. This relates to test programmes (locations and density of stimuli) and test strategy (conventional 4-2 and 3-1 bracketing steps versus variable 2 to 10 bracketing steps or interpolation process). Clinically it is important to understand the different strategies and programme designs across various perimeter models and acknowledge inter-perimeter differences.
CONSENT
ETHICAL APPROVAL
All authors hereby declare that all experiments have been examined and approved by the appropriate ethics committee and have therefore been performed in accordance with the ethical standards laid down in the 1964 Declaration of Helsinki.
ACKNOWLEDGEMENTS
Financial Disclosure: Haag Streit has provided travel expenses for conference attendance to FR and the loan of the Octopus 900 perimeter for the conduct of this research study. The sponsor or funding organization had no role in the design or conduct of this research.
COMPETING INTERESTS
The authors have declared that no competing interests exist.
REFERENCES
1. Maeda H, Nakaura M, Negi A. New perimetric threshold test algorithm with dynamic strategy and tendency oriented perimetry (TOP) in glaucomatous eyes. Eye. 2000;219:373-378.
2. Gonzalez-Hernandez M, Morales J, Azuara-Bianco A, Sanchez JG, de la Rosa MG. Comparison of diagnostic ability between a fast strategy, tendency-oriented perimetry, and the standard bracketing strategy. Ophthalmologica. 2005;219:373-8.
3. Artes PH, Iwase A, Ohno Y, Kitazawa Y, Chauhan BC. Properties of perimetric threshold estimates from Full Threshold, SITA Standard, and SITA Fast strategies. Investigative Ophthalmology Vision Science. 2002;43:2654-9.
4. Wadood AC, Azuara-Blanco A, Aspinall P, Taguri A, King AJ. Sensitivity and specificity of frequency-doubling technology, tendency-oriented perimetry, and Humphrey Swedish interactive threshold algorithm-fast perimetry in a glaucoma practice. American Journal of Ophthalmology. 2002;133:327-32.
5. Pierre-Filho Pde T, Schimiti RB, de Vasconcellos JP, Costa VP. Sensitivity and specificity of frequency-doubling technology, tendency-oriented perimetry, SITA Standard and SITA Fast perimetry in perimetrically inexperienced individuals. Acta Ophthalmologica Scandinavica. 2006;84:345-50.
6. Budenz DL, Rhee P, Feuer WJ, McSoley J, Johnson CA, Anderson DR. Sensitivity and specificity of the Swedish interactive threshold algorithm for glaucomatous visual field defects. Ophthalmology. 2002;109:1052-8.
7. Scherrer M, Fleischhauer JC, Helbig H, Johann Auf der Heide K, Sutter FK. Comparison of tendency-oriented perimetry and dynamic strategy in octopus perimetry as a screening tool in a clinical setting: a prospective study. Klin Monbl Augenheilkd. 2007;224:252-4.
8. Monhart M, Zulauf M. Conversion of the Octopus visual-field index LV to the Zeiss-Humphrey field analyzer index PSD for the glaucoma risk calculator S.T.A.R. Ophta. 2006;1:15-16.
9. King AJ, Taguri A, Wadood AC, Azuara-Blanco A. Comparison of two fast strategies, SITA Fast and TOP, for the assessment of visual fields in glaucoma patients. Graefes Archives Clinical Experimental Ophthalmology. 2002;240:481-7.
11. Rowe FJ. Visual fields via the visual pathway. Wiley-Blackwell Publishing; 2004. 12. Weijland A, Fankhauser F, Bebie H, Flammer J. Automated perimetry. Visual field
digest; 2004, 5th edition. Haag Streit AG.
13. Langerhorst CT, Carenini LL, Bakker D, van den Berg TJTP, de Bie-Raakman MAC. Comparison of SITA and dynamic strategies with the same examination grid. Perimetry Update, pp. 17–24. Proceedings XIIIth International Perimetric Society Meeting, Gardone Riviera (BS), Italy, September 6–9, 1998. Eds: WallM, Wild JM; 1999. Kugler Publications, The Hague, The Netherlands.
14. Nayak BK, Hazra A. How to choose the right statistical test? Indian Journal of Ophthalmology. 2011;59: 85-6.
15. Funkhouser A, Fankhauser F. The effects of weighting the "mean defect" visual field index according to threshold variability in the central and midperipheral visual field. Graefes Archives Clinical Experimental Ophthalmology. 1991;229:228-31.
16. Anderson AJ. Spatial resolution of the tendency-oriented perimetry algorithm. Investigative Ophthalmology and Visual Science. 2003;44:1962-68.
_________________________________________________________________________ © 2014 Rowe et al.; This is an Open Access article distributed under the terms of the Creative Commons Attribution License (http://creativecommons.org/licenses/by/3.0), which permits unrestricted use, distribution, and reproduction in any medium, provided the original work is properly cited.
Peer-review history: