S. J. Wormley, D. O. Thompson and K. M. Lakin Ames Laboratory-USDOE
Iowa State University Ames, IA 50011
I. INTRODUCTION
Advances in elastic wave scattering and inversion techniques have shown that advances in transducer technology are needed in order to fully exploit them. This is particularly true in the case of flaw sizing algorithms in which it has been demonstrated that a need exists for transducers with specified bandwidth characteristics. As a part of an effort to develop a composite, multiviewing
ultra-sonic transducer for flaw characterization, a computational tool has been developed which provides a convenient way to select driver pulse shapes and transducer characteristics which optimize this property. The purpose of this paper is to discuss this computational tool.
Work has been done by Mason [1] and others in the development of equivalent circuit representation of transducers. Mason's model, in particular, is used in this work. Jayosundere and Bond [2] have also recently studied transducer properties, and Yu, I1ic, Khuri-Yakub, Kino [3,4] pioneered work with unipolar transducers and unipolar stress pulses. Work done by Doctor et al. indicates that a square wave driving waveform reduces the need to tailor the wave-form and eliminates distortions caused by exponential decay, thus providing improved near surface resolution and improved reproduc-ibility [5].
II. MODEL SIMULATION AND IMPLEMENTATION
As shown initially by Mason [1], equivalent circuits in which properties of piezoelectric crystals are expressed in terms of equivalent elements, are often useful. The elements are combina-tions of inductors, capacitors and resistors. By adding electrical
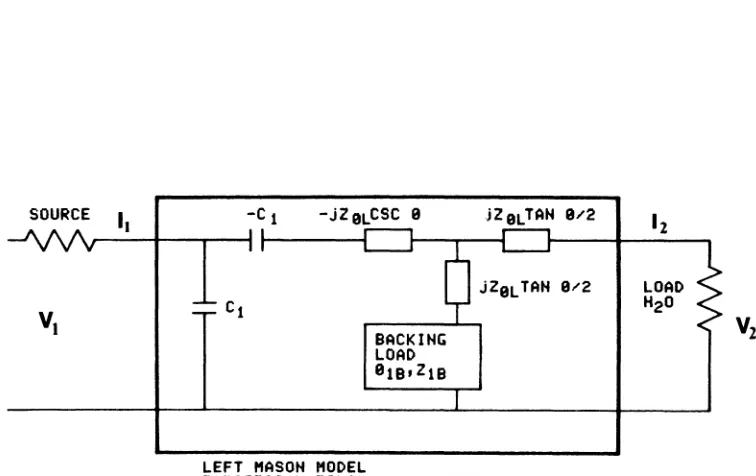
1474 S. J. WORMLEY ET AL. or mechanical elements it is often possible to make the circuits into the form of filter sections which can be designed to match the electrical and mechanical conditions of the driving and receiving end. Mason shows that a transducer with backing can be represented as a 3 port device; one electrical port and two mechanical ports, one on each side of the transducer. This can be reduced to a two port representation by pulling the backing "inside" the model, resulting in a model with one electrical port and one mechanical port (Fig. 1).
This model can then be represented by two-port network theory. In this case, the mechanical and electrical systems are represented as combinations of series and parallel two-port networks and con-nected by a transmission-parameter matrix. The transmission-para-meter matrix of a cascade of two-port networks is equal to the matrix product of transmission parameter matrices of the two-port networks. Thus,
SOURCE
I.
VI
-c
1Cl
N
IT (Tn) n=l
-jZ9LCSC 9
BACKING LOAD 918,Z18
LEFT "ASOH "ODEL
jZ9LTAN 9/2
jZ9LTAN 9/2
ELECTRICAL EQUIVALEHT CIRCUIT
(1)
12
LOAD H2O
Fig. 1. Mason's model block diagram for an immersion transducer, which is conveniently represented by two series and two
parallel transmission-parameter matricies. The driver pulse series resistance is a property of the driving electronics.
[image:2.482.51.429.301.539.2]The input and output voltages and currents are then related by
(2)
The transfer function for the resultant two-port network at a single frequency [6] is then given by
I
A r r B
,
I -A. -B.~ ~
1.3) I
C D r r
,
-C. -D. I ~ ~T __________ 1 ___________ I and the input/output ratio is A. B.
,
A B~ ~
,
r rC. D. I C D
~ ~
,
r r IRL(TU RL+T22)
-
jRL(T3l RL+T32) (4) Vl/V 2(TIl RL+T12)2 + (T3l RL+T32)2
For the work done here, the transfer function is computed at 256 discrete frequencies and takes the form of a 512 point array, with 256 pairs of real and imaginary components representing fre-quencies from DC to 2 Fo where Fo is the characteristic frequency at the transducer being modeled.
The impulse response, H(t) is the time domain response of the transducer model to a delta function and is determined by perform-ing an inverse Fast Fourier Transform (1FT) on the transfer function H(w)
N-l j2nnk/N
H(t) = (l/N) E H(w)e for n=O,l,---,N-l (5)
w=O
The resultant mechanical waveform G(t) produced in the water is then the convolution of the driving function F(t) and the Mason model impulse response H(t):
1476 S. J. WORMLEY ET AL.
G(t) N-l L F(t)H(n-t) for n=0,1,---,2N-2. t=O
III. EXAMPLES OF RESULTS
(7)
Model parameters, i.e., size, backing, frequency and material, were selected to approximate existing commercial transducers in the
laboratory. The parameters specified are: Piezoelectric Material (PZT4)
velocity - 6.00 x 105 cm/sec coupling coefficient - 0.68
Frequency (thickness) - 10 MHz (3 x 10- 2 cm) Piezoelectric diameter - 0.25 inches
Backing material
length - 0.48 cm (8A) attenuation - 10 nep/cm
A. Forward Problem
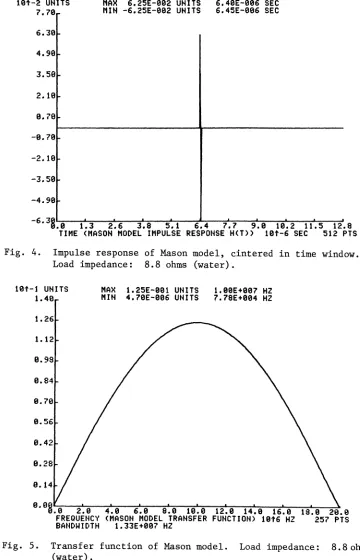
1. Several examples are shown for various driving tions studied. The simplest case is that of a spike driving func-tion, shown in Fig. 2, which exhibits a DC component and excellent low frequency density (Fig. 3). Upon convolution with the Mason model impulse response H(t) (Fig. 4) the resulting response in a water bath is shown in both time and frequency domains (Figs.
6,7).
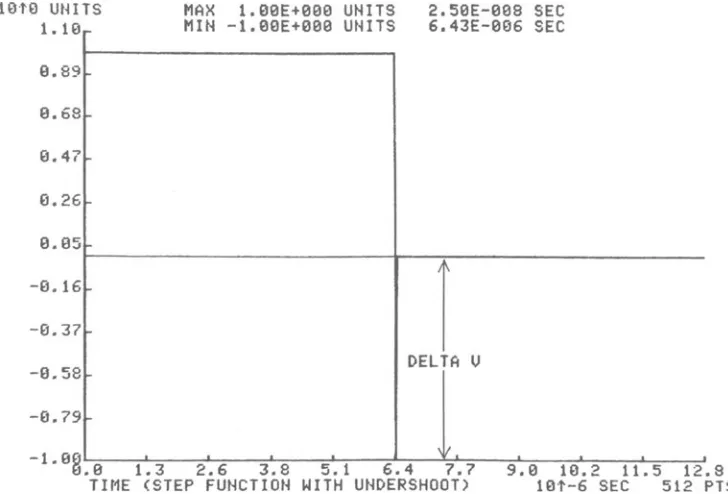
A second driver waveform that has been examined is shown in Fig. 8. As the width of the negative portion of the pulse was varied, variations in the spectral response through the Mason model are observed (Fig. 9). By holding the delta T to the minimum dura-tion resolveable by the computer algorithm, the effect of the under-shoot size was studied (Figs. 10,11). It is evident that consider-able control exists in the "shaping" of spectral response by selec-tion of the duraselec-tion and extent of the negative porselec-tion of this composite step function.
2. Effects of Backing
Backing in the Mason model is defined in terms of the impedance ZLB and phase aLB' The backing phase is of the form
10t0 UNITS
1.10
9.99
0.88
9.77
9.66
9.55
9.44
9.33
9.22
9.11
MAX l.e0E+88e UNITS 6.48E-886 SEC MIN 9.8eE+880 UNITS 2.58E-88S SEC
---) --- le9nS
9.91.9 1.3 2.6 3.8 5.1 6.4 7.7 9.9 19.2 11.5 12.8 TIME (TYPICAL DRIVING FUNCTION F(T» 10t-6 SEC 512 PTS
Fig. 2. Computer generated "spike" driving function. Some commer-cial ultrasonic pulsars approach, but do not achieve the ideal spike without undershoots, thus reducing the lower frequency content.
10t9 UNITS MAX 2.98E+8ee UNITS 7. 78E+904 HZ 2.19 MIN e. 0eE +000 UN ITS 2.90E+907 HZ
1.89
1.68
1.47
1.26
1.05
9.84
9.63
9.42
9.21
9·°9 .0 2.0 4.0 6.9 8.0 10.0 12.0 14.0 16.0 FREQUENCY (MAGNITUDE OF DRIVING FUNCT) 10t6 HZ BANDWIDTH 1.90E+997 H2
[image:5.482.63.420.51.651.2] [image:5.482.72.409.350.628.2]1478
10t-2 UNITS 7.70
6.'30
4.99
3.59
2.19
9.79
-9.79
-2.19
-3.59
-4.99
S. J. WORMLEY ET AL.
MAX 6.25E-892 UNITS 6.49E-906 SEC MIN -6.25E-992 UNITS 6.45E-096 SEC
-6 • 9.9 '39~~~~~~~~.-~~~,-~ 1.3 2.6 3.8 5.1 6.4 7.7 9.0 19.2 11.5 12.8 . . ~ . . ~~
TIME (MASON MODEL IMPULSE RESPONSE H(T» 10t-6 SEC 512 PTS
Fig. 4. Impulse response of Mason model, cintered in time window. Load impedance: 8.8 ohms (water).
10t-1 UNITS 1.49
1.26
1.12
9.98
0.84
9.70
9.56
9.42
9.28
MAX 1.25E-991 UNITS 1.99E+907 HZ MIN 4.79E-996 UNITS 7.78E+904 HZ
4.0 6.9 8.0 10.0 12.0 14.8 16.8 (MASON MODEL TRANSFER FUNCTION) 18t6 HZ
1.'33E+997 HZ
[image:6.482.51.411.73.633.2] [image:6.482.56.409.355.638.2]Hlt-2 UNITS
7.70
6.30
4.90
3.50
2.10
0.70
-0.70
-2.10
-3.59
-4.90
MAX 6.27E-002 UNITS 6.40E-006 SEC MIN -6.2SE-002 UNITS 6.4SE-996 SEC
-6 • 9.9 30~~~~~~~~~~~~~~~~~~~ 1.3 2.6 3.8 5.1 6.4 7.7 9.0 10.2 11.5 12.8
TIME (OUTPUT G(T)
=
F(T)*H(T» 10t-6 SEC 512 PTS Fig. 6. Convolution of computer generated "spike" driving functionand Mason model impulse response. 10t-l UNITS
1. 70 MAX MIN 9.1BE-0e9 UNITS 1.63E-S01 UNITS 6.69E+996 HZ 2.90E+e07 HZ
1.53
1.36
1.19
1.92
9.85
0.68
9.51
e.9S.
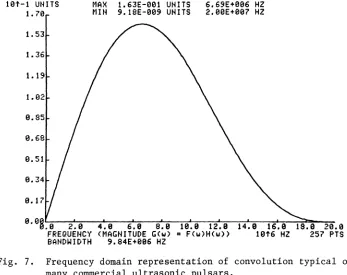
e 2.9 4.9 6.9 8.9 19.9 12.9 14.9 16.9 FREQUENCY (MAGNITUDE GCw) = FCw)H(w» 10'6 HZ BANDWIDTH 9.84E+906 HZ [image:7.482.59.417.78.580.2] [image:7.482.65.412.356.631.2]1480
10t·a UIHTS
1. 10
0.89
0.68
0.47
O.26
0.05
-0.16
-8.37
-9.5e
-0.79
MAX 1.00E+0e0 UHITS NIH -1 00E+000 UHITS
----,
-1.0S .9 1.3 2.6
3.e 5.1 6.4 TIME (COMPOSITE STEP FUHCTIOH)
S. J. WORMLEY ET Al.
- v
2.'50E-00e SEC 6 43E 006 <>EC
----7.7
DELTA T
9.9 10.2 11.5 12.9
10~-6 SEC 512 PTS
Fig. 8. Computer generated driving function - composite step, becoming a bipolar step function as delta T increases.
lOti UNITS 4.41
3.53
3.99
2.65
2.21
1. 77
1. 33
0.89
0.45
6490nS (BIPOLAR STEP)
0.el~~~--~~~~~~~~~~~~~~~~~~~ e.e 2.0 4.0 6.0 8.0 10.0 12.0 14.0 16.0
FREQUEHCY (MAGHITUDE) 10'6 HZ 257
Fig. 9. Frequency response of composite step function convolved with Mason model impulse response for various delta T. Modulation increases as delta T increases. A 50% Hanning window was used on bipolar step response to show
[image:8.482.54.432.69.664.2] [image:8.482.57.427.72.327.2]Hl'tO UN ITS
1. 10
9.89
B.68
0.47
£1.26
9.95
MAX 1.e0E+000 UHITS
MIN -1.00E+00B UNITS 2.S0E-BBa SEC 6.43E-006 SEC
t----~r
--£1.16
-0.37
-B.58 DELTA U
-0.79
-l.e£J~~~~~~~--~--~.-~.-~~~~~~~ £J.B 1.3 2.6 3.8 5.1 6.4 7.7 9.B 10.2 11.5 12.8 TIME (STEP FUNCTION WITH UNDERSHOOT) 10t-6 SEC 512 PTS
Fig. 10. Computer generated driving function - unipolar step with undershoot.
Hin UIUTS 4.41
2.21
1. 33
0.89
0.45
30B
0.B
B.
B 2.0 4.B 6.0 8.0 19.0 12.9 14.0 16.0FREQUENCY (MAGNITUDE) 1916 HZ
[image:9.482.64.428.72.319.2] [image:9.482.65.438.338.600.2]1482 S. J. WORMLEY ET AL.
in which nand t are the attenuation and thickness of the backing material, and
8
is the propagation constant in the backing material given by(9)
The attenuation n is specified in neperslcm and the length of back-ing in multiples of the piezoelectric wavelength A.
The spectral responses (driven by a delta function) for the transducer model are shown in Fig. 12 for various backing impe-dances as a percentage of the piezoelectric material impedance. Lower backing impedance narrows the response about the characteris-tic center frequency Fo' Higher backing impedance tends to increase resonances at integral multiples of Fo/2.
In Fig. 13, the backing length was held constant at 16 half wavelengths and attenuation varied. Reflected unabsorbed energy causes interference in the piezoelectric which show up as modula-tion in the frequency spectrum. Within the resolumodula-tion of the com-puter model, the energy in the backing was completely absorbed as the attenuation approached 8 nep/cm.
B. Inverse Problem
There would be an obvious advantage if a tvansducer driving function H(t) could be determined from a specified output trans-ducer function G(w). Our approach to this inverse problem is to deconvolve the transducer characteristics, H(w) from the prede-termined spectral output G(w).
G(w) H(;;;)
(H(w»2 (2)
The deconvolution process is sensitive to both noise and the effects of windowing. Figure 14 shows one possibility for an "ideal" spec-tral response. By deconvolving H(w) (see Fig. 7) from G(w), the result transformed into the time domain is shown in Fig. 15. IV. CONCLUSIONS
This computer modeling is preliminary and will be developed further as part of ongoing work. It has been demonstrated that experimental results can be duplicated with the mode, and that it is useful in guiding selections of transducer pulse driver shapes
HH-l UIHTS 3.CC 2.7C
2.40
2.10
1.8e
1. 'SC
1.29
9.90
9.69
9.30
BACKIHG IMPEDANCE = 4C~ ZeL
4.C 6.C S.C le.c 12.0 14.0 16.a
(MAGNITUDE) 19t6 HZ
Fig. 12. Mason model transfer function - backing impedance as a percentage of piezoelectric material impedance.
101'-1 UNITS 1. 70
1. 53
1. 36
1.19
1.92
0.85
0.69
0.51
9.34
--- ALPHA 2.9 HEP'CM
ALPHA 4.0 HEP,CM ALPHA 8.0 HEP'CM
4.0 6.0 8.0 10.9 12.0 14.9 16.0
(MAGNITUDE) 10t6 HZ
[image:11.482.64.443.78.335.2] [image:11.482.68.438.384.615.2]1484 S. J. WORMLEY ET AL.
HH9 UNITS
1.19 MAX 1.09E+999 UNITS MIN 1.95E-014 UNITS 9.81E+906 HZ 2.00E+007 HZ
0.99~---~
0.88
0.77
0.66
0.55
0.44
0.33
0.22
0.11
o • a9L-;:---::'L-;:----:-L:::_--=L:::_--::'L:::_....,...".~__._=~~L:::___:_=~__,_,,"---~
a.a 2.0 4.0 6.9 8.9 10.9 12.9 14.0 16.0
FREQUENCY (MAGNITUDE - IDEAL SPECTRUM) 10t6 HZ BANDWIDTH I.S0E+997 HZ
Fig. 14. "Ideal" spectral response of driver function and ultra-sonic transducer.
Hll8 UNITS 7.lEl
5.80
4.50
3.20
1. 90
0.60
-0.70
-2.00
-3.30
-4.60
MAX 6.00E+e0e UNITS 6.40E-006 SEC MIN -5.8IE+000 UNITS 6.35E-006 SEC
-5.92.0 1.3 2.6 3.8 5.1 6.4 7.7 9.0 10.2 11.5 12.8 TIME (1FT DECONVOLUTION RESULT Q=5.0E-4) 101-6 SEC 512 PTS
[image:12.482.59.415.59.624.2]be expanded to include two transducers in pitch-catch modes and can include characteristics of receiver and driver electronics as part of an effort to insure an optimal spectral response. Preliminary consideration has been given to using it in an inverse mode, i.e., to specify the spectral bandwidth desired from the transducer and to determine the driver pulse required. Determination of H-1(t) may possibly be solved by application of constrained linear inver-sion techniques [7], however, determination of F(t) may be reasonably approximated using deconvolution techniques.
ACKNOWLEDGEMENT
The Ames Laboratory is operated for the U.S. Department of Energy by Iowa State University under Contract No. W-7405-ENG-82. This work was supported by the Director of Energy Research, Office of Basic Energy Sciences.
REFERENCES
1. W. 2. N. 3. F.
4.
F.5. S.
6.
L.
7. S.
P. Mason, Physical acoustics and the properties of solids, Van Nostrand (1958).
Jayasundere and L. J. Bond, Ultrasonic transducer standards, these proceedings (1982).
Yu, D. B. I1ic, B. T. Khuri-Yakub, and G. S. Kino, App1. Phys. Lett. 36(7), 553 (1980).
Yu, D. B. I1ic, B. T. Khuri-Yakub, and G. S. Kino Ultra-sonics Symposium, 284 (1979).
R. Doctor, A. G. Gibbs, and R. P. Gribble, Waveform design for maximum pass-band energy, Pacific Northwest Laboratories, (1979).
T. Huelsman, Circuits, matrices and linear vector spaces, Mc-Graw-Hi11 (1963), p. 44-111.


![147 Sap Basis Security [ PUNISHER ] pdf](data:image/gif;base64,R0lGODlhAQABAIAAAP///wAAACH5BAEAAAAALAAAAAABAAEAAAICRAEAOw==)