Article
1
Comparing Human Versus Machine-Driven
2
Cadastral Boundary Feature Extraction
3
Emmanuel NYANDWI 1, *, Mila KOEVA 2, Divyani Kohli 2 and Rohan Bennett 3
4
1, * Department of Geography and Urban Planning, School of Architecture and Built Environment (SABE),
5
College of Science and Technology (CST), University of Rwanda; [email protected]
6
2 Faculty of Geo-Information Science and Earth Observation (ITC), University of Twente, Enschede 7500 AE,
7
The Netherlands; [email protected] (M.N.K); [email protected] (D.K)
8
3 Department of Business Technology and Entrepreneurship of Swinburne Business School, Melbourne,
9
Australia, BA1231 Hawthorn campus; [email protected]
10
Received: date; Accepted: date; Published: date
11
Abstract: The objective to fast-track the mapping and registration of large numbers of unrecorded
12
land rights globally, leads to the experimental application of Artificial Intelligence (AI) in the domain
13
of land administration, and specifically the application of automated visual cognition techniques for
14
cadastral mapping tasks. In this research, we applied and compared the ability of rule-based systems
15
within Object Based Image Analysis (OBIA), as opposed to human analysis, to extract visible
16
cadastral boundaries from Very high resolution (VHR) World View-2 image, in both rural and urban
17
settings. From our experiments, machine-based techniques were able to automatically delineate a
18
good proportion of rural parcels with explicit polygons where the correctness of the automatically
19
extracted boundaries was 47.4% against 74.24% for humans and the completeness of 45% for machine,
20
as against 70.4% for humans. On the contrary, in the urban area, automatic results were
21
counterintuitive: even though urban plots and buildings are clearly marked with visible features such
22
as fences, roads and tacitly perceptible to eyes, automation resulted in geometrically and
23
topologically poorly structured data, that could neither be geometrically compared with human
24
digitised, nor actual cadastral data from the field. These results provide an updated snapshot with
25
regards to the performance of contemporary machine-drive feature extraction techniques compared
26
to conventional manual digitising.
27
Keywords: Cadastral boundaries; Automation; Feature extraction; Object Based Image Analysis.
28
1. Introduction
29
The emergence of Artificial Intelligence (AI) concepts, methods, and techniques in the
1950-30
1960s [15]; [39]; [59]; [64], ushered in a new era of the longstanding philosophical debate and technical
31
competition between the merits of ‘man’ versus machine [7]; [13]; [23]; [28]; [46]; [50]; [52]; [62]; [66];
32
[73]. The optimistic perspective saw machine as unavoidable: as people become more intelligent, they
33
can prescribe precision and program performance of a high quantity task to automation [73].
34
Moreover, the strength of machines is they exhibit computation capabilities capable of handling
35
complex issues not quickly solved by humans.
36
For the domain of land administration, where only around 30% of land ownership units
37
worldwide are covered with the formal cadastres and land registration systems [11]; [26], automation
38
could be a supportive tool used to generate parcel boundaries, enabling faster registration and
39
mapping of land rights. In this vein, the current study aims at measuring the ability of machine-based
40
image analysis algorithms, against human operators, in relation to extracting cadastral parcel
41
boundaries from VHR remotely sensed images.
42
Preprints (www.preprints.org) | NOT PEER-REVIEWED | Posted: 29 May 2019 doi:10.20944/preprints201905.0342.v1
© 2019 by the author(s). Distributed under a Creative Commons CC BY license.
1.1.Cadastral intelligence
43
Our definition of cadastral intelligence draws on the 1983-Howard Gardner’s theory of multiple
44
intelligences in the area of spatial intelligence [16]; [27]; [35]. Howard Gardner defines spatial
45
intelligence as the ability to perceive the visual-spatial world [27]. More specifically, perceiving the
46
visual spatial world includes the ability to localise and visualise geographic objects [35]. From a
47
remote sensing perspective, spatial intelligence ranges from visually discriminating geographic
48
objects upon reasoning, and then drawing and manipulating an image [16]. In the cadastral domain
49
the ability to acquire and apply spatial intelligence in detecting cadastral boundaries is referred to as
50
cadastral intelligence [9], [10].
51
Recently, developments in AI have reshaped spatial intelligence into “automated
spatial-52
intelligence” [17]; [20]. From an AI perspective, spatial-intelligence is constituted by the procedural
53
knowledge exhibited through computational functions represented by a set of rules1 and structural
54
knowledge which allow the establishment of the relationship between image-objects and
real-55
world geographical objects [12]. AI has implied that there are many algorithmically trained
56
perception-capable computing models, that beside human operators, can perceive, and recognise
57
geographically referenced physical features [20]. In the contemporary era we can witness
58
substantial progress in remote sensing where automatic image registration allows for the handling
59
of huge volume of remote sensing images [2] efficiently [47], [56]. Regarding feature extraction from
60
remotely sensed images, automation, though difficult to configure and implement, is the eventual
61
solution to the limitations of manual digitisation [41], and this is with no exception in cadastral
62
mapping [9], [10]. For these reasons, the use of AI and automation is gains traction within
63
geoinformatics and land administration research domain generally [36].
64
1.2.The quest of automation in cadastral mapping
65
The cadastre is a foundation for land management and development [21],[68-70],[75]. An
66
appropriate cadastral system supports securing property rights and mobilising land capital, and
67
without it, many development goals of countries can either not be met, or are greatly impeded [68].
68
A major issue, however, is that only around one-third of land ownership units worldwide are covered
69
with the formal cadastre [11], [26]. The full coverage of cadastre is argued to be impeded, in part, by
70
procedural and costly conventional surveying approach. The latter suggests that all cadastral
71
boundaries must be ‘walked to be mapped’ [49], [77] making it resource intensive. Surveying is thus
72
the costliest process when registering landed or immovable property [58]; incurring 30-60% of the
73
total cost of any land registration project [14], [51]. The consequence is a growing aversion towards
74
land registration, lest the benefits of it would not compensate money spent [76].
75
Emerging geospatial technologies have made it possible to democratise mapping and
76
registration activities, conventionally undertaken by high level surveying experts. Mobile devices
77
equipped with simple web mapping apps, incorporating the ever increasing amount of high quality
78
aerial imagery, and connected to the cloud, has seen the rise of the ‘barefoot’2 surveyor and more
79
recently the ‘air-foot’ surveyor [9], [10], in the context of Unmanned Aerial Vehicles (UAVs)
80
applications. The latter; in substitute to the use of ropes, groma, tape measure, theodolite, total
81
stations and walking outside in the field [71], allows detection of visible cadastral boundaries based
82
on their patterns with respect to appearance and form from a distance [18], [36]. Owing to advances
83
in remote sensing, image-based cadastral demarcation approaches have been proposed and have
84
been experimented with in countries including Rwanda, Ethiopia and Namibia. Experimentation
85
1 Rule-based system or production system or expert system is the simplest form of artificial intelligence that
encodes human expert's knowledge in a fairly narrow area into an automated system [29].
3 of 23
shows effectiveness of remote sensing image-based demarcation in delivering fast-track land
86
registration [32].
87
Meanwhile, recent developments in the field of computer vision and AI have led to a renewed
88
interest for cadastral mapping where machine algorithms, able to mimic humans in exhibiting spatial
89
intelligence, could potentially be used to automate boundary extraction. The latter approach could
90
allow tapping existing opportunities of having VHR remote sensing images and LIDAR3 data, from
91
various sources and wide coverage. Contemporary satellites, besides manned airborne photography,
92
have offered sub-metre spatial resolution images, since the late 1990s [33], [55]. Far better, with UAV,
93
it is now possible to acquire centimetre-level image resolution and point cloud data, allowing to
94
uncover features occluded by vegetation [24], [30], [36].
95
When compared with manual on-screen digitisation, automation offers many potential
96
advantages. These include removing inconsistency errors resulting from different users performing
97
digitisation. Automation also allows coverage of wide areas with minimum labour, and supports
98
cheap and up-to-date fit-for-purpose solutions that aim to target existing societal needs [11], [53],
99
[66]. Automation could assist with the massive generation of digital property boundaries. Visible4
100
boundaries are marked by extractable physical features like fences, hedges, roads, footpaths, trees,
101
water drainages, building walls and pavement [1], [41]. Being visible, they are detectable by remote
102
sensors and can be extracted from remote sensing data, to generate boundaries of the features they
103
represent [18]. Such cadastral boundaries features can be detected based on their specific properties
104
like being regular, linear-shaped or with limited curvature in their geometry, topology, size and
105
spectral radiometry or texture [18].
106
Machine-based image analysis approaches, applicable for automated cadastral boundaries
107
extraction, can be grouped into two categories: (i) Pixel-Based Approaches [PBA] and (ii)
Object-108
Based Approaches, also well known as Object-Based Image Analysis [OBIA] [18]. The first approach
109
only considers spectral value or one aspect for boundary class [4]. Thus, PBA algorithms, with
110
exception to state-of-the-art Convolution Neural Network [CNN] [5], [18], [54], [74], may result in a
111
“salt and pepper” map when applied to Very High-Resolution images [34]. Due to the lack of an
112
explicit object topology that might lead to inferior results than those of human vision, PBA falls short
113
of expectations in topographic mapping applications [13]. Unlike PBA, objects resulting from OBIA
114
are features with explicit topology, meaning they have geometric properties, such as shape and size
115
[50]. This makes OBIA suitable for extracting cadastral boundaries [18], [31], [48].
116
In brief, it appears there are many potentialities for automation of feature delineation using AI
117
tools such as state of the art CNN models and OBIA. However, the major problem remains how to
118
make automation an operational solution [25], especially in cadastral mapping, where properties
119
need to be delineated with high precision specification geometrically and topologically. This infers
120
there lies a compelling need to research more on the usability and applicability of AI-based cadastral
121
intelligence in land administration [37]. Therefore, our study is built on the necessity to explore the
122
potentialities of machine-based image analysis algorithms to extract cadastral parcels. While,
123
theoretically some automation tools could even outperform human operators to extract features from
124
images [12], little is said on their performance compared to humans within a cadastral
domain-125
specific application. The focus of this research is therefore to investigate the extent to which
126
automatically captured cadastral boundaries align with existing geometric standards of cadastres.
127
2. Materials and Methods
128
3 Light Detection and Ranging
4 Despite the two-sorted ontology of boundaries, implying that some of the property boundaries are invisible [57-58], the
majority of cadastral boundaries are believed to be self-defining and can be extracted visually [48].
Preprints (www.preprints.org) | NOT PEER-REVIEWED | Posted: 29 May 2019 doi:10.20944/preprints201905.0342.v1
This study applied a comparative approach using two case sites, one an urban setting and the
129
other a rural setting within Kigali city in Rwanda5. The sites were selected based on the availability
130
of VHR satellite images, the hypothesised visual detectability of cadastral boundaries, and
131
convenience of accessing reference datasets for comparison. The study used pansharpened, by fusing
132
the 2 m resolution multispectral with 0.5 m-resolution panchromatic WorldView-2 satellite images,
133
tiles of 280 x 560 m and 320 x 400 m respectively, for extracting rural parcels and urban plots with
134
building outlines. The study involved three main steps: pre-processing of the image, boundaries
135
extraction (automation and human digitisation) and geometric comparison.
136
2.1. Pre-processing
137
Pre-processing concerned preliminary operations: (1) subsetting the image to eliminate
138
extraneous data and constrain the image to a manageable area of interest and (2) pan-sharpening to
139
fuse the high-resolution panchromatic image with a low-resolution multispectral image for enhanced
140
visual interpretability and analysis. For pan sharpening, the Nearest-Neighbour Diffusion algorithms
141
available within the Environment for Visualising Images [ENVI] software, was applied owing to its
142
advantage of enhancing the salient spatial features while preserving spectral fidelity [60].
143
5The country is recognised globally to be among the first countries where image-based demarcation was applied to build a
5 of 23
Figure 1: Case study location: (a), (b), (c), (d) and (e) show respectively, the study area on global
144
scale; Rwanda; the city of Kigali; rural site and urban site.
145
(c)
(a)
(b)
(d)
(e)
Preprints (www.preprints.org) | NOT PEER-REVIEWED | Posted: 29 May 2019 doi:10.20944/preprints201905.0342.v1
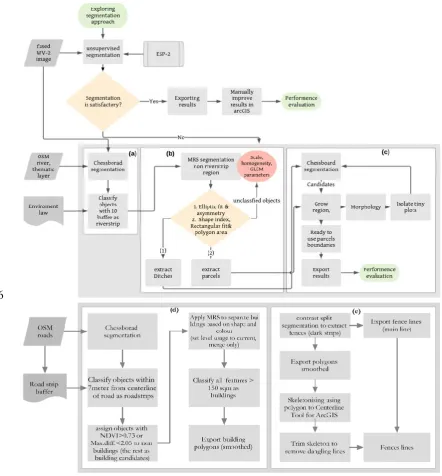
2.2.Parcels and building outline extraction
146
2.2.1. Automatic process
147
The extraction parcels and building6 outlines were based on spectra, texture, geometry and
148
contextual information. OBIA, used approach, can combine spectra, texture, geometry and contextual
149
to delineate objects with explicit topology, shape and size [43] which are key aspects of cadastral
150
index map. Rule-based expert systems within eCognition software were developed to allow the
151
segmentation of the image (Figure 2). Getting an optimal segmentation where maximum numbers of
152
segments matched parcel boundaries or buildings outlines was crucial. Initially, the automated
153
Estimate Scale Parameter [ESP2] tool described in [22] was applied. The appeal of this tool is that it
154
supports for automated optimisation of scale parameter (SP) which is the key control in
155
Multiresolution Segmentation [MRS] process and it is fully automatic. But ultimately, the study used
156
expert knowledge for parameterisation for boundaries [22]. The selection of parameters such as scale
157
parameter in MRS is an objective an objective decision [22] requiring reasoning of the user who can
158
instruct the machine. After segmentation, to classify candidate objects into parcels, geometry
159
information such as polygon area, compactness, asymmetry, density, elliptical fit and shape index
160
was used. But not all targeted parcels could be extracted whole and correctly immediately: several
161
iterations were needed. İn most cases, automation resulted in so-called jagged lines, however,
162
cadastral boundary edges have standard properties of linearity or limited curvature, and smoothness.
163
To improve and smooth ragged boundaries, the morphological operator within eCognition was
164
considered.
165
6In this research it was important to compare the ability of machine against humans in extracting building outlines with
7 of 23
166
Figure 2: Applied automated boundaries extraction workflow
167
2.2.2. Manual digitisation
168
Five7 human cadastral experts were tasked to individually hypothesise and manually digitise
169
cadastral boundaries using the same dataset as used in automation. In accordance with [6], experts
170
were identified based on cadastral domain professional qualifications, experience, and memberships
171
of the recognised surveying professional body (Table 1). The domain experts had extensive
172
knowledge and expertise and were familiar with the subject at hand and analyses the issue by
173
automatic, abstract, intuitive, tacit, and reflexive reasoning can perceive systems, organise and
174
interpret information [38]. The team was provided with an extraction guide that clearly describes
175
cadastral objects to be extracted, input dataset with clear digitising rules.
176
177
7 Using more than one person allowed to assess human consistency
Preprints (www.preprints.org) | NOT PEER-REVIEWED | Posted: 29 May 2019 doi:10.20944/preprints201905.0342.v1
Table 1: Human operators
178
Expert ID Qualification Professional body Experience
A Master in Geoinformation and Earth Observation National cadastre 8 years B Bachelor of Science in Geography National cadastre 8 years C Bachelor of Science in Geography National cadastre 8 years D Bachelor of Science in Land Surveying Organisation of surveyor 5 years E Bachelor of Science in Geography National cadastre 5 years
2.2.3. Geometric comparison of automation versus humans
179
In our study, geometric precision, that is usually more important than the thematic accuracy for
180
spatial features delineation [48], was considered the key aspect in measuring the performance of
181
machine against human operators, for parcels and building outlines extraction. Considering that an
182
important aspect of developing systems for automated cartographic feature extraction is the rigorous
183
evaluation of performance, based on precisely defined characteristics [40], we decided to use accurate
184
reference boundaries measured8 out in the field rather than current legal boundaries. While the later
185
are not accurate enough (with an estimate shift of 1 to 5m) to not serve as reference data, they provide
186
shapes that helped surveyors to know the parcels that need to be precisely measured following
187
existing boundaries features. In fact, it would be practically impossible to survey reference parcel for
188
each of the parcels extracted, with the presence of respective owners and owners of neighbouring
189
parcels to show the limit of parcels, as required by the conventional surveying approach in Rwanda.
190
In an ideal case, a one to one relationship is obtained where desirably one parcel in the reference
191
is explained by one parcel in the extracted data set (Figure 3: i, ii, iii and v). In other cases of one to
192
many or many to one correspondence (Figure 3, iv) omission errors and commission errors called
193
false negatives and false positives metrics were determined. (i) The False Positives (FP) are parcels,
194
which were erroneously included by either machine or human experts; (ii) the False Negatives (FN)
195
are parcels not detected by either human or machine but they exist in the reference dataset. The
196
performance of machine versus humans could be also estimated as the portion of extracted parcels
197
that could match their corresponding references (correctness) or the portion of reference parcels that
198
could be reproduced by extraction (completeness) [18].
199
200
Mathematically,
201
FN (omitted) + TP (detected) = Reference, (1)
FP (Committed) + TP (Correctly detected) = Extracted, (2)
Correctness =Extracted ∩ Reference
Extracted ∗ 100, (3)
Completeness =Reference ∩ Extracted
Reference ∗ 100 (4)
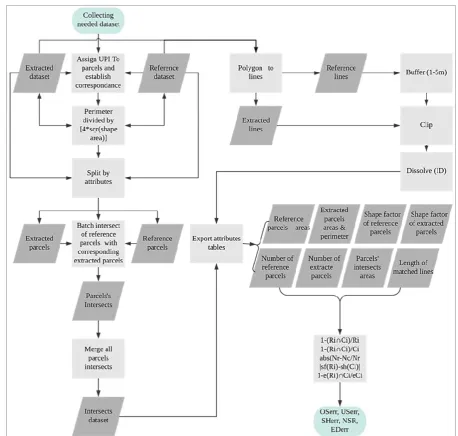
A framework for comparing extracted and reference parcels was developed in the esri ArcGIS
202
environment (Figure 4). To be able to compare each individual parcel in the reference set with the
203
corresponding parcel in the extraction set, the splitting by attributes tool was used to split the index
204
cadastral map into individual parcels. Then the batch intersect tool for each parcel in the reference
205
data with each corresponding parcel in the extraction set. Resulting intersects were then merged to
206
have one attribute table containing area of intersection of extracted parcels and reference parcels.
207
Other input data like shape index values were computed using esri ArcGIS geoprocessing calculate
208
field tool.
209
8 Field survey used precision survey tablet running Zeno field mapping software with access to GNSS RTK
CORS instant corrections. A network of Continuously Operating Reference Stations (CORS) with Real Time
Kinematic (RTK) positioning techniques provides instant corrections to measurement taken using Global
9 of 23
Figure 4: Implemented framework for computing geometric discrepancies
210
For edge shifting computation using ArcGIS a model (Figure 5) was built to automate the process.
211
212
Figure 5: Model for assessing edge error between reference and automated boundaries lines
213
3. Experimental Results
214
Preprints (www.preprints.org) | NOT PEER-REVIEWED | Posted: 29 May 2019 doi:10.20944/preprints201905.0342.v1
This section presents parcel and building extraction results by humans and automation means,
215
and the performance of human operator against machine operator. Extraction results were
216
disaggregated by sites: rural versus urban.
217
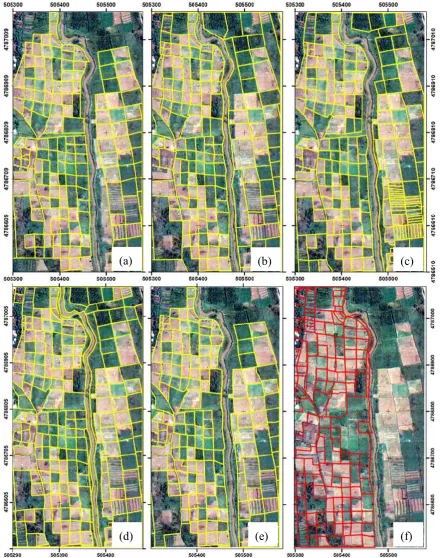
3.1.Extraction of parcel boundaries in rural area
218
In the rural area, cadastral professional hypothesised and digitised parcels following visible
219
features such as ditches according to their expertise. From (a) to (e), Figure 6 below presents manually
220
digitised rural parcels. On the same figure in (f), we have legal boundaries from the national cadastre.
221
Figure 6: Manually digitised rural parcel boundaries (a-e) and legal boundaries from the national cadastre (f).
222
(a)
(b)
(c)
11 of 23
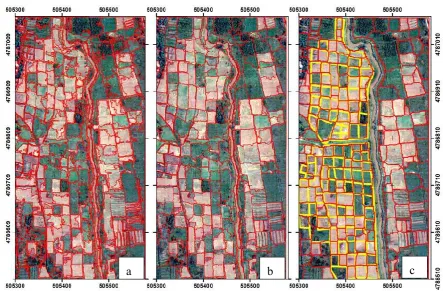
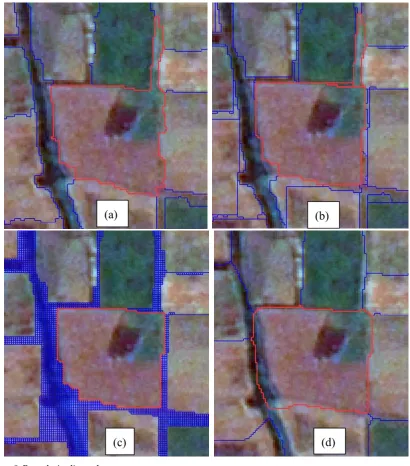
The automated OBIA approach, on the other hand, resulted in ragged and highly inaccurate
223
segments [Figure 7 (a)] when using the fully automated Estimate Scale Parameter (ESP-2) tool with
224
the shape factor of 0.1 and the compactness of 0.5 for the segmentation. The results were improved
225
by modifying the shape factor and compactness to 0.5 and 0.8 respectively [Figure 7. (b)]. As indicated
226
in Figure 7 (c), much better results were obtained by using the user-developed rule set based on
227
experts ground knowledge since it is more adapted to context than the ESP-2 tool.
228
229
Figure 7: Automatically extracted parcels boundaries. in (c), automated parcels are overlaid with reference (in
230
yellow) parcels.
231
During automation, resulting boundaries presented dangling features that do not meet cadastral
232
geometry and topology requirements. On Figure 8 (a), the parcel in red has a dangling area that need
233
to be trimmed off, but also ditches, dark strips that separate parcels need to be represented as line
234
and not as polygons. The morphology operator within eCognition was used to improve the
235
boundaries. In (b), the pixel-based binary morphology operation is used to trim dangling portion off
236
the main parcels. An opening morphology operation to define the area of extracted parcel that can
237
completely contain the mask and the area, that cannot contain the mask completely is trimmed off
238
the parcel. Morphology setting was done based instructions from eCognition reference manual. In
239
(c), ditches and other loosely extracted features are sliced into smaller image objects using chessboard
240
segmentation. For smoother results, the object size is set to the smaller size possible, in our case to 1.
241
In (d), split segments are set to merge neighbouring parcels and parcels boundaries are improved.
242
a
b
c
Preprints (www.preprints.org) | NOT PEER-REVIEWED | Posted: 29 May 2019 doi:10.20944/preprints201905.0342.v1
243
244
Figure 8: Boundaries line enhancement
245
3.2.Extraction parcels in urban areas and building outlines
246
The extraction of parcel and building in urban area relied on visible fences, roofs and roads.
247
From (i) to (v), Figure 9, presents reference parcels (in red) overlaid with manually extracted urban
248
plots (in yellow).
249
(a)
(b)
13 of 23
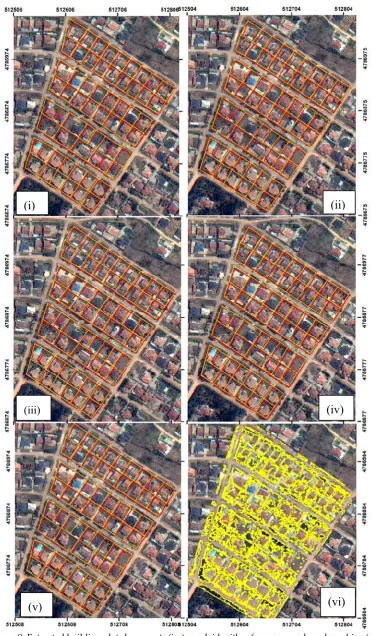
Figure 9: Extracted building plots by experts (i-v) overlaid with reference parcels and machine (vi).
250
(i)
(ii)
(iii)
(iv)
(vi)
(v)
Preprints (www.preprints.org) | NOT PEER-REVIEWED | Posted: 29 May 2019 doi:10.20944/preprints201905.0342.v1
Other than building plots we also applied both automatic and manual techniques for the
251
extraction of building outlines. Presented in Figure 10 are results from expert team manual
252
digitisation [a-e] and automatically extracted building outlines[f].
253
Figure 10: Extracted buildings plots by manual digitisation and automation
254
The automation output in the urban area was counterintuitive, at least compared to human
255
visual interpretation. As it can be remarked, automation resulted in poorly structured parcel
256
boundaries compared to the manually digitised parcels. As shown on Figure 10 (f), the machine faced
257
difficulties to trim pavements and tiny structures from the main buildings. Blue and black roofed
258
building were omitted as they spectrally appear like vegetation. On the contrary, humans were more
259
precise and concise.
260
3.3.Geometric comparison of automated against manually digitised boundaries
261
Geometric discrepancies between each reference parcel and the corresponding extracted parcel
262
were determined by overlaying automatically produced parcels with manually digitised and field
263
(a)
(b)
(c)
(d)
(e)
(a)
(b)
(d)
(f)
(c)
15 of 23
surveyed parcels. A distance tolerance buffer of 4 m was applied considering the shift of boundaries
264
inherent in the source image. Note that the comparison was done only for the rural site, where
265
automation results were geometrically comparable with manual and reference parcel polygons.
266
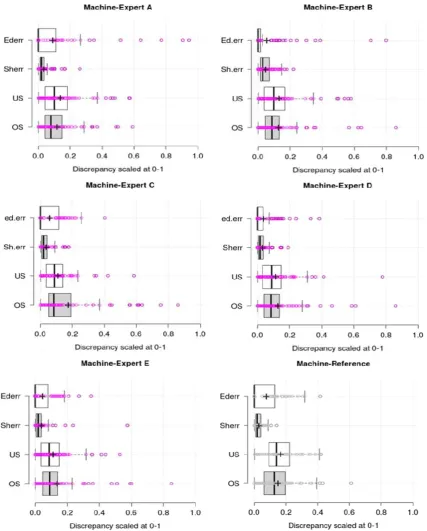
In Figure 11, violin graphs are shown, on which white dot marks the median, illustrating the full
267
distribution of discrepancies between reference parcels and automated and manually digitised
268
parcels.
269
Figure 11: Clustering of geometric discrepancies
270
The wider section of the violin plot9 in Figure 11 indicated higher number of extracted parcels
271
with given error value whereas the skinnier section shows a reverse case. The graphs allow
272
examination of the behaviour for all instances, that is, the variation and likeness in the full
273
distribution and the pattern of responses for machine and human can be visualised and compared.
274
The comparison of machine intelligence to expert knowledge was also done by comparing
275
automated parcels with hypothesised and manually digitised parcels. Unlike in the previous
276
comparison, the analysis of automated parcels against hypothesised parcels by experts did not
277
necessarily consider the correctness of detection i.e. the degree of coincidence of extraction with
278
cadastral boundaries. The focus is the ability to detect visible boundaries features on the image. As it
279
9see https://mode.com/blog/violin-plot-examples for interpretation of violin graph
Preprints (www.preprints.org) | NOT PEER-REVIEWED | Posted: 29 May 2019 doi:10.20944/preprints201905.0342.v1
can be observed in Figure 12, the pattern of distribution of discrepancies corroborated with Figure 11
280
with respect to shapes of extracted parcels.
281
Figure 12: Discrepancies between automated boundaries and manually digitised parcels
282
Table 2 presents the global error for each metric considered: over-segmentation,
under-283
segmentation, shape and edge shifting. Since an optimum and error-free segmentation where OSerr,
284
USerr, SHerr and EDerr equal 0 is the ideal case and rare to have, we can simply define an error
285
tolerance range within which extracted parcels are maintained as acceptable.
286
287
17 of 23
Machine Expert A Expert B Expert C Expert D Expert E
OS.err 0.15 0.12 0.13 0.11 0.11 0.12
US.err 0.17 0.14 0.13 0.20 0.15 0.15
SH.err 0.03 0.02 0.05 0.03 0.03 0.02
ED.err (buffer=4m) 0.07 0.02 0.06 0.03 0.03 0.02
NSR 0.063 0.049 0.069 0.108 0.020 0.059
FP 14.74% 12.5% 9.57% 12.22% 12.12% 13.68
FN 14.85% 15.84% 16.83 25.74% 13.86% 19.80%
Correctness 47.4% 76% 67 % 77.8% 77.8% 72.6%
Completeness 45% 73% 63 % 70% 77% 69%
(*) Reference= 100 parcels; automation=95 parcels; expert A=96 parcels; expert B=94 parcels; Expert C=90 parcels;
289
expert D=99 parcels and Expert E=95 parcels
290
4. Discussion
291
4.1. Manual extraction creates quality issues
292
In general, manual digitisation of rural parcels resulted in slight inconsistencies among users.
293
Not all parcels could be extracted equally the same, despite having the extraction guide provided to
294
support the cadastral experts. The results show a commonality of approximately 60% in detected
295
parcels by humans, however, 40% are perceived quite differently amongst the experts. The findings
296
raise questions regarding cadastral updating: arguably if human operators update boundaries with
297
only imagery as support, they may introduce different non-systematic errors. Machines may
298
introduce less error during cadastral updating: the algorithms used, if not changed, will follow the
299
same logic. Therefore, beyond issue of higher costs and time usually associated with human users,
300
the issue of quality is significant to consider also.
301
4.2. Semi-automated is more feasible than fully-automated
302
The findings of this research suggest that a semi-automated rather than a fully automated
303
approach is more applicable for cadastral boundaries extraction, for ready-to-use data that can be
304
exported as a vector file, for example, to esri ArcGIS or other GIS. Semi-automated approaches with
305
a user-developed rule sets, based on experts’ ground knowledge, generate better results since it is
306
more adapted to context than the ESP-2 tool. By improved results here, we mean topologically and
307
geometrically well-structured parcel boundaries that do not require manual post-processing and
308
editing. For instance, knowing the setback distance, a user can extract parcels within a defined
309
distance from specific roads or river. Also, since it is not possible to have all parcels with same
310
morphological conditions, to adapt to variation in size and shape, semi-automated approaches allow
311
for a subsequent segmentation and classification.
312
4.3.Invisible social boundaries: a challenge to both machines and humans
313
4.3.1. Rural area
314
While colour is the primary information contained in image with which objects are extracted
315
and separated [63], individual parcels are not reflected by different colours. In addition, parcel
316
boundaries shown on images, some are social constructs making it rather challenging to extract them.
317
Some parcel boundaries are visible on image whereas others are invisible and cannot be detected.
318
In our study, the separability of rural parcels was influenced by the extractability of features
319
marking boundaries, parcel size and shape. Most of the parcels in rural sites were marked
320
consistently by visible ditches. Ditches were extractable by machine as separate elongated narrow
321
strips (Figure 8) or otherwise it would be difficult to separate two parcels with same texture. In
322
Preprints (www.preprints.org) | NOT PEER-REVIEWED | Posted: 29 May 2019 doi:10.20944/preprints201905.0342.v1
eCognition, such elongated features like ditches are characterised by very low elliptic fit values and
323
or being very highly asymmetric. The ditches being extractable as separate entities from parcels
324
facilitate separating parcels from their neighbours. Experiments show that a parcels’ layout, size and
325
fragmentation affect the extraction of boundaries. With regard to shape and size of parcels, it could
326
be observed that having regular shaped parcels eased the automation whereas highly fragmented
327
parcels prompted to omission and commission errors due to variation in shapes and size of parcels.
328
As was experienced, when classifying segments with shape indexes like rectangular fit, shape index,
329
border index, elliptic fit, compactness - the over-segmentation error was likely. To avoid this error, a
330
parcel area threshold value was defined that would remove small (likely committed) parcels from
331
classification. But also, screening small polygons to prevent over-segmentation resulted in
under-332
segmentation error as there exist very tiny plots reflecting the level of land pressure in the country.
333
Not only extracting highly fragmented parcels was a challenge to automation, but also to humans.
334
Some of the hypothesised boundaries by human experts could not necessarily match references
335
parcels. This means that the physical line is not enough to define a boundary. This leads to human
336
subjectivity, because of individual differences in image interpretation [65], in parcel delineation.
337
Inconsistencies, where it is likely for one human expert not to produce same parcels nor uniformly
338
digitise the same boundaries for repeated times, present a weakening feature of image-based
339
demarcation.
340
4.3.2. Urban area
341
Major challenges were encountered in the urban area owing to higher heterogeneity and
342
diversity with respect to form, size, layout, and material constitution of urban structures. For
343
instance, one roof surface may display varying spectral signatures, making it very difficult for
344
automated building extraction. In the studied case, buildings roofs are mostly hip and valley and
345
prone to spectral reflectance variation. In fact, depending on the position of the sun at the time of
346
image acquisition, some parts of the roof are not illuminated which affect the extraction, raising
347
requirement concerns over the quality of image required for cadastral mapping purposes. Not only
348
roofs, but also the material composition of fences and marking of plot boundaries varies, making it
349
difficult for parcel extraction. Fences are very relatively and typically narrow objects, hard to detect
350
with a 0.5-metre resolution image. In some cases, building roofs, the fences marking parcels, building
351
shadows and garden had almost the same spectral signatures making it almost impossible to separate
352
these features.
353
Generally, from the experiments it can be assumed that the extraction of buildings and urban
354
plot boundaries using spectral information of roofs and fences is challenging due the complexity of
355
urban fabric and the quality of the remotely sensed data used by the machine, as opposed to humans.
356
Looking at the image, buildings and fences are very able to identified with eyes, and we can also see
357
good results from digitisation by experts. Counter-intuitive results obtained from automation
358
confirm observations made in [43].
359
4.4. Both strengths and weaknesses between human and machine
360
From the comparison of manually digitised boundaries against automatically generated rural
361
parcel boundaries (Figure 11), the most striking observation is the likeness of the degree of deviation
362
of automatically and manually extracted parcels shapes from the real (reference) parcel shapes. This
363
demonstrates that the deviation of automated parcel shapes from manually digitised parcel shapes
364
were too small. Figure 11 was corroborated by Figure 12, in showing that nearly all extracted parcel
365
polygon areas by experts have less than 20% of their areas committed or omitted from automated
366
parcels polygon areas. In general, human operators were geometrically a more precise than machine
367
algorithms when drawing and reproducing parcel geometries from images but the performance of
368
machine is auspicious in the rural context. On the contrary in urban areas, humans outperformed
369
automation. In fact, automated parcels and building outlines were topologically and geometrically
370
19 of 23
4.5.Corroboration with previous studies
372
Our study findings corroborate with some of previous studies [37], [67] where obtained
373
automation performance was 24-65%. In contrast to findings by [3],[19], [25], [61], however,
374
automation performance was lower due to focus on geometric precision rather than thematic
375
accuracy. Different from previous studies, with exception to the study of [37]; this study focused on
376
automated extraction of whole-parcel boundaries. Here, the importance would not be to consider
377
only higher automation rates, but also more emphasis on providing information that fit with
378
acceptable cadastral standards. According to [31] and [67], even with automation performance,
30-379
50% will significantly reduce the cost incurred in land demarcation. Therefore, it can be concluded
380
that, the current study achieved promising results in rural areas. In urban area, however, while an
381
unambiguous ontology status of buildings, with shapes that are clearly detectable to humans, would
382
to ease their delineation [8], results can be counterintuitive.
383
4.6.Implications for practice and research
384
Our method for comparison is implementable in esri ArcGIS. It is quantitative and hence
385
reproducible and replicable. As for implications, first, the study instils future researchers to use
386
geometric accuracy metrics in compliance with cadastral standards.
387
The second implication of the study derives from the spatial quality of the obtained automation
388
results leading to, potentially, transferability not of the rule set but the approach used. It was noted,
389
in experimentation with the ESP-2 tool, that the rule set might not be transferable instinctively. It is
390
because the rule set includes parameter values set to fit a specific context and not the general context.
391
Likely, the approach is designed in such a way that with small adjustments of the rule parameters
392
pertaining to shape and size, depending on the context of the concrete case, it is replicable in other
393
contexts. This makes our work highly beneficial for future researchers and other case studies.
394
Third, from reviewed previous proponent works in automation of cadastral boundaries
395
extraction (as it is also for the current study as limitation) emerge the issue of scalability. In common,
396
many of the inferences made in this work are based on simple case studies using smaller tiles of
397
images which do not represent the complexity on the ground. The research problem is aligned to a
398
real-world problem, but the presented solution primarily considers methodological matters, not the
399
broader set of pollical, legal, organisational, and administrative challenges. Added to that, using
400
automation in a small area might not be a wise idea, it terms of gaining critical mass and economies
401
of scale. The implication of this is a need to apply automatic tool to a large area in simulation to
real-402
world practice than using smaller and subjectively selected area. In general, the conclusion is that the
403
tool can be successfully used for large scales in support to the current surveyors as a preliminary step
404
before undertaking final map creation. After cadastral professionals have automatically extracted
405
boundaries, they can overlay them on an image and discuss with the owners, to be eventually fixed
406
and legally accepted.
407
Generally, beyond the requirement to understand the data, the experimentation suggests that
408
automated extraction of cadastral boundaries, requires in addition, knowing the social contexts that
409
shape landholding structures in a given area. During automation, the user must integrate this
410
knowledge within the rule sets. Fully automated approaches could not be fruitful compared with the
411
user-developed rule set, since it limits user intervention, if not ignores it, and does not integrate
412
expert ground knowledge.
413
5. Conclusion and Recommendation
414
This study compared machine driven techniques, using rule sets within OBIA, and human
415
abilities in detecting and extracting visible cadastral boundaries from VHR satellite images. From the
416
results, automation was able to correctly extract 47.4% of visible rural parcels and achieved 45% of
417
Preprints (www.preprints.org) | NOT PEER-REVIEWED | Posted: 29 May 2019 doi:10.20944/preprints201905.0342.v1
completeness, whereas in urban areas, it failed to generate explicit polygons owing to urban
418
complexities and spectral reflectance confusion of cadastral features. As was elaborated, machines
419
are meant to increase human performance in production and service delivery. In the cadastral field,
420
this will be achieved if human cadastral intelligence; knowing where boundaries are results of social
421
constructs and more perceptible to humankind; is integrated with computational machine power to
422
allow the extraction of many parcels to support land registration. With the obtained results in rural
423
settings, land registration service coverage can be taken farther than it is today.
424
Despite rigorous methods applied, the study does not, however, claim the full-fledged
425
experimentation with automation tools. Thus, more studies are needed using other tools and other
426
case studies in search of the tool that best fits the concrete purpose. In this study, automation was
427
applied on relatively small area but it is suggested it could also be scaled up on large areas. Finally,
428
in urban areas, the study encountered limitations since the colour (i.e. spectral signatures) was the
429
primary information contained in image data in segmentation. As an implication, the incorporation
430
of LIDAR information may improve obtained results and hence is suggested for application to the
431
same case and other studies. The goal is to identify and apply user-friendly and learnable automation
432
tool that allow having precise and GIS ready cadastral boundaries on a large scale possible.
433
Author Contributions: Emmanuel Nyandwi wrote the manuscript, organised and conducted field data collection and the
434
experiments. Mila Koeva and Divyani Kohli and Rohan Bennett contributed to the conceptual design of the experiments and
435
reviewed the paper.
436
Acknowledgments:Authors acknowledge cadastral experts, including four cadastral maintenance professionals from
437
Rwanda Land Management Authority and one surveyor from the Organisation of Surveyors in Rwanda, for accepting to take
438
part in this study by hypothesising and digitising parcels boundaries from images. We acknowledge the land registration
439
department of Rwanda land management authority for providing legal boundaries. we are grateful to ITC for providing image
440
data.
441
Conflicts of Interest: “The authors declare no conflict of interest.”
442
References
443
1. Ali, Z., Tuladhar, A.; Zevenbergen, J. (2012). An integrated approach for updating cadastral maps in
444
Pakistan using satellite remote sensing data. IJAOG, 18, 386–398.
445
2. Alkaabi, S.; Deravi, F. (2005). A new approach to corner extraction and matching for automated image
446
registration. IGARSS, 5(2), 3517–3521.
447
3. Alkan, M.; Marangoz, M. (2009). Creating Cadastral Maps in Rural and Urban Areas of Using High
448
Resolution Satellite Imagery. Applied Geo-Informatics for Society and Environment 2009- Stuttgart
449
University of Applied Sciences, 90–95.
450
4. Aryaguna, P. A., and Danoedoro, P. (2016). Comparison Effectiveness of Pixel Based Classification and
451
Object Based Classification Using High Resolution Image in Floristic Composition Mapping (Study Case:
452
Gunung Tidar Magelang City). IOP Conf. Ser.: Earth Environ. Sci. 47, 47(012042).
453
5. Audebert, N., Le Saux, B.; Lefevre, S. (2016). Semantic Segmentation of Earth Observation Data Using
454
Multimodal and Multi-scale Deep Networks. In Asian Conference on Computer Vision (ACCV16), Nov
455
2016, Taipei, Taiwan.
456
6. Ayyub, B. M. (2001). Elicitation of expert opinions for uncertainty and risks. CRC Press.
457
7. Balke, F. (2016). ‘Can thought go on without a body?’ On the relationship between machines and organisms
458
in media philosophy. Cultural Studies, 30(4), 610–629.
459
8. Belgiu, M. and Drǎguţ, L. (2014). Comparing supervised and unsupervised multiresolution segmentation
460
approaches for extracting buildings from very high-resolution imagery. ISPRS Journal of Photogrammetry
461
and Remote Sensing, 96, 67–75
462
9. Bennett, R. (2016). Cadastral Intelligence, Mandated Mobs, and the Rise of the Cadastrobots. Presented at
463
FIG Working Week 2016, May 2-5, 2016. Christchurch New Zealand.
464
10. Bennett, R., Asiama, K., Zevenbergen, J.; Juliens, S. (2015). The Intelligent Cadastre. Presented at FIG
465
Commission 7/3 Workshop on Crowdsourcing of Land Information November 16-20, 2015. St Juliens,
466
21 of 23
11. Bennett, R., Gerke, M., Crompvoets, J., Ho, S., Schwering, A., Chipofya, M., ...; Wayumba, R. (2017, March).
468
Building Third Generation Land Tools: Its4land, Smart Sketchmaps, UAVs, Automatic Feature Extraction,
469
and the GeoCloud. In Annual World Bank Conference on Land and Poverty. World Bank.
470
12. Blaschke, T., Lang, S.; Hay, G. (Eds.). (2008). Object-based image analysis: spatial concepts for
knowledge-471
driven remote sensing applications. Springer Science & Business Media.
472
13. Brey, P. (2003). Theorizing Modernity and Technology. In Misa T.; Feenberg A. (Eds.), Modernity and
473
Technology (pp. 33–71). MIT Press.
474
14. Burns, T., Grant, C., Nettle, K., Brits, A.; Dalrymple, K. (2007). Agriculture and Rural Development
475
Discussion Paper 37 Land Administration Reform: Indicators of Success and Future Challenges.
476
Washington. Retrieved from http://www.worldbank.org/rural
477
15. Bush, V. (1945). As we may think. The Atlantic Monthly, July 1945.
478
16. Campbell, L., Campbell, B.; Dickinson, D. (1996). Teaching &Learning through multiple intelligences.
479
ERIC.
480
17. Chen, G., Haya, G.; St-Onge, B. (2011). A GEOBIA framework to estimate forest parameters from lidar
481
transects, Quickbird imagery and machine learning: A case study in Quebec, Canada. Int. J. Appl. Earth
482
Observ. Geoinf. (2011), 1–10.
483
18. Crommelinck, S., Bennett, R., Gerke, M., Nex, F., Yang, M. Y.; Vosselman, G. (2016). Review of automatic
484
feature extraction from high-resolution optical sensor data for UAV-based cadastral mapping. Remote
485
Sensing, 8(8).
486
19. Djenaliev, A. (2013). Object-based image analysis for building footprints delineation from satellite images.
487
In Proceedings of the Seventh Central Asia GIS Conference GISCA’13 “Connected Regions: Societies,
488
Economies and Environments”, May 2-3, 2013 (pp. 55–62). Kazakhstan: Kyrgyz State University of
489
Construction, Transport and Architecture.
490
20. Dold, J.; Groopman, J. (2017). Geo-spatial Information Science The future of geospatial intelligence. The
491
future of geospatial intelligence, 20(2), 5020–151.
492
21. Donnelly, G. J. (2012). Fundamentals of land ownership, land boundaries, and surveying.
493
Intergovernmental Committee on Surveying & Mapping.
494
22. Drăguţ, L., Csillik, O., Eisank, C.; Tiede, D. (2014). Automated parameterisation for multi-scale image
495
segmentation on multiple layers. ISPRS Journal of Photogrammetry and Remote Sensing, 88, 119–127.
496
23. Franssen, M., Lokhorst, G.-J.; van de Poel, I. (2015). Philosophy of Technology. (Edward N. Zalta, Ed.) (Fall
497
2015). Metaphysics Research Lab, Stanford University.
498
24. Gao, M., Xu, X., Klinger, Y., Van Der Woerd, J.; Tapponnier, P. (2017). High-resolution mapping based on
499
an Unmanned Aerial Vehicle (UAV) to capture paleoseismic offsets along the Altyn-Tagh fault, China.
500
Scientific Reports, 7(1), 8281.
501
25. García-Pedrero, A., Gonzalo-Martín, C.; Lillo-Saavedra, M. (2017). A machine learning approach for
502
agricultural parcel delineation through agglomerative segmentation. International Journal of Remote
503
Sensing, 38(7), 1809–1819.
504
26. GLTN. (2015). Valuation of unregistered lands and properties. a new tenure security enhancement
505
approach for developing countries. Retrieved from
506
http://www.gltn.net/index.php/component/jdownloads/send/2-gltn-documents/2243-valuation-of-507
unregistered-lands-and-properties-brief-eng-2015?option=com_jdownloads
508
27. Goldstein, S.; Naglieri, J. A. (Eds.). (n.d.). Encyclopedia of Child Behavior and Development. Springer
509
Science+Business Media LLC 2011.
510
28. González, W. J. (Ed.). (2005). Science, technology and society: A philosophical perspective. Netbiblo
511
29. Grosan, C.; Abraham, A. (2011). Intelligent Systems (Vol. 17). Berlin, Heidelberg: Springer Berlin
512
30. Koeva, M., Muneza, M., Gevaert, C., Gerke, M.; Nex, F. (2016). Survey Review Using UAVs for map creation
513
and updating. A case study in Rwanda Using UAVs for map creation and updating. A case study in
514
Rwanda. Survey Review.
515
31. Kohli, D., Bennett, R., Lemmen, C., Kwabena, A.; Zevenbergen, J. (2017). A Quantitative Comparison of
516
Completely Visible Cadastral Parcels Using Satellite Images: A Step towards Automation. In FIG Working
517
Week 2017. Surveying the world of tomorrow - From digitalisation to augmented reality, May 29–June 2,
518
2017. Helsinki, Finland.
519
32. Lemmen, C. H. J.; Zevenbergen, J. A. (2010). First experiences with a high-resolution imagery-based
520
adjudication approach in Ethiopia. In Deininger, K., Augustinus, C., Enemark, S., Munro-Faure, P.(eds.),
521
Preprints (www.preprints.org) | NOT PEER-REVIEWED | Posted: 29 May 2019 doi:10.20944/preprints201905.0342.v1
Innovations in land rights recognition, administration, and governance; Proceedings from the annual
522
conference on land policy and administration. The International Bank for Reconstruction and
523
Development/The World Bank.
524
33. Lennartz, S. P.; Congalton, R. G. (2004). Classifying and Mapping Forest Cover Types Using Ikonos
525
Imagery in the Northeastern United States. In ASPRS Annual Conference Proceedings (pp. 1–12). Denver,
526
Colorado.
527
34. Li, X.; Shao, G. (2014). Object-Based Land-Cover Mapping with High Resolution Aerial Photography at a
528
County Scale in Midwestern USA. Remote Sensing. 6. 11372-11390.
529
10.3390/rs61111372#sthash.mKApC6Mz.dpuf.
530
35. Linn, M. C.; Petersen, A. C. (1985). Emergence and characterization of sex differences in spatial ability: a
531
meta-analysis. Child Development, 56(6), 1479–98.
532
36. Luo, X., Bennett, R. M., Koeva, M.; Lemmen, C. (2017). Investigating Semi-Automated Cadastral
533
Boundaries Extraction from Airborne Laser Scanned Data. Land, 6(3), 60.
534
37. Luo, X., Bennett, R., Koeva, M.; Quadros, N. (2016). Cadastral boundaries from point clouds? Towards
535
semi-automated cadastral boundary extraction from ALS data. Retrieved May 23, 2017, from
536
https://www.gim-international.com/content/article/cadastral-boundaries-from-point-clouds
537
38. McBride, F. M.; Burgman, M. A. (2011). What is expert knowledge, how is such knowledge gathered, and
538
how do we use it to address questions in landscape ecology? In A. H. Perera, C., Drew; C., Hohn (Eds.),
539
Expert Knowledge and Its Application in Landscape Ecology (p. 322). Springer Science+Business Media,
540
LLC 2012.
541
39. McCarthy, J., Minsk, M. L., Rochester, N.; Shannon, C. E. (1955). A Proposal for The Dartmouth Summer
542
Research Project on Artificial Intelligence. Retrieved August 17, 2017, from
http://www-543
formal.stanford.edu/jmc/history/dartmouth/dartmouth.html
544
40. Mckeown, D. M., Bulwinkle, T., Cochran, S., Harvey, W., Mcglone, C.; Shufelt, J. A. (2000). Performance
545
evaluation for automatic feature extraction. International Archives of Photogrammetry and Remote
546
Sensing, XXXIII(B2).
547
41. Mumbone, M., Bennet, R., Gerke, M.; Volkmann, W. (2015). Innovations in boundary mapping: namibia,
548
customary lands and UAVS. In World Bank conference on land and poverty. Washington
549
42. O’Neil-Dunne, J. (2011). Automated Feature Extraction. LiDAR, 1(1), 18–22.
550
43. O’Neil-Dunne, J.; Schuckman, K. (2017). GEOG 883 Syllabus - Fall 2018 Remote Sensing Image Analysis
551
and Applications. John A. Dutton e-Education Institute, College of Earth and Mineral Sciences, The
552
Pennsylvania State University. Retrieved from
https://www.e-553
education.psu.edu/geog883/book/export/html/230
554
44. Payette, J. (2014). Resolving Legitimacy Deficits in Technology Startups through Professional Services
555
Practices. Technology Innovation Management Review, 4(6).
556
45. Persello, C.; Bruzzone, L. (2010). A Novel Protocol for Accuracy Assessment in Classification of Very
High-557
Resolution Images. Geoscience and Remote Sensing, IEEE Transactions, 48(3), 1232–1244.
558
46. Peter-Paul Verbeek. (2005). What Things Do: Philosophical Reflections on Technology, Agency, and
559
Design. (Robert P. Crease, Ed.). University Park, Pennsylvania: Pennsylvania state University Press.
560
47. Quackenbush, L. J. (2004). A Review of Techniques for Extracting Linear Features from Imagery.
561
Photogrammetric Engineering & Remote Sensing, 70(12), 1383–1392.
562
48. Radoux, J.; Bogaert, P. (2017). Good Practices for Object-Based Accuracy Assessment. Remote Sensing, 9(7),
563
646.
564
49. Rizos, C. (2017). Springer Handbook of Global Navigation Satellite Systems. In P. J., Teunissen & O.
565
Montenbruck (Eds.), Computers and electronics in agriculture (pp. 1011–1037). Springer, Cham.
566
50. Roberts, P. (2013). Academic Dystopia: Knowledge, Performativity, and Tertiary Education. Review of
567
Education, Pedagogy, and Cultural Studies, 35(1), 27–43.
568
51. Rogers, S., C.Ballantyne; B.Ballantyne. (2017). Rigorous Impact Evaluation of Land Surveying Costs:
569
Empiricial evidence from indigenous lands in Canada.Paper prepared for presentation at the “2017 World
570
bank conference on land and poverty” The World Bank - Washington DC, March 20-24, 2017.
571
52. Sacasas, M. (2015). Humanist Technology Criticism. Retrieved February 12, 2018, from
572
23 of 23
53. Sahar, L., Muthukumar, S.; French, S. P. (2010). Using aerial imagery and GIS in automated building
574
footprint extraction and shape recognition for earthquake risk assessment of urban inventories. IEEE
575
Transactions on Geoscience and Remote Sensing, 48(9), 3511–3520.
576
54. Saito, S.; Aoki, Y. (2015, February). Building and road detection from large aerial imagery. In Image
577
Processing: Machine Vision Applications VIII (Vol. 9405, p. 94050K). International Society for Optics and
578
Photonics.
579
55. Salehi, B., Zhang, Y., Zhong, M.; Dey, V. (2012). Object-based classification of urban areas using VHR
580
imagery and height points ancillary data. Remote Sensing, 4(8), 2256–2276.
581
56. Schade, S. (2015). Big Data breaking barriers - first steps on a long trail. ISPRS - International Archives of
582
the Photogrammetry, Remote Sensing and Spatial Information Sciences, XL-7/W3, 691–697.
583
57. Smith, B.; Varzi, A. C. (1997). Fiat and bona fide Boundaries: Towards an ontology of spatially extended
584
objects. Philosophy and Phenomenological Research, 103–119.
585
58. Smith, B.; Varzi, A. C. (2000). Fiat and Bona Fide Boundaries. Philosophy and Phenomenological Research,
586
60(2), 401–420.
587
59. Smith, C., McGuire, B., Huang, T.; Yang, G. (2006). The history of artificial intelligence. University of
588
Washington, 27.
589
60. Sun, W., Chen, B.; Messinger, D. W. (2014). Nearest-neighbor diffusion-based pan-sharpening algorithm
590
for spectral
591
61. Suresh, S., Merugu, S.; Jain, K. (2015). Land Information Extraction with Boundary Preservation for High
592
Resolution Satellite Image. International Journal of Computer Applications (0975 – 8887), 120(7), 39–43.
593
62. Swer, M.G. (2014). Determining technology: Myopia and dystopia. South African Journal of Philosophy,
594
33(2), 201–210.
595
63. Trimble. (2014). eCognition Developer 9.0–Reference Book.
596
64. Turing, A. M. (1950). Computing Machinery and Intelligence. Mind, 49, 433–460.
597
65. Van Coillie, Frieke MB, et al. "Variability of operator performance in remote-sensing image interpretation:
598
The importance of human and external factors." IJRS 35.2 (2014): 754-778.
599
66. Waelbers, K. (2011). Doing good with technologies: taking responsibility for the social role of emerging
600
technologies. Springer.
601
67. Wassie, Y., Koeva, M. N., Bennett, R. M.; Lemmen, C. H. J. (2017). A procedure for semi-automated
602
cadastral boundary feature extraction from high-resolution satellite imagery. Journal of Spatial Science, 1–
603
18.
604
68. Williamson, I. P. (1985). Cadastral and land information systems in developing countries. Australian
605
Surveyor, 33(1), 27–43.
606
69. Williamson, I. P. (1997). The justification of cadastral systems in developing countries. Geomatica, 51(1),
607
21–36.
608
70. Williamson, I. P. (2000). Best practices for land administration systems in developing countries. In
609
International conference on land policy reform, 25-27 July 2000. Jakarta: The World Bank.
610
71. Windrose. (2017). Evolution of Surveying Techniques - Windrose Land Services. Retrieved July 3, 2017,
611
from https://www.windroseservices.com/evolution-surveying-techniques/
612
72. Winner, L. (1997). Technology Today: Utopia or Dystopia? (Technology and The Rest of Culture). Social
613
Research, 64(3), 1–12.
614
73. Winston, H. P. (1993). Artificial intelligence (3rd ed.). Library of congress.
615
74. Xie, S.; Tu, Z. (2015). Holistically-nested edge detection. In Proceedings of the IEEE international conference
616
on computer vision (pp. 1395-1403).
617
75. Yomralioglu, T.; McLaughlin, J. (Eds.). (2017). Cadastre: Geo-Information Innovations in Land
618
Administration. Springer.
619
76. Zevenbergen, J. (2004). A Systems Approach to Land Registration and Cadastre. Nordic Journal of
620
Surveying and Real Estate Research, 1.
621
77. Zevenbergen, J.; Bennett, R. (2015). The visible boundary: more than just a line between coordinates. In
622
Proceeding of GeoTechRwanda, November, 18-20, 2015. Kigali, Rwanda.
623
624
Preprints (www.preprints.org) | NOT PEER-REVIEWED | Posted: 29 May 2019 doi:10.20944/preprints201905.0342.v1