Performance and Implementation of
EU Industrial Policy
Scoreboard
Competitiveness
Performance
Member States’
Industrial
Commission staff working document
Industrial Performance Scoreboard
and
Member States’ Competitiveness
Performance and Implementation of EU
Industrial Policy
SWD(2013)
A Europe 2020 Initiative
2013 EDITION
Foreword by Vice-President Antonio Tajani
Growth and employment can only be achieved through competitive enterprises. The task of policy-makers is to create an environment where entrepreneurs can fulfil their ambitions and contribute to a sustainable and balanced growth of our economies. This has been and continues to be my goal.
The purpose of this annual report drafted by the Commission – pursuant to Article 173 of the Treaty – is to review and compare the industrial performance and policies of the EU as a whole and of individual Member States. It builds upon the country-specific recommendations and supporting documents of the May 2013 European Semester, feeds into the policy monitoring cycle of the next cycle, and focuses on microeconomic policies where it deepens the analysis. This report will help policy-makers to focus on obstacles to growth, and advocates the learning of lessons from good practices. There is considerable scope for this, as the differences in competitiveness between the Member States are considerable.
In addition to country-specific problems like low productivity, lacking innovation capacity, and high administrative burden, there are common problems that affect many Member States. These include access to finance, access to markets, the price of energy, and the lack of investment. You will find a deeper analysis of these issues in this report.
For my part, I would like to emphasise the importance of industry as the cornerstone of our economies. Those Member States with a diversified economy and strong industrial base have fared much better in the crisis. But a strong industrial base is not built on sand. It needs high levels of skills, it needs constant innovation and investment.
We need a better single market for the products and services of our industries. But Europe is not enough, especially as 70% of the growth by 2020 will be in the emerging countries. To support our exporting industries, I have initiated missions of growth to Latin America, the United States, North Africa, Russia and China. I will continue these missions, in particular to Burma, Thailand and Vietnam.
I hope that his report will help to put the performance and policies of Europe and its Member States into a wider context, and that it will promote reform and renewal.
CONTENTS
Executive Summary ... 4
1
Industrial performance scoreboard ... 8
1.1. Introduction... 8
1.2. The real magnitude of the impact of this crisis on industry ... 9
1.3. Why is recovery taking so long? ... 12
1.4. Why is investment unresponsive? ... 22
1.5. Overall performance in Member States ... 24
1.6. Innovation and Sustainability ... 30
1.7. Export performance ... 34
1.8. Business environment and infrastructure ... 37
1.9. Finance and investment ... 42
1.10. Productivity and skills ... 44
2
Implementation of EU industrial policy ... 47
2.1. Introduction... 47
2.2. Investment in innovation: state of play in the six priority action lines ... 47
2.3. Access to markets ... 55
2.4. Access to finance ... 60
2.5. Human capital and skills development ... 63
3
Overview of progress by policy area in Member States ... 65
3.1. Innovation and sustainability ... 66
3.2. Business environment, services and infrastructure ... 74
3.3. Improvements in public administration ... 78
3.4. Finance and investment ... 84
3.5. Skills ... 89
4
Country chapters ... 92
4.1. Belgium ... 92
4.2. Bulgaria ... 98
4.3. Czech Republic ... 103
4.4. Denmark ... 110
4.5. Germany ... 116
4.7. Ireland ... 128
4.8. Greece ... 134
4.9. Spain ... 142
4.10. France ... 150
4.11. Croatia ... 156
4.12. Italy ... 163
4.13. Cyprus ... 169
4.14. Latvia ... 174
4.15. Lithuania ... 180
4.16. Luxembourg ... 186
4.17. Hungary ... 191
4.18. Malta ... 197
4.19. Netherlands ... 202
4.20. Austria ... 208
4.21. Poland ... 215
4.22. Portugal ... 221
4.23. Romania ... 228
4.24. Slovenia ... 235
4.25. Slovakia ... 241
4.26. Finland ... 247
4.27. Sweden ... 253
4.28. United Kingdom ... 260
5
Annex: Methodology and indicators used ... 266
5.1. Definitions of the indicators... 266
5.2. Methodological note on clustering ... 281
Executive Summary
This annual report is prepared by the Commission pursuant to Article 173 of the Treaty on the Functioning of the European Union. The report reviews and compares the industrial performance of the EU as a whole and of individual Member States, based on indicators in the areas of industrial innovation and sustainability; business environment services and infrastructure; public administration; finance and investment; and skills. This year the report also covers the implementation of European industrial policy. The report focuses on the microeconomic policy aspects of growth and competitiveness, complementing the analysis of the European Semester 2013.1
Unusually harsh economic conditions, global macroeconomic uncertainties and structural difficulties have kept the short term outlook negative for European industry. Although the industrial performance of the economy has stabilised and our external performance has been improving, we have not yet returned to pre-crisis levels.
Annual figures at the end of June 2013 indicate that the contribution of manufacturing to gross value added in the EU has fallenfrom 15.4 % to 15.1 % a year ago, keeping us far from the 20 % goal as set by the October 2012 Industrial Policy Communication Update.2 In some countries there has been a decline, but the manufacturing sectors in Germany, Austria, Ireland, the Netherlands and the UK have been largely able to maintain their pre-crisis share in the EU’s manufacturing production. In Greece and Portugal manufacturing increased its relative size in 2012, and manufacturing grew strongly also in several catching-up economies such as Bulgaria, Romania, Czech Republic, Slovakia, Hungary, Lithuania and Latvia. There are successful elements of industrial policy on national level in several Member States and lessons can often be learned from partners within the EU.
1 Many of the reform areas referred to below and further in
this report have been the objects of recommendations in the context of the European Semester 2013; see
http://ec.europa.eu/europe2020/making-it-happen/country-specific-recommendations/index_en.htm.
2 COM (2012) 582.
We are now in the second dip of the industrial recession that, albeit less severe than the 2009 slump, risks stagnating European industry in the long run. Downside risks in financial markets and subdued macroeconomic conditions can only be dispelled if there is a return to growth. However, private investment remains low and unresponsive to Member State efforts as well as supply side measures at EU level.
Internationalisation efforts have produced results that are visible in the very strong export performance of European industry, but adjustment has been sluggish and there is a risk of fragmenting the single market. The scarcity of high technology skills and the need for retraining also constitute obstacles to speedy restructuring in the EU.
Two major factors jeopardise the successful implementation of industrial policy in Europe. First, remaining barriers in the internal market, fiscal consolidation, the prolonged period of bank deleveraging and low demand are contributing to a sluggish performance. Second, investment has remained well below its long-term trend, partly due to economic and political uncertainties. In 2012, investment in machinery and equipment – initially relatively resilient to the crisis – followed the decline of other components of gross fixed capital formation.
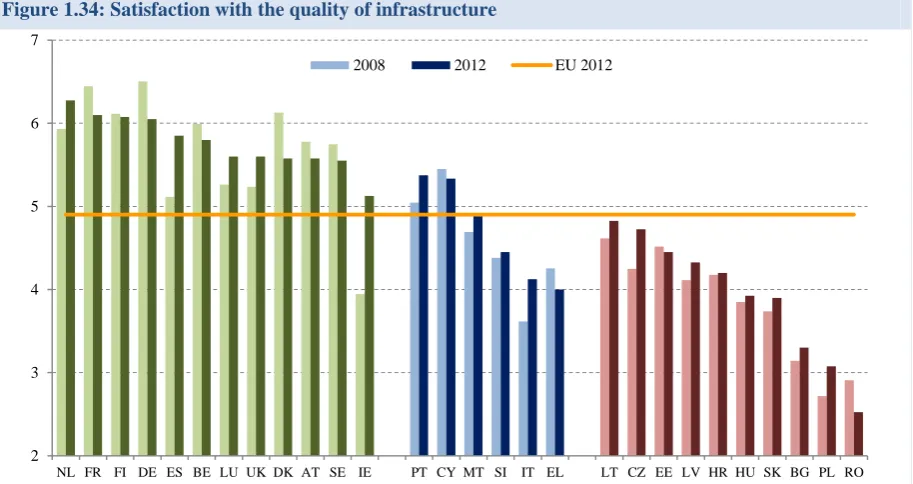
While the economies of individual Member States differ, their industrial competitiveness is affected by many common factors. In 2012, the Commission launched the Industrial Performance Scoreboard, assessing Member States’ performance across several dimensions: manufacturing productivity; educational attainment in manufacturing; export performance; innovation capacity; energy intensity; business environment; electricity prices; satisfaction with infrastructure; and bank lending and investment in equipment.
The consistent cluster performs well in all areas of competiveness (Sweden, Belgium, Finland, Germany, Luxembourg, Denmark, Austria, the Netherlands, Ireland, the United Kingdom, France and Spain).
The moderate cluster perform well in some
competitiveness areas but face difficulties and deterioration in many others (Slovenia, Portugal, Italy, Cyprus, Malta and Greece).
The catching-up countries face significant
challenges in many areas, but are quickly improving. For certain competitiveness indicators, the best of them perform as well or better than moderate or even some consistent performers (Estonia, the Czech Republic, Latvia, Lithuania, Slovakia, Hungary, Croatia, Poland, Romania and Bulgaria.)
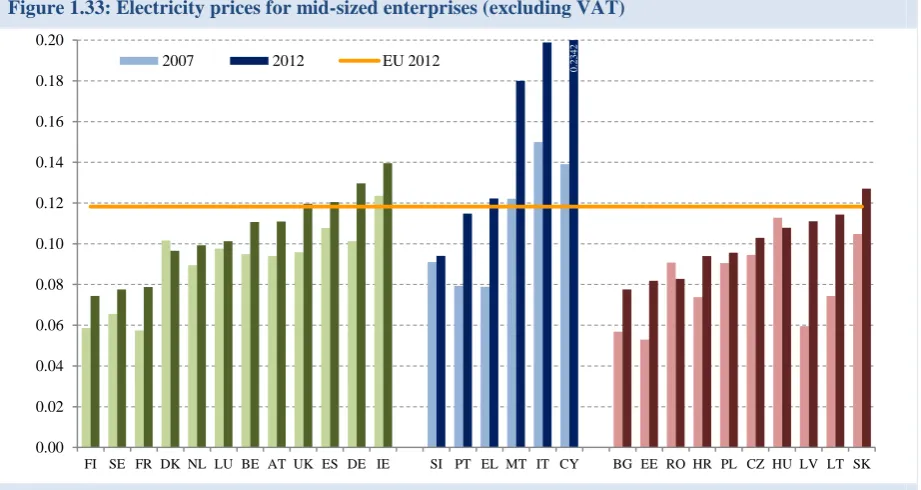
Real progress has been made in the business environment, exports and sustainability although many problems remain. For example, starting a company has become cheaper and easier; and exports have performed well. However, high energy prices pose a significant problem for industries in many Member States, especially as they have risen across the board over the last five years. Although world energy prices have risen, deficiencies in the internal market for energy, uncompetitive practices, restricted competition, and bottlenecks in infrastructure have also contributed to this situation. Overall, competition in sectors supporting industrial firms in 2012 (transport, energy, professional services) did not appreciably improve in 2012. Total factor productivity has remained stagnant despite apparently increasing labour productivity.
The Commission identified in 2012 six priority technology areas and established task forces to facilitate the development and commercialisation of these technologies. Many of the issues that need to be addressed are common to all innovation. Examples include the conditions for the commercialisation of innovation, the development of standards for new products, processes and materials. More investment in technology and skills are also identified in all these priority areas.
In addition, in certain cases specific investment in infrastructure is required. For example, clean cars require recharging or refuelling networks; and smart grids require interoperability standards. The
benefits of technologies such as sustainable construction, clean vehicles and advanced manufacturing only emerge in the long term but they entail large upfront investment. Therefore, targeted smart incentives are necessary to facilitate the introduction of these technologies. Some of these incentives, including public procurement, may benefit several sectors.
Continuing implementation of reforms on innovation, sustainability, business environment, public administration and access to finance are prerequisites for sustainable growth.
Many Member States have increased their innovation performance since 2008, although the relative performance differs. It seems that there is no longer a convergence of innovation performance between the Member States, but a danger of a growing innovation divide within the EU.3 This danger is the more acute as budgetary restraints have led many Member States to squeeze their research and development budgets. To some extent this could be alleviated with higher private investment. The most innovative Member States have invest more in research as a share of GDP, because of higher private investment (about 2 % of GDP), but also because of higher public R&D investments (about 1 % of GDP).
The question for all research and innovation policies is to what extent they contribute to the creation of new knowledge-intensive jobs, high-tech exports or intellectual assets. Also here Member States perform unevenly, as some R&D systems, business environments, and their links are more effective in this than others. However, the problem is widely recognised, and it is being increasingly monitored and evaluated to improve the outcome.
By definition, the emergence of innovative new products and services will entail the transfer of resources from declining industries to areas of growth, but managing this process is a challenge for many Member States. One essential component is to upgrade skills. Here, Member States are increasingly responding to the demands of the market, involving the private sector as user and provider of skilled labour. Examples include
improved and extended traineeships,
apprenticeships and vocational training, as many Member States have introduced reforms and action plans aimed at improving the involvement of employers and the coordination of the provision of vocational education and training and the skills demands emerging from the market.
For growth to be sustainable, we need to continue to reduce the energy and carbon intensity of our economies. Considerable improvement has been achieved by industrial restructuring in the catching-up Member States, although many still have some distance to go to reach the EU average. This is likely to be economically profitable as EU energy prices increased in 2012 (5.8 % for industrial users), despite the weakness of the economy.
Member States are also seeking to extend resource efficiency beyond energy to waste and raw materials.
Businesses that focus on environmental goods and services are benefiting from the trend towards sustainability, although estimates vary.4 But for full benefits to materialise, stable policies in resource efficiency, climate and energy, and robust regulatory environment, including virtual platforms, would be beneficial in order to facilitate the efficient matching of supply and demand.
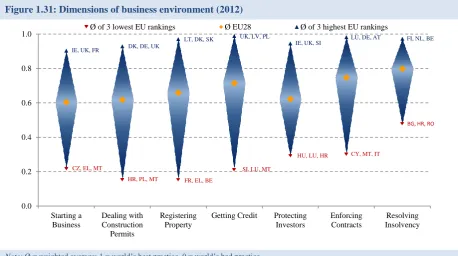
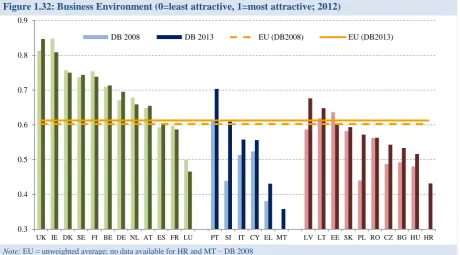
Member States have improved their business environment considerably, keeping the EU average high. The time needed to start a company has decreased in 13 and start-up costs have come down in 22 Member States. However, many competitors are improving their business environment even faster. While the top EU performers are among the best in the world, the worst Member States can be found in the lowest quartile. Clearly, there is a lot of room for improvement. And in many cases the Member States have been focusing on the narrow set of indicators of the World Bank’s Doing Business that are not enough to achieve a fully favourable business environment.
Modernising public administration requires strengthening strategic design and implementation: ministries and public authorities at national, regional and local levels should improve their
4 Employment in eco-industries grew an estimated 2. 8 %
annually between 2000 and 2008, although estimates for 2009-12 are much higher at over 8 %.
http://ec.europa.eu/environment/enveco/jobs/pdf/jobs.pdf.
capacities to define key challenges, identify the main priorities to address these challenges, assess the economic, social and environmental impact of interventions, and design appropriate action plans with clear milestones. However, an integrated approach is crucial: in order to avoid a proliferation of strategies on public administration reform, the development and implementation of such strategies should be closely coordinated across all relevant departments.
An efficient public administration is an essential factor in policies promoting jobs, growth and competitiveness. They need to implement a stable, transparent and consistent regulatory framework that crucial for new investment. Further, reduction of the administrative burden on businesses, and strengthening the administrative capacity to support business services, in particular online, and modernisation information infrastructures, are all essential. Sustainable growth and competitiveness therefore require more effective, client-oriented, and forward-looking public administrations that can manage risks, have a systematic innovation policy, can manage scarce resources well, and can effectively coordinate and implement policies.
Similarly, an effective high-quality and independent justice system contributes to trust and stability.5 Predictable, timely and enforceable judicial decisions are an important part of an attractive business environment, and conversely, slow and outdated legal systems have a major negative economic impact.
The most prominent areas of reform are reducing the administrative burden on firms, enhancing capacity for strategic and budgetary planning, and ensuring strategic and effective human resources management. Further, in particular for countries with multi-tiered administrative structures, improving coordination between levels of administration has been on the agenda. Reforms have also sought to strengthen the corporate governance of state-owned enterprises, and to improve the efficiency, quality and independence of the judicial system. Many Member States have a lot to do in fighting corruption, as well as trying to
5 More details are available in the EU Justice Scoreboard: A
improve the efficiency of local government, tax collection authorities and various regulatory bodies. In many ways e-government can help in achieving reform goals, but in many cases there is a need to adapt administrative procedures to its use, and it is necessary to link the different administrative information systems.
Access to finance has deteriorated in many Member States, also in the past year. Euro area banks have tightened their credit standards because of their risk perceptions, cost of funds and balance sheet constraints. Combined with borrower risk and macroeconomic uncertainty, this has led to constrained lending volumes and high interest rates, in particular in the countries most affected by the crisis. For a lasting solution, a stabilisation of the banking sector is needed.
As most firms are dependent on bank lending for their working capital and investments, policy measures, including loan guarantees and equity investment programmes, have been adopted in almost all Member States. In the longer run, it is likely that corporate finance will be more market and less bank-based, in the short term, no alternative source can replace bank loans. The agreements to gradually pay the arrears due by the public administrations in many of the crisis countries have been clear and positive results for many SMEs.
Investment is essential for growth and the EU remains an attractive environment for investments despite its share of global foreign investment declining substantially, from 45 % in 2001 to 23 % in 2012. Foreign direct investment has concentrated on business services, software and cars. Many Member States have introduced measures that seek to attract more investment by targeting sectors and countries, and improving cooperation among investment promotion actors.
Foreign investment is only one road to increased
openness and internationalisation.
Internationalisation and competitiveness of firms are linked, as exposure to global competition forces firms to improve. In addition, the a large share of global growth will come from outside of Europe, and to benefit from this, many Member States have
introduced policies to support the
1
Industrial performance scoreboard
1.1.
Introduction
The worst financial and sovereign debt crisis in the history of the EU first hit European industry more than five years ago. Despite the resulting instabilities, European industry has remained competitive in international comparison. Although manufacturing exports were hit in 2008, they have since then grown 20 % compared to the pre-crisis level. In particular, European exports to emerging markets have grown faster than their GDP. Currently, Europe’s trade surplus in manufactured products is over a billion euros a day, making EUR 365 billion per year, almost three times more than in 2006.
However, as the Commission’s industrial policy communication pointed out last October,6 there are serious reasons for concern. Economic activity remains weak and the impressive trade surplus is not just the result of a good export performance but also due to the very low imports because of the length of the crisis.
Most importantly, investment remains subdued. Over five years European industry has endured the consequences of both an intense deleveraging of balance sheets, and the fall in internal demand, which has depressed our investment and innovation rates thereby compromising our future competitiveness.
But industry is reacting positively. The process of reallocation of resources is under way – they are moving away from non-tradable sectors into productive industrial activities. However, this process has not been rapid enough. Adjustments have also been slow in the trade and investment flows within the internal market, across sectors of activity, production locations, and between firms, hampering the growth of efficient emerging SMEs. The result is excess capacity in some industrial sectors and high unemployment rates.
This chapter presents a snapshot of the current state of European manufacturing, a sort of thermometer
6 A stronger European industry for growth and economic
recovery. Industrial policy communication update. COM(2012) 582.
reading of the state of our industry, identifying key impact of the crisis on our current and future competitiveness. This should contribute to improving the development and implementation of EU policies to speed up the recovery and get us back on track for increased competitiveness in the medium and long term. It also presents the developments in Member States. The Industrial Performance Scoreboard is designed to indicate changes in the industrial competitiveness of Member States over time. It is based on ten policy indicators in five areas that all affect the competitiveness of industry: innovation and sustainability; export performance; business environment and infrastructure; finance and investment; and productivity and skills.
The long-term competitiveness and productivity of European industry are tied to the ability to successfully invest in research and innovation. Higher innovation capacity then drives structural change in Member States’ economies towards production with higher added value and more jobs.
Technological innovation in turn facilitates the transition to a more resource-efficient economy. And an efficient use of raw materials and energy can mitigate the negative impact of their rising and volatile prices on industry’s competitiveness.
Exports are an important source of growth, in particular when domestic demand is subdued. The ability to integrate production into global value chains and to participate in international trade is an essential part of a competitive economy. However, some Member States have been better at using the growth potential of international trade than others. The most successful of them increasingly export advanced products that are close to the technology frontier, as well as knowledge-intensive services, relying on their strength in non-price competitiveness. The catching-up economies have expanded their export market shares by benefiting from foreign investments in export-oriented manufacturing.
and smart regulatory framework, coupled with efficient public administration and effective judicial systems, will enable businesses to focus on their core activities and to minimise unnecessary compliance burden and transaction costs. In particular, an easy start-up environment, competition-promoting regulation, easy access to finance, and openness to trade are important in creating new business activity and investment.
In the EU, bank loans have traditionally been the dominant source of investment funding, in particular for SMEs. The tightening of credit standards and the banks’ continued deleveraging
have caused the supply of credit to deteriorate in many Member States, and rising interest rate differentials reflect new fragmentation and a reversal in the integration of the EU financial markets.
Finally, a transition to a more innovative and knowledge-intensive economy is only possible if the skills base improves. Modern manufacturing needs a highly-skilled workforce, and in a fast-changing environment, continuous upgrading of acquired skills is essential to ensure their continuing relevance in the labour market.
1.2.
The real magnitude of the impact of this crisis on industry
The October 2012 communication focused on the declining share of manufacturing in EU GDP. For the first time, it proposed reversing the declining contribution of manufacturing value added, aiming at raising the share of manufacturing in GDP to 20 %. This proposal underlined the importance of manufacturing and productive activities for increasing the resilience of the EU economy, and stressed the need to diversify the composition of our GDP.
[image:11.595.68.525.467.703.2]In advanced open economies, the share of manufacturing tends to decline and that of services to grow over time, measured as the share of value added to GDP. This is at least partly due to the more competitive environment and higher productivity of manufacturing, as this leads to slower price increases compared to services.
Figure 1.1: Manufacturing GVA as percentage of total GVA generated by the private sector
Sources: EUROSTAT, Bureau of Economic Analysis (BEA), World Bank
This is driven mainly by the relative changes in the prices for manufactured goods and services. In fact, if we look at the share of manufacturing in gross
value added generated by the private sector in EU-27 in real terms, i.e. discounting for the lower rates of growth in the prices of manufactured goods, the
10 12 14 16 18 20 22 24
2000 2001 2002 2003 2004 2005 2006 2007 2008 2009 2010 2011 2012
share of manufacturing over private gross value added remained relatively stable around the 20 % mark until 2008, when it dropped considerably. The same applies for instance to the US throughout the period considered, where the share of manufacturing in GDP increased by nearly one percentage point during the latest recovery.
However, after 2009 there has been a considerable difference between the US and the EU. While industrial production in the US has recovered back to pre-crisis levels, in Europe it had a short-lived recovery and a second dip in 2012. In other words, despite the excellent performance of EU manufacturing exports, the fall in internal demand and the deleveraging process have again lowered the value added of manufactured goods produced in Europe. This development justifies the attention paid by the Commission on the evolution of manufacturing in the EU.
There are two main elements in the evolution of the crisis that call for the attention of policy makers.
The first is the protracted impact of the crisis. If we compare the impact in the three most developed industrial areas of the world, Japan, the US and Europe, interesting differences appear in production, employment and access to credit. Figure 1.2 shows that contrary to the US experience, it is taking longer for the EU industry to recover, although not as long as in the case of Japan,
The second important development is that investment remains stubbornly unresponsive in the EU. Since the onset of the crisis, our investment level has fallen by nearly four percentage points of GDP, from 21.1 % in 2007 to 17.5 % by June 2013. The dismal evolution of gross fixed capital formation is mostly due to the collapse of construction-related investment, as investment in equipment, metal products and machinery has remained relatively resilient during the crisis. Still, even there investment has been falling again since 2012. Investment by non-financial corporations has been relatively resilient compared to investment in services.
Figure 1.2: Evolution of investment components in the EU (2005=100)
Sources: EUROSTAT
Industrial production
Manufacturing production fell considerably in US, Europe and Japan in 2009 (figure 1.3). However, the post-crisis recovery has been faster and more sustained in the US. Manufacturing production in the US, which is a smaller part of the economy than
in the EU, has remained relatively stable in real terms throughout the whole period. However, in Europe, industrial production had a second dip in 2012. In Japan, industrial output had already been stagnant since the 1990s and suffered a more severe
80 85 90 95 100 105 110 115 120
2005 2006 2007 2008 2009 2010 2011 2012
Contruction
Dwellings
Equipment
Metal prod and machinery
blow although it is recovering now. The same path has been followed by most industrial sectors in the three main trading blocks. In Europe most sectors
[image:13.595.68.530.497.743.2]remain below 2008 output levels, with the exception of pharmaceuticals and food, while most sectors have recovered in the US.
Figure 1.3: Manufacturing production indexes (2008=100)
Sources: EUROSTAT, Bureau of Economic Analysis (BEA), Ministry of Economy, Trade and Industry of Japan
Industrial employment
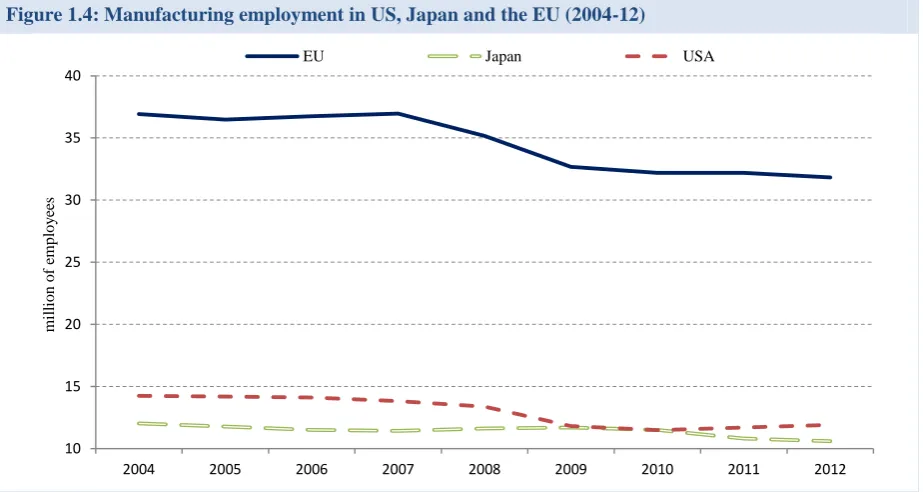
Over 3.8 million jobs have been lost in manufacturing in Europe since the beginning of the crisis and this trend continues (figure 1.4). In the US, manufacturing job losses have been smaller and almost 500 000 jobs have been created in
recent years. Following the 1990s crisis, employment in manufacturing in Japan remained stable in the 2000s, with deterioration since the crisis hit.
Figure 1.4: Manufacturing employment in US, Japan and the EU (2004-12)
Sources: EUROSTAT, Bureau of Labour (BEA), Ministry of Economy, Trade and Industry of Japan.Note that there is a break in the employment series of the EU for 2008.
75 80 85 90 95 100 105 110
2004 2005 2006 2007 2008 2009 2010 2011 2012
EU Japan USA
10 15 20 25 30 35 40
2004 2005 2006 2007 2008 2009 2010 2011 2012
EU Japan USA
mi
ll
io
n
o
f
emp
lo
y
ee
Bank credit
Bank credit fell sharply in 2009, but while it bounced back in the US soon after, it has not yet recovered in the EU (figure 1.5). Over the last decade, the prolonged stagnation of the Japanese economy has kept loans to non-financial
corporations mostly below the rapid growth rates seen in the US and Europe. Although the crisis also hit bank loans in Japan, the recently implemented expansionary monetary policy has been reflected in loan growth.
Figure 1.5: Year-on-year growth of loans to non-financial corporations
Sources: ECB, Federal Reserve, Bank of Japan
1.3.
Why is recovery taking so long?
There is no single factor explaining why recovery in EU industry is so difficult. Rather, we must look at a set of factors including aggregate demand conditions, access to finance and deleveraging, barriers to effective restructuring and a prolonged uncertainty in the policy environment.
1.3.1
Access to credit
The high volume of debt accumulated before the crisis is a heavy burden for many firms that find it difficult to roll over bank credits. Constrained access to credit has become a serious threat to the survival of significant parts of Europe’s competitive industries. Loans to non-financial corporations have not yet recovered from the crisis and lending activity continues to decrease in the euro area. Approximately third of euro area SMEs were
unsuccessful in applying a loan, or were discouraged from asking for a loan they needed in March 2013. There is a wide regional disparity with only 10 % of SMEs facing such difficulties in Germany, against 50 % in Spain. The situation is also very uneven across firm sizes. Larger European firms have been able to tap into the bonds markets in the past few years while SMEs have had a harder time diversifying their financing sources.
The constrained bank lending in EU is in contrast to the US, where there was a 30 % fall in lending at the height of the crisis but a growth of 10 % year-on-year since 2011. This difference is explained at least in part by the larger amount of non-performing loans in some EU countries, making banks much more prudent with their new lending.
-30 -20 -10 0 10 20 30
2004Q1 2005Q1 2006Q1 2007Q1 2008Q1 2009Q1 2010Q1 2011Q1 2012Q1 2013Q1
Euro area (changing composition) Japan USA
Figure 1.6: Non-performing loans as a share of total loans
Source: World Development Indicators,World Bank
Difficulties encountered by many European firms in gaining access to credit are reflected in the increasing trend displayed by nonperforming loans in Europe, which feeds back into the difficulties of obtaining credit (Figure 1.6). These difficulties are due to several factors. First, the process of deleveraging reduces the small volumes of credit available to roll over existing debt and to finance
new projects. In addition, the crisis and the subdued economic conditions have an impact on the volume of nonperforming loans that has increased considerably in some countries. According to the ECB, this percentage has doubled in Spain or Italy since 2008 while it has remained low or constant, or has even decreased in others (Germany).
Figure 1.7: Share of non-performing loans of the total in Spain by sector
Source: Bank of Spain
0 2 4 6 8 10 12
2000 2001 2002 2003 2004 2005 2006 2007 2008 2009 2010 2011 2012
DE ES FR EU IT JP UK USA
% 0 5 10 15 20 25 30 35 M ar -0 4 Ju n -0 4 S ep -0 4 D ec -0 4 M ar -0 5 Ju n -0 5 S ep -0 5 D ec -0 5 M ar -0 6 Ju n -0 6 S ep -0 6 D ec -0 6 M ar -0 7 Ju n -0 7 S ep -0 7 D ec -0 7 M ar -0 8 Ju n -0 8 S ep -0 8 D ec -0 8 M ar -0 9 Ju n -0 9 S ep -0 9 D ec -0 9 M ar -1 0 Ju n -1 0 S ep -1 0 D ec -1 0 M ar -1 1 Ju n -1 1 S ep -1 1 D ec -1 1 M ar -1 2 Ju n -1 2 S ep -1 2 D ec -1 2 M ar -1 3
Industry Construction Services Real Estate
There is no detailed information about the sectoral distribution of these nonperforming loans at EU level but information from one of these countries suggests that industry is not the main sector responsible for the growth in ‘bad loans’ (Figure 1.7).
Restoring bank credit flows will be essential to avoid the strangling of perfectly viable business in many Member States. This must inevitably start by a healthy banking sector that can restore credit flows to firms. Yet, many firms are suffering disruptions in payments and the accumulation of arrears is representing a serious burden for the financing of the working capital in many parts of Europe.
1.3.2
Aggregate demand conditions
Aggregate demand remains subdued in the EU, being affected in particular by deleveraging by non-financial corporations that have moved from being borrowers to being savers since 2009. Given the fiscal balance imperative to ensure the sustainability of debt levels, governments have not been able to compensate by supplying internal demand.
Exports, mostly to the rest of the world, have been the main driver of industrial activity (figure 1.8). Although the rate of growth of total EU exports has noticeably decreased since 2011 reflecting a potential economic slow-down in emerging economies, export continues to be crucial for industrial activity in the EU.
Figure 1.8: External and internal EU trade
Source: EUROSTAT, CPB World Trade Monitor
The relatively small size of many exporting EU companies is a factor that is potentially limiting growth. Smaller firms wishing to expand face difficulties that might be hindering the reallocation of resources towards the exporting sector. Faster growth of efficient SMEs oriented towards export markets would contribute to the recovery and increase the competitiveness of our industry.
Overall, manufactured products represent more than 80 % of exports and generate a massive trade surplus for the EU (EUR 365 billion in 2012
compared to EUR 125 billion in 2006, nearly a threefold increase), an essential counterweight to the trade deficit in energy and raw materials.
A few sectors account for a sizeable share of this large trade surplus. These include road vehicles7 (an approx. EUR 120 billion surplus in 2012), industrial machinery and equipment (EUR 70
7 Looking more closely at the industrial product generating
the largest surplus, road vehicles, it is remarkable that extra-EU exports in 2012 were double those of ten years earlier whereas imports increased by only a third. 75
80 85 90 95 100 105 110 115 120
billion), pharmaceutical products (EUR 55 billion), aircrafts (EUR 28 billion), beverages (EUR 20 billion) and paper (EUR 14 billion). In all these sectors, the EU industry remains, sometime with a wide margin, the largest global player. Conversely, large trade deficits are sustained by the EU in a minority of industrial products such as clothing (EUR 47 billion.), office machines (EUR 48 billion), telecommunications equipment (EUR 40 billion) or non-ferrous metals (EUR 11 billion).
Interestingly, during the recession, the unit value of goods exported by the EU to the rest of the world has grown substantially, as shown in the graph below in the case of machinery and transport equipment: unit value remained basically flat until the start of the recession, remaining around the levels of 2000, and then, increased by more than 15 %. Trade with China is largely responsible for this trend.
Figure 1.9: Unit price of EU exports (2000=100)
Source: Eurostat
This suggests that the recession has made China an even more important market for the EU and that EU industry is selling higher value and more complex products to the rest of the world. This trend also suggests that China is investing heavily in capital goods. While this implies higher export revenues in the short term, it could have a drawback because it might imply a limited time horizon for these types of exports: as China climbs up the quality ladder and become increasingly competitive also in medium-high technology products EU competitiveness might be eroded in those markets. The picture is completely different for trade within the single market. Still taking the example of road vehicles, exports in 2012 were only 12 % above the level 10 years ago and still 17 % below the pre-crisis peak in 2007.
Studies demonstrate a direct link between internationalisation and firms’ competitiveness. International activities help companies to grow,
improve their competitiveness and support their long-term sustainability. However, most European SMEs depend on their domestic markets despite the opportunities created by the single market, and by globalisation. A quarter of European SMEs export or have exported at some point in the last three years.
EU SMEs are getting a higher share of their income from international markets: while in 2004 exports accounted for 20 % of the operating revenue of industrial exporting SMEs, in 2011 they had reached a ratio of 30 %.8 But in medium-to-high
8
These ratios were calculated from 5000-companies samples. Only those companies that reported export revenue were computed in the calculations. However, if we also included in our analysis those that did not record export revenue, ratios would turn out to be lower (about 4 % for all industry, 9 % for chemicals and between 4-6 % for computers, electrical equipment and motor vehicles), but the upward trend would remain.
90 100 110 120 130 140
value added sectors such as chemicals, computer, electronic and optical products, and electrical equipment, the increase is even more remarkable especially after 2009. Most exports have been to
other EU countries and only about 13 % of SMEs export to markets outside the EU.
Figure 1.10: Average export revenue/operating revenue ratio of exporting SMEs
Source: AMADEUS; Commission calculations
Trends in eco-industries
Employment in eco-industries has grown considerably9 in recent years, and these sectors have been identified10 as having future growth potential. Exports also show that eco-industries are doing well; the value of exports of environmental goods11 has gone up by about 50 % since 2007, although they did fall between 2011 and 2012, and their share of total EU exports rose from 0.28 % in 2005 to 0.68 % in 2012.
The relative composition of these environmental goods exports has changed over time. The value of exports of photosensitive semiconductor devices (including solar panels) tripled between 2007 and 2010. However, it has fallen since then due to competition, slower growth in some key markets, and falling prices.12 Currently the largest export category is air, gas and liquid filtering machinery, apparatus and components. In this area German, French, British and Italian firms have a significant share of a growing global market. Other environmental goods exports belong to numerous smaller categories, such as analysis apparatus, light-emitting diodes or non-electric water heaters, that in aggregate amount to about a quarter of the total and have shown as much more stable evolution pattern.
9 It has increased by about 180 000 jobs per year between 1999 and 2008, an annual growth rate of 7 %. Source: the European
Commission brochure ‘Sustainable Industry: Going for growth and resource efficiency’ and its related studies, available at
http://ec.europa.eu/enterprise/index_en.htm. More recent and harmonised data are not available for the EU as a whole. However national and sector-specific data already published point in the same direction.
10 See the Employment package by the European Commission ‘Towards a job-rich recovery’, COM(2012) 173.
11 Exports of environmental goods refers to intra- and extra- EU-27 exports of goods from ‘eco-industries’ divided by total intra- and
extra-EU-27 exports of goods (in nominal values). ‘Eco-industry’ refers to sectors whose products measure, prevent, limit, minimise or correct environmental damage. The trade codes considered to cover eco-industry goods are those identified in the Ecorys study on the ‘Competitiveness of the EU eco-industry’ (p 190/191) of 22 October 2009, carried out for DG Enterprise and Industry.
12 As photosensitive semiconductor devices are diverse products, it is difficult to cite a single figure for the sector as a whole. Market
research (for instance by the Frauenhofer Institute http://www.ise.fraunhofer.de/en/renewable-energy-data and Bloomberg New Energy Finance http://about.bnef.com) suggests that the price of photovoltaic modules fell by around 50 % in the period 2007-12. This confirms Swanson’s law, according to which the price of solar photovoltaic cells would drop 20 % each time industry capacity doubles.
15 20 25 30 35 40 45
2003 2004 2005 2006 2007 2008 2009 2010 2011
All industrial Chemicals
Figure 1.11: Exports of environmental goods, 2007-12, EUR billion
Source: Eurostat COMEXT
The degree of success of the internationalisation of SMEs varies widely from country to country. Recent studies have shown that firms in some countries face higher trade costs that prevent them from fully engaging in international trade.13 14 These relatively high trade costs result in firms being of a smaller size, which means that they cannot introduce innovation or boost their productivity to compete in foreign markets. The removal of trade barriers could contribute to an increase in the size, productivity and international competitiveness of firms. Policy-makers should focus on the barriers that hinder firms´ capacity to increase their size and to improve their export performance.
1.3.3
Integrating in global value chains
It is widely recognised that falling trade costs and advances in information and communication technologies have led to a new phase in globalisation, dominated by global value chains.15 Analysis highlights in particular the fact that export
13 Loris Roubini et al. Breaking down the barriers to firm
growth in Europe: the fourth EFIGE policy report,
BRUEGEL 2012.
14 European Commission, Study on the level of
internationalisation of European SMEs, 2010,
http://ec.europa.eu/enterprise/policies/sme/market-access/internationalisation/index_en.htm#study.
15 OECD, Interconnected Economies: Benefiting from
Global Value Chains, 2013.
market shares are now less significant in revealing countries’ competitiveness as firms in advanced economies such as the EU still capture much of the value in manufacturing value chains, even when the final phase of production is located in an emerging economy.
In policy terms, this development underlines the increasing importance of open and competitive access to inputs and intermediate products and services, and of establishing a favourable framework for attracting foreign investment in order to enhance the competitiveness of EU industry.
The Commission set out its approach to foreign direct investment in 201016 with a view to harnessing its potential for growth and competitiveness. Foreign direct investment greatly contributes to growth and employment. While Europe still attracts large foreign investment flows estimated at USD 324 billion, it can be noted that its share of the world total has declined from more than 30 % in 2008 to 23 % in 2012, while in the same period China’s share increased from less than 10 % to more than 16 %.
16 Commission communication Towards a comprehensive
European international investment policy, COM(2010)
343. 0
5 10 15 20 25 30 35
2007 2008 2009 2010 2011 2012
Photosensitive semiconductor devices
Machinery and apparatus for filtering or purifying
Other
Attractiveness for foreign investors is largely determined by business environment, which requires appropriate policies at national and regional levels, in particular as part of the smart specialisation strategies to be put in place in the 2014-20 programming period of the European Structural and Investment Funds, with the support of EIB loans (see section 2.4).
1.3.4
Slow adjustment within the
internal market
In addition to the low levels of aggregate demand, rebalancing within the internal market has been relatively slow. Before the crisis, some EU countries experienced increasing current account deficits that were in part financed by countries that exhibited current account surpluses. During the crisis, the main deficit countries have reduced significantly their trade imbalance and have come closer to more balanced current accounts thanks to a drop in imports and an increase in exports (figure 1.12).
Figure 1.12: Current account adjustment (% GDP)
Source: EUROSTAT
However, this rebalancing has been achieved mainly through transactions with the rest of the world. Peripheral economies (Spain, Greece, Portugal and Italy) have displayed a relatively impressive performance in global markets compared to their exports to the other EU countries as figure 1.13 shows. Although exports to the EU are still greater in volume than exports to the rest of the world, extra-EU exports growth rates are relatively higher. On the other hand, with the exception of Finland, surplus economies have increased their exports and their current account surplus while maintaining high current account levels.
The share of exports from those four countries in total intra-EU trade has been slowly declining since 2004. On the other hand, the share of exports from these countries to the rest of the world over total EU exports to the rest of the world has gained ground in recent years. In fact, data indicate that the southern periphery is increasingly losing importance as a supplier to the EU economic core. Also, the geographic reallocation of value added chain segments within the internal market seems to have come to a standstill during the crisis.
-15 -10 -5 0 5 10 15
DE NL FI AT DK FR IT SI IE PL ES PT EL
Figure 1.13: Exports of Spain and Greece, per cent of GDP
Source: EUROSTAT
Intra-EU foreign direct investment has been drastically reduced during the recession, especially towards the periphery. There is some evidence of return to the core. This is indicated in the chapter on the Manufacturing Imperative included in the 2013 European Competitiveness Report accompanying this report. There is also evidence of intra-EU direct investment in core countries such as Austria in recent years.
There is no doubt that subdued internal demand must be largely responsible for this development but it would be useful to consider what impact the crisis has had on internal market integration, and how the internal market could contribute to speeding up the adjustment after the crisis correcting trade and investment imbalances.
1.3.5
Insufficient structural adjustment
A final factor that can help to explain why the economic crisis is taking so long to resolve in Europe is the lack of dynamism of the EU economy due to structural problems such as administrative obstacles and the difficulties faced by firms wishing to expand.
The emergence of new large players has traditionally been a rare occurrence in Europe, where the attitude towards entrepreneurship is less positive than in other regions of the world. There is
no EU equivalent of new giants such as Apple, Google or Facebook, and completely new sectors have struggled to emerge from scratch. Even within a sector, firm renewal in Europe is slow. Large firms tend to fail less than in more dynamic economies such as the US and small firms tend to have difficulties growing. This has hindered both the development and penetration of new high-growth sectors and the reallocation of resources to more innovative parts of the economy.
Structural and institutional rigidities prevailing in European in labour, product and services markets are not conducive to speedy reallocation of factors in the economy. The ability to access markets with a new product and to reach an efficient scale is often hindered by a heavy regulatory environment.
Skills mismatch is an also an issue with several high-growth sectors struggling to find trained specialists. Education and training systems do not always provide the right skills sets needed for fast-growing high technology sectors.
In addition, research and innovation systems are underfunded but also, the overall incentives for innovation require attention. There is a bias towards fundamental research in Europe and an insufficient amount of innovation that is close to market or that relates to new ways of commercialising a technology. This is evidenced by the situation in
2 4 6 8 10 12 14
2005 2006 2007 2008 2009 2010 2011 2012
Spain´s EU27 EXTRA Exports Spain´s EU27 INTRA Exports
many sectors such as microelectronics where the prominence of the EU in research is not reflected in its share in commercialisation. In addition, process innovations are not properly taken into account in the systems of incentives developed by national authorities. Giving attention to this important form of innovation at EU level could be a catalyst to encourage Member States to rebalance the incentives currently in place.
1.3.6
Skills mismatch
The impact of the crisis on industrial employment has been particularly severe. Since the adoption of the 2012 communication, the seasonally adjusted unemployment in the EU-27 has climbed to record-levels at 12.2 % corresponding to over 26.5 million unemployed persons.17 Almost 6 million young people were unemployed in the EU-27 area in March 2013 corresponding to an unemployment rate of over 23 %. Between the first quarter of 2008 and the end of 2012, over 3.8 million jobs or 11 % of total employment have been lost in manufacturing in the European Union. The construction sector suffered an even more severe loss (17 %), while other sectors such as the distributive trades (2 %) and the financial sector (1.2 %) that was at the origin of the crisis, suffered relatively lower job losses.18
Job losses in manufacturing have been unevenly distributed across sectors and countries, with Spain, Lithuania, the Baltic Countries and Portugal being the worst hit and Germany and Austria suffering only small losses in manufacturing jobs. By sectors, only the pharmaceutical sector reported positive net job creation figures by the end of the third quarter of 2012. The intense job destruction has revealed structural mismatch since the start of the crisis. The recession has hit the low-skilled and the youngest the hardest while demand of high skilled labour remains.
The long-standing trend towards ever higher skill requirements means young people without the necessary skills and low educational attainments will find it increasingly difficult to find
17 Eurostat, News release, 31 May 2013.
18 2013 March Monthly Note, Industrial Policy Indicators
and Analysis, DG Enterprise and industry.
employment.19 In tackling skill shortages and mismatches, youth unemployment therefore requires specific attention, which is addressed by the communication on youth unemployment, adopted by the European Commission in June 2013.20
Within the manufacturing sector, 70 % of workers have medium-level skills and highly-skilled workers represent 27 %. Low skilled workers are a mere 3 % of the industrial labour force. But the demand for highly skilled labour in manufacturing is estimated to rise by 22.7 %, more than for any other sector, while the demand for medium skilled labour in manufacturing is estimated to fall.
Figure 1.14: Change in demand for skills in the manufacturing sector between 2010 and 2020
Source: CEDEFOP
The manufacturing sector is increasingly experiencing skill shortages that may limit production, in particular when growth picks up. A cluster of manufacturing sub-sectors (motor
[image:23.595.67.530.416.723.2]vehicles, machinery and equipment, electrical equipment, computer, electronic and optical products) has been experiencing high levels of labour shortages.
Figure 1.15: Labour shortages and employment growth in manufacturing sub-sectors
Source: Commission's Business Survey (2009) and Eurostat
Note: Labour shortage is measured by the labour shortage indicator (LSI); sector averages.
-30% -20% -10% 0% 10% 20% 30% 40%
All sectors Total manufacturing Food, drink and tobacco
Engineering Rest of manufacturing
High skills Medium skills Low skills
Food products Beverages
Tobacco products
Textiles
Wearing apparel
Coke and refined petroleum products
Rubber and plastics Non-metallic mineral
products
Fabricated metal products Electrical equipment
Machinery and equipment n.e.c.
Motor Vehicles
Other transport equipment Furniture
Other manufacturing
-5% 0% 5% 10% 15% 20% 25%
0% 2% 4% 6% 8% 10% 12%
C
h
a
n
g
e
in
e
m
p
lo
y
m
en
t
(2
0
0
8
-2010)
The chart above shows the change in employment growth and average annual labour shortage by sector for 2008–10. The bubble size indicates the relative mass of sectoral employment in 2010. The centre of the chart shows a cluster of medium to large manufacturing sectors that have experienced high growth in employment but also serious labour shortages. Among these sectors, the latest 2012 labour shortage indicators remain significant: machinery and equipment (7.7 %), motor vehicles (6.4 %), computer, electronic and optical products (6.1 %) and electrical equipment (5.0 %).
As testimony to the skill gap in the manufacturing labour force, a persistently high number of workers
in EU manufacturing sectors feel under-qualified (11.5 %); the situation seems particularly acute in sub-sectors such as the manufacture of basic metals, electrical equipment, computer, electronic and optical products and basic metals.
Finally, obsolescence and the lack of retraining seem to be an issue. A high percentage of manufacturing workers (31 % of lower skilled and 33 % of older workers) report that their skills have become obsolete due to rapid technological change. However, only 54 % of all manufacturing companies provide training and of these only 55 % assess their future skills needs.
1.4.
Why is investment unresponsive?
Economic recovery requires investment to pick up. Until now, investment has stayed well below long-term values and seems to be unresponsive to policy actions. There is considerable variance in the official forecasts of the future evolution of investment in the EU. While Commission forecasts in May expected a recovery in gross fixed capital formation of 2.6 % in 2014 for the EU and of 2.3 %
for the Euro Area, the IMF and the OECD predicted a mere 1.3 % for the euro area. Until now, the expectations of the Commission for a recovery of gross fixed capital formation have been dampened by actual figures. It is very difficult to identify when investment will recover but cost conditions and uncertainties have been identified as major factors delaying this recovery.
1.4.1
Cost conditions – productivity
Figure 1.16: Unit labour costs (2005=100)
Source: AMECO
70 80 90 100 110 120 130 140
2000 2001 2002 2003 2004 2005 2006 2007 2008 2009 2010 2011 2012
Labour productivity measured by unit labour costs has remained relatively stable in the EU over the last twelve years (figure 1.16). Behind this apparent stability there is a considerable variation over time and across countries. While some countries have experienced a considerable reduction in recent years due to the impact of the crisis, they had relatively higher labour costs before the crisis hit. On the other hand, Member States that have fared better during the crisis show moderate but
increasing labour remuneration albeit compensated by productivity gains.
All in all, this evolution is not very positive in relative terms when compared to other industrialised countries. When we consider the combined impact of the nominal effective exchange and labour costs on the euro area, we see that our cost competitiveness has been eroded during the crisis (figure 1.17).
Figure 1.17: Real effective exchange rate relative to the rest of 36 industrialised countries (2005=100)
Source: AMECO
The relative levels of energy costs are also delaying investment. Compared to other industrialised economies and the US in particular, the costs of energy in the EU are relatively high. The extraction of shale gas in the US has allowed decoupling of natural gas and oil prices as well as releasing some of the pressure on the price of oil for final consumption and electricity prices. The use of gas not just as an energy source but as a feedstock has a significant impact on the chemical sector to the disadvantage of European producers.
The overall indicator of competitiveness, total factor productivity, is also pointing in the same direction and helps to explain the persistently low investments levels in the EU. Since the onset of the crisis, the euro area countries have continued losing total factor productivity relative to the US and Japan, the indicator that best captures the impact of innovation and technological changes on the
competitiveness of the economy. Once more, the performance of Member states varies considerably across countries and over time with some remarkable turnovers since 2009, but the aggregate result suggests some stagnation in the evolution of total factor productivity.
1.4.2
Uncertainty
Finally, it is often claimed by business that the high level of uncertainty over the macroeconomic situation and regulatory changes is an obstacle to investment. This view is supported by economic theory; uncertainty about households and companies income may postpone consumption decisions for durables and, in turn, uncertainty over sales and profits, whilst concerns about the possible depreciation of assets may delay investment decisions. Productive firms may postpone decisions to enter new markets in times of uncertainty.
97 98 99 100 101 102 103 104
2000 2001 2002 2003 2004 2005 2006 2007 2008 2009 2010 2011 2012
Finally, firms may be reluctant to hire new workers, thus reducing expectations of employment and income for job seekers.
It is hard to tell to what extent uncertainty does deter or delay investment projects. However, it is
possible to get some measurements or indicators of uncertainty and follow their evolution over time. Figure 1.18 shows the difference between forecasted values and actually realised figures for investment since 2010, confirming an increase in the level of uncertainty on this key variable.
Figure 1.18: GDP growth and gross fixed capital formation (EU27, current prices in EUR)
Source: AMECO database, Commission economic forecasts
There is also some level of uncertainty with respect to the evolution of important policies notably regarding energy and climate change. Lack of coordination among policies pursuing different objectives is also producing inconsistencies. Coordination among different layers of policy
intervention and across Member States could be improved to avoid generating an uncertain and costly environment for firms. Finally, macroeconomic governance issues are at the moment still not fully resolved, generating an additional layer of perceived risk.
1.5.
Overall performance in Member States
1.5.1
Industry in total economy
The varying sectoral specialisation and relative size of the Member States’ industrial structures have an effect on the path towards a more knowledge-based economy which the Member States can take. Some economies in the EU are global exporters of advanced manufactured goods, some are more integrated in intra-EU value chains and provide price-competitive intermediate inputs, and some increasingly specialise in services.
Industry accounts for three quarters of the EU’s exports and creates one in four private sector jobs. Moreover, many jobs and value added services depend on industry as a supplier or as a client. Through its innovative capacity and adoption of new technologies, manufacturing is already proving its dynamism and competitiveness, and contributing to the growth and welfare of the EU.
17.0 18.0 19.0 20.0 21.0 22.0
-6 -5 -4 -3 -2 -1 0 1 2 3 4 5 6 7 8
2000 2001 2002 2003 2004 2005 2006 2007 2008 2009 2010 2011 2012 2013 2014
GDP annual growth rate (lhs) Autumn 2010 forecast- GDP
Autumn 2011 forecast- GDP Autumn 2012 forecast- GDP
Capital formation as % of GDP (rhs) Autumn 2010 forecast- GFCF
Autumn 2011 forecast- GFCF Autumn 2012 forecast- GFCF %