Int. J. Electrochem. Sci., 14 (2019) 8206 – 8215, doi: 10.20964/2019.08.98
International Journal of
ELECTROCHEMICAL
SCIENCE
www.electrochemsci.org
Effect of Morphology on the Thermodynamic function of
A-TiO
2Nano-Materials
Jing Luo1,2, Xiaohua Yu3, Shiyou Li1,2*, Ruijia Diao3
1 Fire Research Institute, Southwest Forestry University, Kunming 650024, China
2 College of Civil Engineering, Southwest Forestry University, Kunming, 650024, China; 3 Faculty of Material Science and Engineering, Kunming University of Science and Technology, Kunming 650093, China.
*E-mail: [email protected]
Received: 9 April 2019 / Accepted: 14 June 2019 / Published: 30 June 2019
The thermodynamic functions of A-TiO2 nano-materials with different shapes (nanowires, nanotubes, nanoflakes and nanoparticles) were investigated by Faraday's law and open-circuit potentiometry. The results showed that the A-TiO2 nanoparticles have the highest chemical activity (nanoparticles > nanoflakes > nanotubes > nanowires) at the same size, and the corresponding free energies and enthalpy are ΔG=-895.59kJ·mol-1, ΔS=76.09J·K-1mol-1, ΔH=847.21kJ·mol-1;However, the stability of A-TiO2 nanowires is the best (nanowires > nanotubes > nanoflakes > nanoparticles), and the ionic diffusion coefficient is lower than other structures (nanowires < nanotubes < nanoflakes < nanoparticles). There are more surface-active spots in nanometer-sized A-TiO2, which makes it more likely to lose electrons in the equilibrium state. This work intends to provide a reference for the design and analysis of various nanostructured materials.
Keywords: Nanostructure; A-TiO2; Thermodynamic property; Diffusion coefficient; Form effect
1. INTRODUCTION
TiO2 is widely used in the fields of material anticorrosion, lithium ion battery development, catalysis, and sewage treatment due to its environmentally friendly, low-cost, and stable structure [1-4]. Anatase TiO2 (A-TiO2) is the most popular activity material in the three crystalline forms of TiO2 (anatase, rutile and plate titanium) [5]. However, it is a pity that A-TiO2 is a wide band-gap semiconductor, and its chemical activity and stability are difficult to coordinate, this brings great challenge to the theoretical design of A-TiO2 materials [6, 7].
on hydrothermal [9], anodic oxidation [10], atomic layer deposition [11] and other fields of synthesis and doping modification [12]. It has been proven that the nanometer size effect has a great influence on the properties of the materials, and that the properties of the same materials with different nanostructures are not the same. It is difficult to compare and explain the mechanism of interaction between different morphologies. For example, it was reported that A-TiO2 nanoparticles have high activity [13]. However, it was also reported that A-TiO2 nanotubes have high activity [14-16]. Earlier studies from our group have shown that the thermodynamic function of nanomaterials can be evaluated by Faraday's law and the open-circuit potential method [17-19]. Therefore, to explain the difference of A-TiO2 nanomaterials with different morphologies (nanowires, nanotubes, nanoflakes and nanoparticles) a thermodynamic function has been used in the present study. The method used herein can be used as a reference for characterizing the properties of the same materials with different nanostructures in future studies.
In this work, based on the X-ray diffraction (XRD), X-ray photoelectron spectroscopy (XPS), scanning electron microscopy (SEM), open circuit potential, and electrochemical impedance spectroscopy (EIS), the microstructure, phase composition, electrochemical activity and stability of the A-TiO2 nanocrystalline was investigated.
2. MATERIALS AND METHODS
In order to make properties comparable, A-TiO2 nanowires (between 120 and 160nm in diameter, NWs), A-TiO2 nanotubes (between 100 and 160nm in pipe diameters, NTs), A-TiO2 nanowires (between 50 and 80nm in thickness, NFs), TiO2 nanoparticles (between 100 and 180nm in diameters, NPs), A-TiO2 bulk (purity≥99.0%), and Ti(SO4)2 (purity≥96.0%) were all purchased from Aladdin (Shanghai, China).
In this work, the activity of A-TiO2 is measured by electrochemical methods. The electrode preparation methods are as follows: 1)A glassy carbon (GC) electrode was polished by Al2O3 powder with different particle sizes, then the GC electrode was cleaned by an ultrasonic cleaning process using acetone, anhydrous ethanol, nitric acid and deionized water for 5 min respectively. 2)the A-TiO2 nanomaterials and A-TiO2 bulk of the same amount (5mg) were dissolved in the absolute ethanol of 0.1mL, respectively, and dispersed by ultrasound for 1h. 3)the 10 μL dispersed A-TiO2-ethanol solution was transferred and dropped onto the GC electrode, when the solution was dried, then the 5% nafion solution was coated over the GC electrode and dried in the air.
The microstructures of the samples were observed using an SEM (EVO MA 10/LS 10; Carl Zeiss, Jena, Germany). The phases of nanomaterials were analyzed by power X-ray diffraction (PW 1830/00; Philips, Holland) using Cu Kα radiation (0.15406 nm). The valence state of the elements were obtained from XPS measurements (PHI-5000 Versa probe IIIU lvac-Phi; Japan) using aluminum as the ray source. Raman scattering was collected at room temperature using a DXR Raman spectrometer with a 5 nm laser source from an Ar+ laser. Electrochemical measurements were conducted using a CHI760e electrochemical analyzer (CH Instruments, Shanghai, China).
3. RESULTS AND DISCUSSION
[image:3.596.112.485.455.726.2]3.1 Microscopic morphology and phase structure analysis
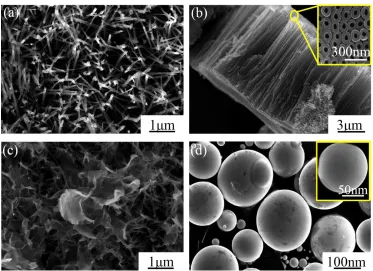
Fig. 1 shows the microstructure of the A-TiO2 nanomaterials with different structures. As shown in Fig. 1(a), A-TiO2 has obvious linear structure with a radius of about 60-80 nm. The length of nanowires reaches the micron level and the diameter of each nanowires is almost uniform along the length of the nanowires. The A-TiO2 nanotube array has a regular and uniform structure with a tube diameter of about 100-160nm, in which the wall thickness of the tube is about 50-80nm (Fig. 1(b)). Fig. 1(c) shows the A-TiO2 has a distinct sheet structure with a relatively uniform size, an average thickness of about 50 to 80 nm. A granular nanostructure of A-TiO2 is showed in Fig. 1(d), with a uniform size and an average radius of about 50-80 nm. Generally speaking, all samples with linear, tubular, flake and granular structures have similar nanoscale sizes and the condition of forming the nano-electrode is satisfied.
[image:4.596.95.503.268.449.2]
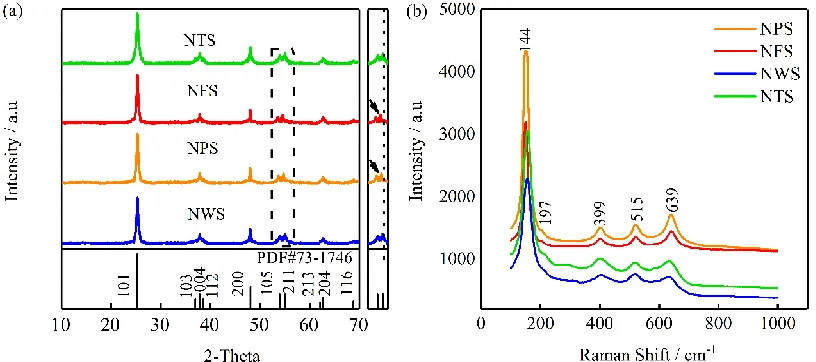
The diffraction peak of A-TiO2 with a different morphology is similar to the standard A-TiO2 (PDF#73-1746), and all the A-TiO2 showed anatase structure (Fig. 2(a)). The (105) and (121) X-ray diffraction peaks of A-TiO2 nanoparticles and A-TiO2 nanoflakes shifted to different degrees respectively. This is due to the lattice distortion of nanoparticles and nanoflakes. It is important to note that no other crystalline phases were observed in X-ray diffraction peaks, such as rutile. Fig. 2(b) shows the Raman spectra of the A-TiO2 nanomaterials. There are six characteristic peaks of anatase titanium dioxide: 144 cm-1, 197 cm-1, 399 cm-1, 515 cm-1, 519 cm-1 (coincident with 515cm-1) and 639cm-1 [20], thus it is proven that all four structures of A-TiO2 are typical anatase phase structures. The blue shift of the strongest peak of 114 cm-1 of the nanowires and nanotubes is attributed to the crystal size and non-stoichiometric structure [21].
Figure 2. (a) XRD patterns of pure A-TiO2 with different structures, (b) Raman spectra of pure A-TiO2 with different structures
3.2 XPS spectra of the nanomaterials
Figure 3. XPS spectra of pure A-TiO2, (a) survey spectrum, (b) Ti 2p, (c) O 1s
3.3 OCP measurements
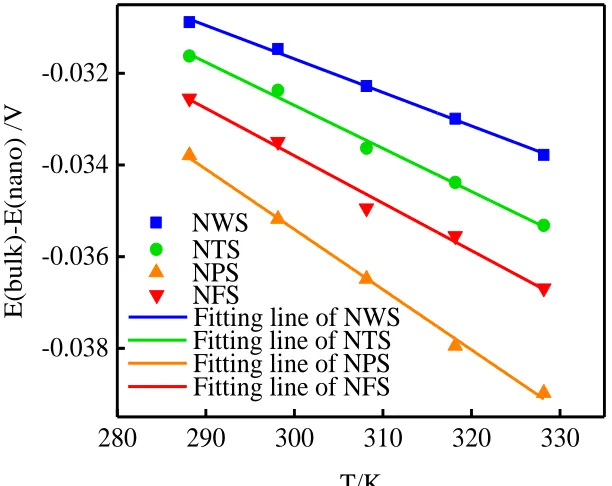
Fig. 4 shows the electrode potential difference as a function for two electrodes at different temperature. The relationship between potential difference and temperature is linearly fitted, and the fit line is also displayed in Fig. 4.
280
290
300
310
320
330
-0.038
-0.036
-0.034
-0.032
E
(b
u
lk
)-E
(n
an
o
) /V
T/K
NWS
Fitting line of NFS
Fitting line of NPS
Fitting line of NTS
Fitting line of NWS
NFS
[image:5.596.148.454.352.595.2]NPS
NTS
Figure 4. Electrode potential difference as a function for two electrodes immersed in the 0.4mmol L-1 Ti(SO4)2 + 1mmol L-1 H2SO4 at different temperature
The potential difference of the primary battery composed of the bulk A-TiO2 electrode and the four kinds of nano-A-TiO2 electrodes increases linearly with the increase of temperature. The electrode reactions are as follows:
Compared with bulk materials, nanomaterials have higher energy and are more likely to react in the equilibrium state. Therefore, in the primary battery composed of bulk A-TiO2 electrode and nano-A-TiO2 electrode, nano-A-nano-A-TiO2 more easily attracts electrons and facilitates a reduction reaction, so the nanoelectrode has a higher potential and becomes the anode of the primary battery. This result is similar to the study of Xue et al [22-23], their research suggests that at the nanometer size, the smaller the size, the more unstable the silver oxide is. In this research, each of the nano A-TiO2 systems are similar in size, thus the stability of nano A-TiO2 with different morphological structures is tested with respect to how they differ from each other; their differing electrochemical properties may be due to the difference in specific surface area and surface defect concentration.
[image:6.596.160.437.356.431.2]The fitting results are in accordance with the formula E=A+BT [24]. The temperature coefficient (∂E ∂T⁄ )𝑃 of the potential difference between the bulk electrode and the nano-electrode with different structures can be obtained by the derivative of the formula. The fitting results and the temperature coefficients are listed in Table 1.
Table 1. The parameter of fitting line (R2 is the square of the linear correlation coefficient)
sample A B/10-5(V/K) R2
NWs -0.031 -7.320 0.998
NTs -0.032 -9.410 0.994
NFs -0.033 -13.100 0.989
NPs -0.034 -10.40 0.997
3.4 Thermodynamic function Properties of nano-A-TiO2
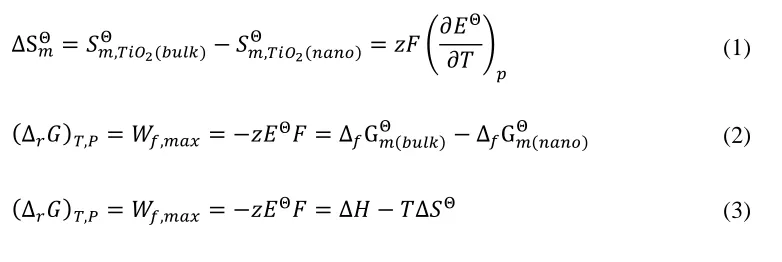
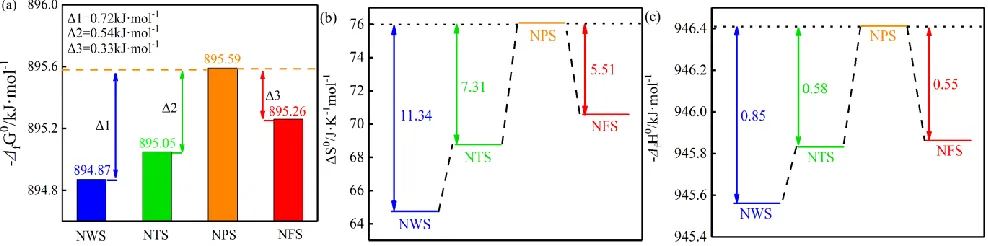
Fig. 5 shows the Gibbs free energy, entropy and enthalpy calculated by Faraday's law. The thermodynamic equations are as follows[24-26]:
It is worth noting that a striking differences existed between the thermodynamic functions of A-TiO2 with different nano-structures. The Gibbs free energy of all nano-A-A-TiO2 is higher than that of bulk A-TiO2 (-888.80kJ ·mol-1[27]) (Fig. 5(a)), The Gibbs free energy of nanoparticles is the highest (-894.87kJ ·mol-1), which is slightly higher than the other A-TiO2 nanostructures (nanoparticles >
∆S𝑚Θ = 𝑆
𝑚,𝑇𝑖𝑂2(𝑏𝑢𝑙𝑘)
Θ − 𝑆
𝑚,𝑇𝑖𝑂2(𝑛𝑎𝑛𝑜)
Θ = 𝑧𝐹 (𝜕𝐸Θ 𝜕𝑇 )
𝑝
(1)
(∆𝑟𝐺)𝑇,𝑃= 𝑊𝑓,𝑚𝑎𝑥 = −𝑧𝐸Θ𝐹 = ∆
[image:6.596.106.497.540.671.2][image:7.596.52.546.395.518.2]
nanoflakes > nanotubes > nanowires), the difference between the highest and lowest Gibbs free energy is about 0.72kJ·mol-1. The results indicate that when the size of nanostructures is closed, the A-TiO2 nanoparticles have highest activity among the different A-TiO2 nanostructures. Fig. 5(b) shows the entropy of nano-A-TiO2 with different structures. The entropy of all nano-A-TiO2 is higher than that of bulk A-TiO2 (50.62J·K-1mol-1) and the entropy of nanoparticles is the highest (76.09J·K-1mol-1) in the different nanostructures. Compared with the A-TiO2 nanowires with the lowest entropy, the entropy is increased by 11.34J·K-1mol-1. Moreover, Fig. 5(c) shows the entropy of nano-A-TiO2 with different structures. The enthalpy of all nano-A-TiO2 is higher than that of bulk A-TiO2 (-944.00kJ·mol-1) and the enthalpy of nanoparticles is the highest (-947.21kJ·mol-1) in the different nanostructures. Due to nanometer size, the proportion of surface activated atoms of the nanomaterial notably increased, which lead to the significant increase of entropy; the notable increase of the proportion of activated atoms resulted in a metastable state of the nano system, which was shown as the enthalpy increased evidently. The addition of Gibbs free energy shows that the nanometer size material can react more easily. Furthermore, the four structures of A-TiO2 have a different content of defects; the nanoparticles had the largest activated specific surface area with a large number of defects as compared with the other structures in closed nanometer size. This results in the A-TiO2 nanoparticles having a larger Gibbs free energy and correspondingly it can react more easily [2].
Figure 5. The value of Gibbs free energy, entropy and enthalpy of nano-A-TiO2 calculated by Eq.(1-3)
3.5 AC impedance analysis
[image:8.596.69.528.132.317.2]
resistance. The W was Warburg impedance arising from the semi-infinite diffusion of Li+ in the electrode, which is relative to Zre-σ obtained from the slope of the fitting line in Fig. 6 (b).
[image:8.596.59.541.411.483.2]Figure 6. (a) Nyquist plots of the A-TiO2 electrodes immersed in the 0.5M LiNO3 solution at 25 °C, the inset: the corresponding equivalent circuit, (b) the real part of the impedance versus ω-1 of A-TiO2 electrodes
Table 2. The element parameters obtained by fitting EIS data
sample Rs (Ω cm2) Rct (Ω cm2) σ (Ω cm2 s-0.5)
NWs 13.160 72.030 8.274
NTs 13.020 64.670 3.028
NFs 12.980 60.390 3.231
NPs 13.050 58.860 2.921
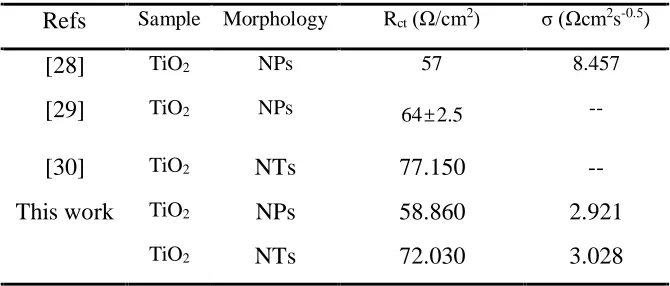
Table 3. The comparison of the electrochemical properties of the TiO2 as anode materials for lithium-ion batteries.
Refs Sample Morphology Rct (Ω/cm2) σ (Ωcm2s-0.5)
[28] TiO2 NPs 57 8.457
[29] TiO2 NPs 64±2.5 --
[30] TiO2 NTs 77.150 --
This work TiO2 NPs 58.860 2.921
TiO2 NTs 72.030 3.028
[image:8.596.131.466.545.688.2]
semicircle relative to the A-TiO2 nanowires was largest, indicating that the blocking effect on the charge movement of A-TiO2 nanowires is relatively large. In addition, it can be seen that the fitting line corresponding to the A-TiO2 nanoparticles has the smallest slope and the smallest Warburg factor. On the contrary, that of the A-TiO2 nanowires has the maximal slope of its fitting line (σ=8.274Ω cm2 s-0.5).
Additionally, Li+ diffusion coefficient (D) can also be calculated according to the following Eq. 1[32]:
𝐷 = 𝑅2𝑇2⁄(2𝐴2𝑛4𝐹4𝐶2𝜎2)
Where R is the ideal gas constant, T is the absolute temperature, A is the electrode area, n is the number of electrons transferred in the reaction of the redox couple, F is Faraday constant, and C is the concentration of Li+ in the solution. Therefore, the ion diffusion coefficient is inversely proportional to the Warburg factor, and the diffusion coefficient of A-TiO2 nanoparticles is higher than that of other structures (nanoparticles > nanotubes > nanoflakes > nanowires); this is beneficial to the diffusion of ions in the electrode. The data indicates that the A-TiO2 nanoparticles electrodes exhibited faster electrochemical kinetics and a smaller polarization.
4. CONCLUSIONS
1) Due to the higher activity of nano-A-TiO2 electrodes, the electrode potential of the primary battery composed of nano-A-TiO2 electrode and bulk A-TiO2 electrode is different, and the potential difference increases linearly with the increase of the temperature.
2) According to the temperature coefficient, the Gibbs free energy, entropy and enthalpy of nano-A-TiO2 with different structures were calculated. At the same size, nano-A-TiO2 nanoparticles exhibit the best thermodynamic properties; the Gibbs Free Energy increased from -888.8 kJ·mol-1 of bulk ATiO2 to -894.87 kJ·mol-1, the entropy increased from 50.62 J·K-1mol-1 of bulk A-TiO2 to 76.09 J·K-1mol-1, and the enthalpy increased from -944 kJ·mol-1 of bulk A-TiO2 to -947.213 kJ·mol-1.
3) The A-TiO2 nanoparticles showed lower resistance and a higher diffusion coefficient of Li+ ions. This is due to the outstanding thermodynamic properties of A-TiO2 nanoparticles and the larger number of reaction sites on the surface, resulting in a significant improvement in electrochemical performance.
ACKNOWLEDGEMENTS
This work was supported financially by the Education Department Scientific Research Project of Yunnan Provincial (No. 2019J0195).
References
1. T. Luttrell, S. Halpegamage, J. Tao, Sci. Rep.UK, 4 (2014) 4043.
2. Z. P. Xie, Z. W. Wang, Y. X. Hua, Mater. Res. Express, 6 (2019) 046418.
4. C. Arrouvel, S. C. Parker, M. S. Islam, Chem. Mater., 21 (2009) 4778.
5. Z. Y. Sun, X. Huang, M. Muhler, W. Schuhmann, E. Ventosa, Chem. Commun., 50 (2014) 5506. 6. D. J. Reidy, J. D. Holmes, C. Nagle, M. A. Morris, J. Mater. Chem., 15 (2005) 3494.
7. T. Tachikawa, M. Fujitsuka, T. Majima, J. Phys. Chem. C, 111 (2007) 5259. 8. J. Y. Jiang, Z. Y. Huang, Y. Mi, Y. F. Li, A. Q. Yuan, Proc. Chem., 22 (2010) 1058. 9. Y. Z. Wen, Y. Q. Xue, Z. X. Cui, Y. Wang, J. Chem. Therm., 80 (2015) 112.
10.T. Kasuga, M. Hiramatsu, A. Hoson, T. Sekino, K. Niihara, Adv. Mater., 11 (1999) 1307.
11.C. Kim, S. Kim, J. Choi, J. Lee, J. S. Kang, Y. E. Sung, J. Lee, W. C, J. Y, Electrochim. Acta, 141 (2014) 113.
12.R. Singh, R. Bapat, L. Qin, H. Feng, V. Polshettiwar, ACS Catal., 6 (2016) 2770. 13.X. L. Yan, L. H. Jia, X. F. Guo, Chinese J. Appl. Chem., 28 (2011) 278.
14.Q. J. Xiang, J. G. Yu, M. Jaroniec, J. Am. Chem. Soc., 134 (2012) 6575. 15.K. Zhu, N. R. Miedaner, A. Miedaner, A. J. Frank, Nano Lett., 7 (2007) 69. 16.S. Li, Y. M. Zhang, J. G. Huang, J. Alloy Compd., 783 (2019) 793.
17.Y. H. Yao, J. Rong, J. F, Y. N. Zhang, X. W, X. H. Yu, Z. L. Zhan, Ceram. Int., 45 (2019) 10845. 18.C. Y. Zhu, J. X. Liu, X. H. Yu, Y. N. Zhang, Y. J. Zhang, X. D. Jiang, S. Wang, Q. W, P. D, J. Mater.
Sci., 30 (2019) 5866.
19.Y. H. Yao, Z. T. Yuan, Y. N. Zhang, X. H. Yu, J. Rong, K. Meng, Z. L. Zhan, Chinese. J. Inor. Chem., 34 (2018) 662.
20.X. B. Chen, S. S. Mao, Chem. Rev., 107 (2007) 2891.
21.Z. Wang, X. M. Xie, M. Jiang, C. Y. Yang, T. Q. Lin, H. Yin, Energ. Environ. Sci., 6 (2013) 3007. 22.M. Wang, J. H. Zhu, Y. Q. Xue, Z. X. Cui, M. Z. Zhao, J. Mater. Sci., 52(2017) 1039.
23.J. P. Du, R. H. Zhao, Y. Q. Xue, J. Chem. Therm., 45(2012) 48.
24.L. D. Wang, Z. Y. Huang, G. C. Fan, Z. G. Zhou, X. C. Tan, Sci. China Chem., 42 (2012) 47. 25.G. C. Fan, L. Sun, Z. Y. Huang, J. Y. Jiang, Y. F, Mater. Lett., 65 (2011) 2783.
26.G. C. Fan, J. Chen, Y. J. Ma, Z. Y. Huang, Micro. Nano Lett., 7 (2012) 795.
27.J. A. Dean. Lange’s Handbook of Chemistry. 15th ed. New York: McGraw-Hill, 6 (1998) 1029. 28.J. Li, J. F. Huang, J. Y. Li, L.Y. Cao, H. Qi, Y. Y. Cheng, Q. Xin, H. Dang, J. Alloy Compd., 727
(2017) 998.
29.M. A. Deyab, S. T. Keera, Mater. Chem. Phy., 146 (2014) 406.
30.G. G. Zhang, C. J. Huang, L. M. Zhou, L, Ye, W. F. Li, H. T. Huang, Nanoscale, 3 (2011) 4174. 31.J. Li, J. F. Huang, J. Y. Li, L.Y. Cao, H. Qi, Q. Xin, Y. Y. Cheng, J. Alloy Compd., 784 (2019) 165. 32.R. Meng, H. Hou, X. Liu, W. Hu, J. Duan, S. Liu, Ceram. Int., 41 (2015) 9988.