Int. J. Electrochem. Sci., 13 (2018) 7045 – 7056, doi: 10.20964/2018.07.80
International Journal of
ELECTROCHEMICAL
SCIENCE
www.electrochemsci.org
Copper/Iron Composite Anode prepared by in situ
co-precipitation with Excellent High-rate and Low-temperature
Performance for Rechargeable Nickel-Iron Battery
Lanxiang Huang1, Jun Yang1, Ping Liu1, Ding Zhu2,*, Yungui Chen1,2,*
1
Department of Advanced Energy Materials, College of Materials Science and Engineering, Sichuan University, Chengdu 610065, PR China
2
Institute of New Energy and Low-Carbon Technology, Sichuan University, Chengdu 610065, PR China
*
E-mail: [email protected]; [email protected]
Received: 27 March 2018 / Accepted: 21 May 2018 / Published: 5 June 2018
Copper/iron composite anode materials were synthesized by one-step co-precipitation method followed by calcination at high temperature in this paper, which had shown excellent high-rate discharge capacity and low temperature capability. Even the discharge-rate is as high as 10 C (1 C=200 mA g-1), or the temperature is as low as 253 K, the batteries still exhibited good discharge capacity (130 mA h g-1 and 115 mA h g-1, respectively). XRD and SEM results revealed that under the reduction treatment of acetylene carbon black at high temperature, copper atoms were preferentially reduced, removed from the spinel lattice and deposited on the surface, leading to the formation of porous structure with high specific surface. EIS and polarization tests proved that the copper/iron composite anode materials not only delayed the passivation but also raised the hydrogen evolution overpotential, both improved the dynamics of the iron electrode.
Keywords: copper/iron composite anode, excellent high-rate discharge capacity, low temperature performance, Nickel-Iron battery
1. INTRODUCTION
However, hydrogen evolution at the iron electrode during charging is a big trouble, due to the standard reduction potential of the hydrogen evolution reaction (Equation 1) is positive to that of the iron electrode reaction (Equation 2), which will lead to low charge efficiency[4].
H2O + M MH +OH- E0= -0.828V vs. SHE (1)
Fe + 2OH-⇌ Fe(OH)2 + 2e- E0= -0.877V vs. SHE (2)
Another problem is the passivation of iron electrode because of an insulating layer of iron hydroxide generated during the discharge process, which will cause inferior discharge rate and low temperature performance [4]. To resolve these problems, some valuable studies have been committed to improve the performance of iron electrodes. Metal sulfides (FeS, PbS, K2S, Bi2S3) have been proved
to increase the specific capacity and capacity retaining of the electrodes [4-11]; nanoparticles are beneficial for enhancing the utilization of the active materials [12-15]; besides, organic sulfur can hinder the hydrogen evolution to improve the charge efficiency [16]; H2-O2 combination catalyst can
make the nickel-iron battery sealed with starved electrolyte [17]. But neither the low-temperature performance nor the capacity at high discharge rate has been paid close attention to. So far, majority of the iron electrodes tests were carried out at temperature higher than 258 K and discharge rate lower than 1.5 C (1 C = 200 mA g-1) [4,6,7,9-11,17-21].
As good conductive nucleation, metallic Cu in the iron electrodes will promote the dissolution-deposition process of iron electrode. Kao et al. [15] synthesized Fe/Cu composite nanoparticles through reduction of copper compound by NaBH4, which presented favorable capacity even at
discharge rate of 16 C. However, the preparation process was complicated, and the low temperature performance and anodic dynamics of the electrode were not investigated.
In this paper, the copper/iron composite materials were synthesized through one-step co-precipitation method followed by calcination at high temperature. The impact of metallic Cu in the composite materials to the performance of the iron electrode was investigated, especially the charge efficiency, capability at high discharge rate and low temperature performance.
2. EXPERIMENTAL 2.1 Materials preparation.
The reagents were purchased and used without further purification. The copper/iron composite anode materials were synthesized through one-step co-precipitation method to acquire the precursor CuxFe3-xO4 (x=0, 0.2, 0.6) followed by calcination at high temperature.
The typical process example (x=0.2) is as below. First, aqueous solution Ⅰ(0.175 M FeSO4·7H2O and 0.0125 M CuCl2·2H2O) and Ⅱ(1.8 M NaOH and 0.3 M KNO3 with amount of
rate of 5 °C min−1. The acquired material was noted as Cu0.2. Correspondingly, the sample CuxFe3-xO4
(x=0.6) was also prepared by changing the mole ratio of Fe2+/Cu2+ and noted as Cu0.6. For comparison, crystalline Fe3O4/C composites were also prepared by the same route without the
CuCl2∙2H2O and noted as Cu0.
2.2 Sample characterizations.
The phase structure of the obtained samples was identified by the X-ray diffractometer (DANDONGFANGYUAN, DX-2600X) utilizing Cu-Kα1 source with a step of 0.02◦. The morphology
was characterized by scanning electron microscopy (SEM, Japan JSM-6490LV).
2.3 Electrode preparation and electrochemical test.
The iron electrode consisted of 93 wt.% active materials, 5 wt.% acetylene carbon black, 2 wt.% polytetrafluoroethylene (PTFE, 60 wt.%, in diluted emulsion). The above materials were mixed and dispersed in ethanol to form homogeneous slurry followed by loaded into a Ni foam sheet. After dried in an oven at 65℃ for 6 h, the pasted plate was cut to several circular electrodes. The prepared iron electrode and excessive commercial Ni(OH)2 electrode was used as the anode and cathode
respectively with mercury-mercury oxide electrode as the reference electrode. An aqueous solution of 8 M KOH + 0.05 M Na2S was used as the electrolyte in battery system.
The Galvanostatic charge-discharge tests were performed on a Land battery testing system -5 V/100 mA (LandCT2001A) at room temperature. Fifty activation cycles were carried out at a charge rate of 1 C for 90 min and discharge rate of 0.5 C to –0.8 V (vs. Hg/HgO). As for coulombic efficiency, the cells were charged to 100 mA h g-1, 150 mA h g-1, 200 mA h g-1 and 250 mA h g-1 at a rate of 1 C, and the charge capacity was noted as Qc, then discharged to –0.8 V at a rate of 0.5 C, and
the discharge capacity was noted as Qd. The coulombic efficiency was calculated by Qc / Qd * 100%.
To evaluate the rate performance, the cell was charged at a rate of 1 C for 90 min, and then discharged at different rates, ranging from 1 C to 10 C. The cut-off voltages were set at –0.7 V for 1 C, –0.6 V for 3 C, –0.5 V for 5 C, –0.4 V for 10 C respectively. To evaluate the power performance, the cells were charged at 1 C for 90 min, and then discharged at the rate ranging from 0.2 C to 26 C for 5 s. The discharge current and voltage at 5 s were noted as Ic (mA g-1) and E (V) respectively, so the power of
the electrode was calculated by Ic*E. As for the low-temperature performance, the cells were first
3. RESULTS AND DISCUSSION
Figure 1. XRD patterns of various materials: (a) commercial powders from Sichuan CHANGHONG Battery Co., Ltd; (b) precursors; (c) products calcined
Fig.1 presents the XRD patterns of various materials. As can be seen from Fig.1(b), the peaks at 2θ value of 30.3◦, 35.5◦, 37.3◦, 43.2◦, 53.7◦, 57.2◦, and 62.7◦ could be well indexed to the standard magnetite phase (JCPDS no.87-0245) and the narrow sharpness of the diffraction peaks indicates good crystallinity of the Fe3O4 phase for the precursor (Cu0). After calcination, the atomic ratio of Fe/O
rises (the phases of Fe0.88O and Fe0.909O are generated), due to the reducibility of the acetylene carbon
black at high temperature added during co-precipitation. These results are consistent with the commercial powders from Sichuan CHANGHONG Battery Co., Ltd (Fig. 1(a)). When synthesized by co-precipitation with Cu2+, the precursors are chemical compounds of Cu-Fe-O, rather than the mixture of Cu-O and Fe-O; Interestingly, after calcination, metallic Cu and Fe are generated and the ratio of Fe/O rises to 1. Tsuda et al. [22] reported that the charge density of Fe/Cu–O bonding at octahedral sites is weaker than that of Fe–O bonding at tetrahedral sites for the tetragonal spinel CuFe2O4,
indicating that the bonding nature of Cu–O is weaker than that of Fe–O in the structure. According to thermodynamic data, the formation enthalpies for Fe3O4 and CuO are -1121 kJ/mol and -155 kJ/mol,
[image:4.596.115.483.110.394.2][image:5.596.55.537.141.285.2]
surface. This will help to the reduction of Fe3+/Fe2+ to metallic Fe to raise the ratio of Fe/O. As the ratio of Fe/O increased, the specific capacity of the iron material will be enhanced.
Figure 2. SEM images of various iron materials: (a) Cu0; (b) Cu0.2; (c) Cu0.6
Fig. 2 shows the SEM images of various iron materials. The cotton-shaped materials are the acetylene carbon black added in the co-precipitation process. As seen from Fig. 2(a), the products (Fe3O4, according to the XRD patterns in Fig. 1(a)) are particles with uniform size and smooth surface.
All of them touch with each other tightly, formed a huge honeycomb-like thing which is separated with the acetylene carbon black. The phenomenon described above will lead to inferior electro-conductivity and bad electrochemical properties of the electrode. As to material Cu0.2 (Fig. 2(b)), the microstructure is different with the material Cu0 (Fig. 2(a)), distinctly. Clear edges and smooth surface of the particles disappeared, with non-uniform particle size. The particles and acetylene carbon black have a preferably connection, due to the rough surface. As to materialCu0.6 (Fig. 2(c)), the surface of the particle is more rougher and petal-like materials are generated on it, having adsorbed a lot of acetylene carbon black.
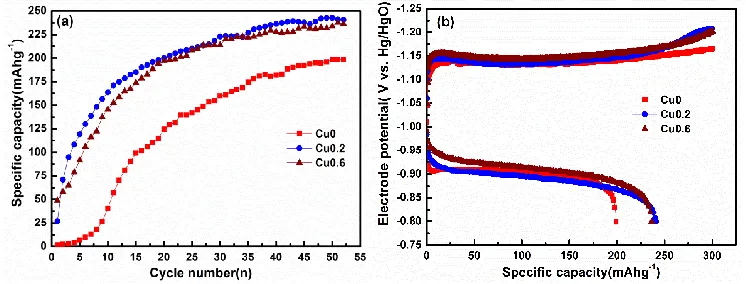
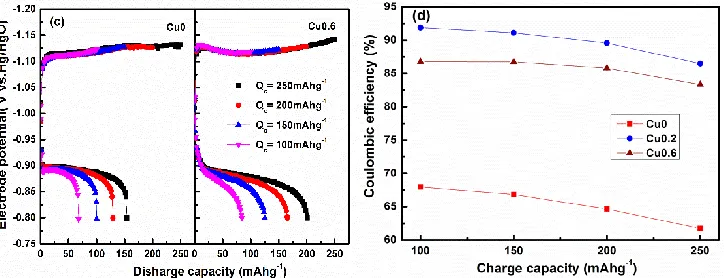
[image:5.596.112.485.558.700.2]Figure 3. Activation cycle and coulombic efficiency curves of various iron electrodes: (a)Activation curves at charge rate of 1 C for 90 min and discharge rate of 0.5 C to –0.8 V (vs. Hg/HgO); (b) Charge-discharge curves of the 50th cycle at charge rate of 1 C for 90 min and discharge rate of 0.5 C to –0.8 V (vs. Hg/HgO); (c) (d) Coulombic efficiency of the cells charged to 100 mA h g
-1
, 150 mA h g-1, 200 mA h g-1 and 250 mA h g-1 respectively at a rate of 1 C, discharged to –0.8 V (vs. Hg/HgO) at a rate of 0.5 C
As mentioned before, with the copper atoms migrating to and depositing on the surface, it perhaps leads to the formation of porous structure with high specific surface during the reduction process, which will help to the reduction of Fe3+/Fe2+ to metallic Fe. Both metallic Cu and Fe deposited on the surface of the particles created the rough surface which make more acetylene carbon black adhered on the surface, and evidently improved the electroconductivity of Fe3O4. Fig.3 presents
the activation cycle and charging efficiency curves of various iron electrodes. As can be seen from (a), either the copper/iron composite anode or the Cu-free iron electrode, both of their discharge capacity increases gradually and attains a stable value after 50 times formation cycles, which is consistent with the Manohar’s study [4].
In a rechargeable iron electrode, iron (II) hydroxide is reduced to iron during charging and the reverse reaction takes place during discharge. The discharge product, iron (II) hydroxide, is oxidized to iron (III) hydroxide upon further discharge (Equation. 3). The reaction occurs at a very low cell voltage with poor reversibility, which is not adopted in actual batteries. Consequently, herein, we focus on the inter-conversion of iron and iron (II) hydroxide as the basis of the rechargeable operation of the iron electrode (Equation. 2). Although in most papers [11, 15, 24], the discharge capacity is calculated by the two reaction equations.
Fe(OH)2 + OH- Fe(OH)3 + e- E0 = -0.560V vs. SHE (3)
[image:6.596.120.482.73.212.2][image:7.596.113.482.140.422.2]
h g-1, much higher than the Cu-free iron electrode. Manohar et al. [4] have demonstrated a high-performance iron electrode with a high charging efficiency of 92%, based on in situ electro-deposition of elemental bismuth by the electro-reduction of expensive bismuth oxide to suppress the HER.
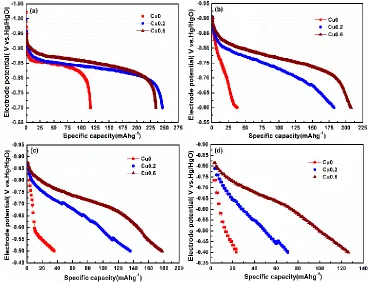
Figure 4. Discharge curves of different iron electrodes at various discharge-rates: (a) 1 C;(b) 3 C; (c) 5 C; (d) 10 C; the cell was charged at a rate of 1 C for 90 min, and then discharged at different rates; the cut-off voltages were set at –0.7 V for 1 C, –0.6 V for 3 C, –0.5 V for 5 C, –0.4 V for 10 C respectively
Figure 5. Polarization and power curves of various iron electrodes: the cells were charged at 1 C for 90 min, and then discharged at the rate ranging from 0.2 C to 26 C for 5 s; the discharge currents and voltages at 5 s were noted as Ic (mA g-1) and E (V) respectively, the power of the
[image:7.596.189.406.504.672.2]As for our work, the same high coulombic efficiency is obtained just by in situ reduction of metallic Cu through the co-precipitation of cheap copper ion salts.
The discharge curves at various discharge-rates are shown in Fig.4. As expected, the copper/iron composite anode exhibit higher specific capacity at each discharge rate. As we can see that the specific discharge capacities (denoted as C) at the same discharge rate increase in the following trend: CCu0 < CCu0.2 < CCu0.6, implying that metallic Cu in the composite materials played an important
role in the improvement of the rate performance. Especially for the materials (Cu0.6), a specific discharge capacity of about 230 mA h g-1 is obtained at a rate of 1 C. Even at rates of 3 C and 5 C, the values of 220 and 180 mA h g-1 are achieved respectively, presented distinctively high rate performance. Simultaneously, it is worth noted that the copper/iron composite anode are capable of being discharged at an impressively high rate of 10 C, and a specific discharge capacity of about 130 mA h g-1 is achieved, with 65% of the nominal capacity, indicating that the copper/iron composite anode materials have an enormous potential as a high-rate anode material for nickel-based rechargeable batteries. Generally, the discharge rate capability of the iron electrodes was limited to 0.2 C due to the formation of a passive layer of iron (II) hydroxide[25].
[image:8.596.169.429.445.631.2]Fig.5 shows the polarization and power curves of the copper/iron composite anode. As the current densities increasing, the polarization becomes serious. However, the polarization of copper/iron composite anode is mild than the pure iron electrode. Correspondingly, the power output is higher than that of the Cu-free iron electrode. Especially for the electrode of materials (Cu0.6), the peak power of 3800 W kg-1 is acquired, nearly enhanced by 35% to 2800 W kg-1 of the peak power of the electrode of materials (Cu0).
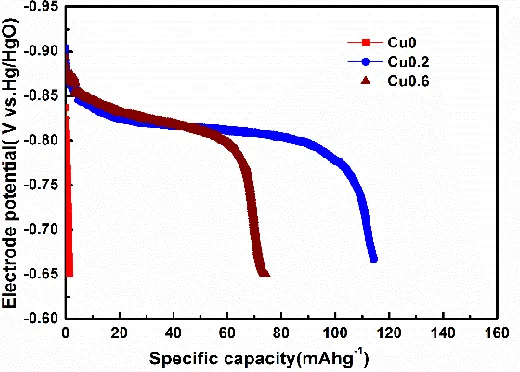
Figure 6. Discharge curves of the copper/iron composite anodes: the cells were first charged at 1 C for 90 min, and then discharged at 0.2 C to –0.65 V after stayed at 253 K for 2 h
[image:9.596.177.419.189.365.2]
reduced capacity at low temperatures is due to decreased solubility of the reaction intermediates, as also due to increased resistance and viscosity of the electrolyte [17]. But for the copper/iron composite anodes, the discharge capacity is 115 mA h g-1 with 57.5% of the nominal capacity for the sample (Cu0.2) and 73 mA h g-1 with 36.5% of the nominal capacity for the sample (Cu0.6), respectively. The excellent low temperature performance is due to the high electro-conductivity of the metallic Cu in the materials.
Figure 7. The cycle performance of the copper/iron composite anode: the cells were charged at a rate of 1 C for 90 min and discharged at a rate of 0.5 C to –0.8 V (vs. Hg/HgO)
The cycle performance of copper/iron composite anode is presented in Fig.7. After formation, the discharge capacities of the copper/iron composite anodes increase gradually with cycles going on, as high as 266.6 mA h g-1 and 246.5 mA h g-1 at the 200th cycle for the electrodes (Cu0.2, Cu0.6), respectively. However, the discharge capacity of the electrode (Cu0) gradually decays with cycling after the formation process finished (1~50th cycles), and the bad trend is not improved even exchanged to fresh electrolyte at 82th cycle. Apparently, the cycle performance of the iron electrode is improved by the copper/iron composite materials.
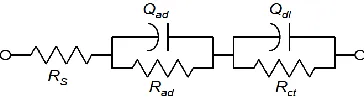
[image:9.596.186.411.559.717.2]Figure 9. The equivalent circuit of various iron electrodes
Table 1. Kinetics parameters of various iron electrodes
Resistance After activation
x=0 x=0.2 x=0.6
Rad / Ω 0.3556 0.3484 0.3477
Rct / Ω 79.41 56.93 57.92
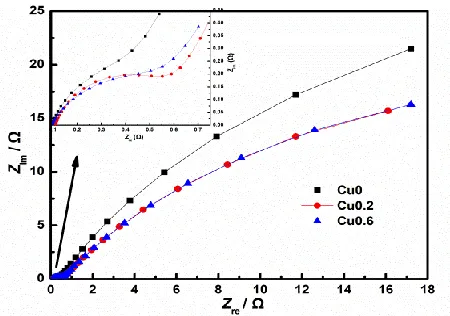
The dynamic properties of different iron electrodes were investigated by the electrochemical impedance spectroscopy (EIS). Fig.8 and Fig.9 are the Nyquist plots and equivalent circuit of various iron electrodes, respectively. The initial intercept of the horizontal ordinate represents the solution resistance (Rs) of the battery. The capacitive arc in the high frequency region represents surficial
resistance (Rad) and capacitance (Qad). The semicircle similarly in the low frequency region represents
charge-transfer resistance (Rct) and double capacitance (Qdl). The fitting values are presented in table 1.
As we can see, the Rad-values of the copper/iron composite electrodes are lower slightly than the pure
iron electrode, but all are small; However, the Rct-values of the electrodes decrease from 79.41 Ω for
electrode (Cu0) to 56.93 Ω and 57.92 Ω for electrode (Cu0.2, Cu0.6), respectively. Thus, illustrate that the metallic Cu in the composite materials improves the dynamic performance of pure iron electrodes.
Figure 10. Polarization curves of various iron electrodes in alkaline liquid of 8 M KOH + 0.05 M Na2S
Fig.10 shows polarization curves of various iron electrodes in alkaline solution of 8 M KOH + 0.05 M Na2S. As can be seen, the hydrogen evolution potential is -0.960 V and -0.965 V for the
[image:10.596.179.417.466.652.2]
Thus, fully illustrates that the copper/iron composite electrode raises the hydrogen evolution over-potential of the iron electrode.
4. CONCLUSIONS
In summary, the copper/iron composite anode materials were synthesized by co-precipitation method followed by calcination at high temperature, which exhibited significantly improved electrochemical performance. Even the discharge-rate is as high as 10 C, or the temperature is as low as 253 K, the cells still exhibited good discharge capacity (130 mA h g-1 and 145 mA h g-1, respectively). EIS and polarization tests proved that metallic Cu in the composite materials not only delayed the passivation of the iron electrode, improved the anodic dynamics, but also raised the hydrogen evolution overpotential, both resulting in the excellent performance of the copper/iron composite anode.
ACKNOWLEDGMENT
The research was supported by provincial support project of Sichuan, China (Grants No.0060305301007)
References
1. C. Chakkaravarthy, P. Periasamy, S. Jegannathan, K.I.Vasu, J. Power Sources, 35 (1991) 21. 2. A.K. Shukla, S. Venugopalan, B. Hariprakash, J. Power Sources, 100 (2001) 125.
3. H. Ibrahim, A. Ilinca, J. Perron, J. Renew. Sustain. Ener., 12 (2008) 1221.
4. A.K. Manohar, S. Malkhandi, B. Yang, C.G. Yang, G.K.S. Prakash and S.R. Narayanan, J. Electrochem. Soc., 159 (2012) A1209.
5. G.P. Kalaignan, V.S. Muralidharan, K.I. Vasu, J. Appl. Electrochem., 17 (1987) 1083. 6. M.K. Ravikumar, T.S. Balasubramanian, A.K. Shukla, J. Power Sources, 56 (1995) 209. 7. P. Periasamy, B.R. Bahu, S.V. Iyer, J. Power Sources, 62 (1996) 9.
8. M.K. Ravikumar, T.S. Balasubramanian, A.K. Shukla, J. Appl. Electrochem., 26 (1996) 1111. 9. C.A. Caldas, M.C. Lopes, I.A. Carlos, J. Power Sources, 74 (1998) 108.
10.C.A.C. Souza, I.A. Carlos, M. Lopes, G.A. Finazzi, M.R.H. de Almeida, J. Power Sources, 132 (2004) 288.
11.B.T. Hang, S.H. Yoon, S. Okada, J.I. Yamaki, J. Power Sources, 168 (2007) 522. 12.Y.D. Wang, X.P. Ai, Y.L. Cao, H.X. Yang, Electrochem. Commun., 6 (2004) 780. 13.K.C. Huang, K.S. Chou, Electrochem. Commun., 9 (2007) 1907.
14.C.Y. Kao, K.S. Chou, J. Power Sources, 195 (2010) 2399.
15.C.Y. Kao, Y.R. Tsai, K.S. Chou, J. Power Sources, 196 (2011) 5746.
16.B. Yang, S. Malkhandi, A.K. Manohar, G.K.S. Prakash and S.R. Narayanan, Energ. Environ. Sci., 7 (2014) 2753.
17.B. Hariprakash, S.K. Martha, M.S. Hegde and A.K. Shukla, J. Appl. Electrochem., 35 (2005) 27. 18.B.T. Hang, T. Watanabe, M. Eashira, S. Okada, J.I. Yamaki, S. Hata, S.H. Yoon, I. Mochida, J.
Power Sources, 150 (2005) 261.
19.U. Casellato, N. Comisso, G. Mengoli, Electrochim. Acta, 51 (2006) 5669. 20.K. Ujimine, A. Tsutsumi, J. Power Sources, 160 (2006) 1431.
22.H. Kimura, K. Tsuda, S. Kameoka, A.P. Tsai, The Annual Meeting Phys. Soc., Japan, 2006, 24aYK-9.
23.S. Kameoka, T. Tanabe, A.P. Tsai, Appl. Catal., A, 375 (2010) 163.
24.E. Shangguan, F. Li, J. Li, Z.R. Chang, Q.M. Lia, X.Z. Yuan, H.J. Wang, J. Power Sources, 291 (2015) 29.
25.A.K. Manohar, C. Yang, S. Malkhandi, G.K.S. Prakash and S.R. Narayanan, J. Electrochem. Soc., 160 (2013) A2078.