Atmos. Chem. Phys., 19, 4823–4849, 2019 https://doi.org/10.5194/acp-19-4823-2019 © Author(s) 2019. This work is distributed under the Creative Commons Attribution 4.0 License.
A comprehensive characterization of ice nucleation by three
different types of cellulose particles immersed in water
Naruki Hiranuma1, Kouji Adachi2, David M. Bell3,a, Franco Belosi4, Hassan Beydoun5, Bhaskar Bhaduri6,b,
Heinz Bingemer7, Carsten Budke8, Hans-Christian Clemen9, Franz Conen10, Kimberly M. Cory1, Joachim Curtius7, Paul J. DeMott11, Oliver Eppers12, Sarah Grawe13, Susan Hartmann13, Nadine Hoffmann14, Kristina Höhler14, Evelyn Jantsch8, Alexei Kiselev14, Thomas Koop8, Gourihar Kulkarni3, Amelie Mayer12, Masataka Murakami2,c, Benjamin J. Murray15, Alessia Nicosia4,d, Markus D. Petters16, Matteo Piazza4, Michael Polen5, Naama Reicher6, Yinon Rudich6, Atsushi Saito2, Gianni Santachiara4, Thea Schiebel14, Gregg P. Schill11, Johannes Schneider9, Lior Segev6, Emiliano Stopelli10,e, Ryan C. Sullivan5, Kaitlyn Suski3,11, Miklós Szakáll12, Takuya Tajiri2, Hans Taylor16, Yutaka Tobo17,18, Romy Ullrich14, Daniel Weber7, Heike Wex13, Thomas F. Whale15, Craig L. Whiteside1, Katsuya Yamashita2,f, Alla Zelenyuk3, and Ottmar Möhler14
1Department of Life, Earth and Environmental Sciences, West Texas A&M University, Canyon, TX, USA 2Meteorological Research Institute (MRI), Tsukuba, Japan
3Pacific Northwest National Laboratory, Richland, WA, USA
4Institute of Atmospheric Sciences and Climate, National Research Council, Bologna, Italy 5Center for Atmospheric Particle Studies, Carnegie Mellon University, Pittsburgh, PA, USA 6Department of Earth and Planetary Sciences, Weizmann Institute, Rehovot, Israel
7Institute for Atmospheric and Environmental Science, Goethe University of Frankfurt, Frankfurt am Main, Germany 8Faculty of Chemistry, Bielefeld University, Bielefeld, Germany
9Max-Planck-Institut für Chemie, Particle Chemistry Department, Mainz, Germany 10Environmental Geosciences, University of Basel, Basel, Switzerland
11Department of Atmospheric Science, Colorado State University, Fort Collins, CO, USA 12Institute for Atmospheric Physics, University of Mainz, Mainz, Germany
13Leibniz Institute for Tropospheric Research, Leipzig, Germany
14Institute for Meteorology and Climate Research – Atmospheric Aerosol Research,
Karlsruhe Institute of Technology, Karlsruhe, Germany
15Institute for Climate and Atmospheric Science, School of Earth and Environment, University of Leeds, Leeds, UK 16Department of Marine, Earth, and Atmospheric Sciences, North Carolina State University Raleigh, Raleigh, NC, USA 17National Institute of Polar Research, Tachikawa, Tokyo, Japan
18Department of Polar Science, School of Multidisciplinary Sciences, SOKENDAI (The Graduate University for Advanced
Studies), Tachikawa, Tokyo, Japan
anow at: Laboratory of Atmospheric Chemistry, Paul Scherrer Institute, Villigen, Switzerland bnow at: Department of Soil and Water Sciences, Hebrew University of Jerusalem, Israel cnow at: Institute for Space-Earth Environmental Research, Nagoya University, Nagoya, Japan dnow at: Laboratoire de Météorologie Physique (Lamp-CNRS) Aubiere, France
enow at: Water Resources and Drinking Water Department, Eawag, Dübendorf, Switzerland
fnow at: Snow and Ice Research Center, National Research Institute for Earth Science and Disaster, Nagaoka, Japan
Correspondence:Naruki Hiranuma ([email protected]) and Ottmar Möhler ([email protected]) Received: 5 September 2018 – Discussion started: 14 September 2018
Abstract. We present the laboratory results of immersion freezing efficiencies of cellulose particles at supercooled temperature (T ) conditions. Three types of chemically ho-mogeneous cellulose samples are used as surrogates that rep-resent supermicron and submicron ice-nucleating plant struc-tural polymers. These samples include microcrystalline lulose (MCC), fibrous cellulose (FC) and nanocrystalline cel-lulose (NCC). Our immersion freezing dataset includes data from various ice nucleation measurement techniques avail-able at 17 different institutions, including nine dry disper-sion and 11 aqueous suspendisper-sion techniques. With a total of 20 methods, we performed systematic accuracy and pre-cision analysis of measurements from all 20 measurement techniques by evaluatingT-binned (1◦C) data over a wide T range (−36◦C< T <−4◦C). Specifically, we intercom-pared the geometric surface area-based ice nucleation ac-tive surface site (INAS) density data derived from our mea-surements as a function of T, ns,geo(T ). Additionally, we
also compared the ns,geo(T ) values and the freezing
spec-tral slope parameter (1log(ns,geo)/1T )from our
measure-ments to previous literature results. Results show all three cellulose materials are reasonably ice active. The freezing efficiencies of NCC samples agree reasonably well, whereas the diversity for the other two samples spans ≈10◦C. De-spite given uncertainties within each instrument technique, the overall trend of the ns,geo(T ) spectrum traced by the
T-binned average of measurements suggests that predomi-nantly supermicron-sized cellulose particles (MCC and FC) generally act as more efficient ice-nucleating particles (INPs) than NCC with about 1 order of magnitude higherns,geo(T ).
1 Introduction 1.1 Background
Glaciation of supercooled clouds through immersion freez-ing induced by ice-nucleatfreez-ing particles (INPs) is an important atmospheric process affecting the formation of precipitation and the Earth’s energy budget (Boucher et al., 2013; Vergara-Temprado et al., 2018). Currently, the climatic impact of INPs is, however, uncertain due to our insufficient knowledge regarding their diversity and abundance in the atmosphere (e.g., Hoose and Möhler, 2012; Murray et al., 2012; Kanji et al., 2017; Knopf et al., 2018). Recently, microcrystalline cellulose (MCC) particles of<16 µm in diameter, extracted from natural wood pulps (Aldrich, 435236), have been iden-tified as an efficient INP (Hiranuma et al., 2015a, H15a here-after). Experiments with this surrogate may provide useful information to understand the role of biological INPs in the troposphere as presented in H15a. Conspicuously, the H15a modeling results suggest that the tropospheric concentration of ice-nucleating cellulose becomes substantial (>0.1 L−1) below about−21◦C.
Cellulose is a linear polymer of 1–4 linked β -d-anhydroglucopyranose molecules, deriving from plant frag-ments, leaf litter, wood fiber, non-wood fiber and/or even mi-crobes (Quiroz-Castañeda and Folch-Mallol, 2013; Thakur and Thakur, 2014; Chawla et al., 2009). The composition and structure of cellulose-containing bio-fiber depends on the source and several different factors, summarized in Khalil et al. (2012) and Dittenber and GangaRao (2012). In general, airborne cellulose particles are prevalent (>0.05 µg m−3) throughout the year even at remote and elevated locations as reported in Sánchez-Ochoa et al. (2007). A more recent study of carbonaceous aerosol composition in Switzerland over 2 years showed that ambient cellulose represents approxi-mately 36 %–60 % of primary biological organic aerosols, and the ambient cellulose concentration exceeded a few mi-crograms per cubic meter (Figs. 6 and 7d of Vlachou et al., 2018). Their water-insoluble, hydrolysis-resistant and heat-resistive features (Fernández et al., 1997; Quiroz-Castañeda and Folch-Mallol, 2013) may in part explain the long-range transport and high concentrations of cellulose even at geo-graphically dispersed sites. Another unique characteristic of ambient cellulose is its wide range of physical size avail-able for freezing. For example, the size distribution measure-ments of ambient cellulose particles by Puxbaum and Tenze-Kunit (2003) indicate the presence of particulate cellulose in the range from 10 nm to >20 µm. The presence of su-permicron particles, possessing larger surfaces compared to submicron ones, is remarkable since they can potentially act as supermicron-sized INPs since large surfaces may promote efficient formation of ice embryos (Pruppacher and Klett, 2010; Schnell and Vali, 1972 and 1973). Nevertheless, more comprehensive characterization of ice-nucleating properties of various cellulose-containing particles is necessary to ex-amine if the ice-nucleating activity is specific to MCC or gen-erally relevant to all cellulose materials in the atmosphere. 1.2 Previous INUIT activities
In 2012, the German research consortium-led INUIT (Ice Nuclei research UnIT) project was commenced to compre-hensively study heterogeneous ice nucleation processes in the atmosphere. Throughout the period since, this project has provided a transnational platform to bolster collaborative re-search activities between meticulous groups who study atmo-spheric INPs. In turn, INUIT has accelerated ice nucleation research in a wide range of study scales from nanoscopic mi-crophysics (e.g., Kiselev et al., 2017) to cloud-scale model-ing (e.g., Diehl and Mitra, 2015; Paukert and Hoose, 2014) in cross- and interdisciplinary manners.
prepara-N. Hiranuma et al.: A comprehensive characterization of ice nucleation 4825
tion methods). For example, Burkert-Kohn et al. (2017) con-ducted the intercomparison workshop by co-deploying in-struments with a uniform aerosol dispersion procedure and size segregation method to minimize the diversity in ice nu-cleation results. Hiranuma et al. (2015b), H15b henceforth, took a different approach to perform an intercomparison of INP measurement techniques. The authors demonstrated the collaborative multi-institutional laboratory work with a total of 14 institutions (seven from Germany, four from the US, one from the UK, one from Switzerland and one from Japan) by distributing a test particulate sample to partners and al-lowing measurements at their home laboratories. The authors discussed the potential effect of sampling of the dust, ag-glomeration, flocculation, surface estimation methods, mul-tiple nucleation modes and chemical aging on the observed data deviation amongst 17 different IN instruments. This study suggested that a combination of above-listed factors may be responsible for∼8◦C diversity in terms of
temper-ature and up to 3 orders of magnitude difference with re-spect to the ice nucleation active surface site (INAS) den-sity, ns(T ), parameters. Further, two follow-up studies on
potential effects of aggregation upon IN were performed in Emersic et al. (2015) and Beydoun et al. (2016). The former study presented the potential role of aggregation and sedi-mentation of mineral particles, altering their IN efficiency in aqueous suspension, by combining experimental and model-ing approaches. The latter study presented a subset of cellu-lose data used in this study, and the authors postulated that the widening of the frozen fractions and enhanced ice activ-ity towards highT was attributable to increased diversity in ice-nucleating activity for lower concentrations and particle surfaces. In other words, there is a distribution of active sites between individual droplets depending on the total surface area. Nevertheless, our understanding of overall consistency of current INP measurement techniques and dominant mech-anisms that may be responsible for diversity among measure-ments is still insufficient.
1.3 Goals
The measurement strategy for this study was formulated in 2015 to further augment our understanding of the sen-sitivity of various ice nucleation instruments with respect to immersion freezing efficiencies. Beyond official INUIT-participating institutes, including Bielefeld University (BU), Goethe University Frankfurt (GUF), Johannes Gutenberg University of Mainz (JGU), Karlsruhe Institute of Tech-nology (KIT), the Max Planck Institute for Chemistry (MPIC), the Leibniz Institute for Tropospheric Research (TROPOS), the Technical University of Darmstadt (TUD) and the Weizmann Institute of Science (WIS), 10 associ-ated institutes (five from the US, three from Europe and two from Japan) are involved in this study. These associ-ated partners include Carnegie Melon University (CMU), Colorado State University (CSU), North Carolina State
Uni-versity (NC State), the Pacific Northwest National Labo-ratory (PNNL), West Texas A&M University (WTAMU), the Institute of Atmospheric Sciences and Climate-National Research Council (ISAC-CNR), the University of Basel, the University of Leeds, the Meteorological Research In-stitute (MRI) and the National InIn-stitute of Polar Research (NIPR). In this study, we have used three cellulose sam-ples, microcrystalline cellulose (MCC, Aldrich, 435236), fi-brous cellulose (FC, Sigma, C6288) and nanocrystalline cel-lulose (NCC, Melodea, WS1), as atmospheric surrogates for non-proteinaceous biological particles. These samples were shared with all collaborators, and immersion freezing ex-periments were conducted individually at each institution to obtain immersion freezing data as a function of multi-experimental parameters (see Sect. 3.1). The motivation of using multiple types of cellulose was to (1) examine the im-mersion freezing abilities of both predominantly supermi-cron (MCC and FC) and submisupermi-cron (NCC) cellulose particles to assess a wide size range of chemically uniform biological particles and (2) look into diverse surface structure (Table 1) A total of 20 measurement techniques are used in this study to compile a comprehensive dataset for evaluating im-mersion freezing properties of cellulose samples. The dataset is analyzed to understand functional dependence of various experimental parameters and of cellulose particle character-istics. In this work, 11 instruments test samples used aque-ous suspensions while nine examined aerosolized powders dispersed in synthetic air with a low relative humidity (RH) or atomized/nebulized suspensions containing cellulose sam-ples followed by a diffusion drying process, referred to as dry dispersion methods henceforth. The basic experimental methods and parameterization approaches used to interpret the data are discussed in Sect. 3.1 and 3.2.
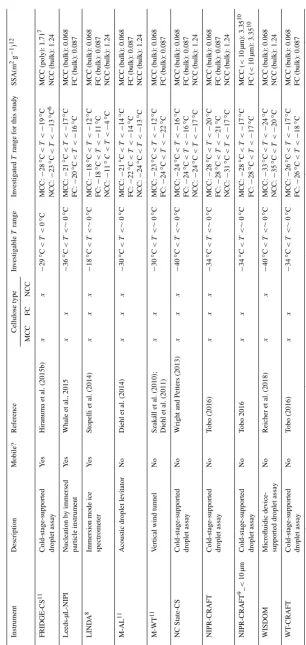
Table 1.Properties of microcrystalline cellulose (MCC), fibrous cellulose (FC) and nanocrystalline cellulose (NCC).
System MCC
(Aldrich, 435236)
FC
(Sigma, C6288)
NCC
(Melodea, WS1)15
Chemical formula (C6H10O5)n (C6H10O5)n (C6H9O5)n(SO3Na)x
Product form Powder Powder 3 wt % thixotropic gel
(viscosity∼4.665±200 cP at 25◦C) in deionized water
Density1, g m−3 ∼1.5 ∼1.5 ∼1.0–1.1
Geometric mode diameter (±standard deviation) of dispersed particles, µm2
1.22±<0.13,4 1.13±<0.15,4 0.21±<0.16,7
SEM-based mode diameter of bulk materials (±standard deviation), µm
54.24±6.2 >65 2.68±0.38
Manufacturer-reported diameter
51 µm N/A 5–20 nm width,
100–500 nm length
Aspect ratio 1.80–2.30 (4976/3)9 ∼2.03 (371/1) 2.30–2.93 (764/2)
Geometric SSA10, m2g−1 3.35±0.1 3.35±0.5 18.59±2.5
SEM-based SSA of
residuals in 0.03 wt % of 5 µL droplet, m2g−111
0.068 0.087 1.24
BET-based SSA12, m2g−1 1.44±0.10 1.31±0.10 8.00±1.00
Crystallinity ∼80 % (cellulose Iβ
crystallographic structure)13
N/A 87 % (cellulose Iβ
crystallographic structures)14 1Bulk density values according to manufacturers.2Based on1S/1logD
vefrom ADIA measurements.3Measured by a combination of a scanning mobility particle sizer (SMPS) and an aerodynamic particle sizer (APS) at Aerosol Interaction and Dynamics in the Atmosphere (AIDA) (INUIT06_1, 17, 31, 42, 43, 44, 45, 46, 54).4Dry particles were dispersed into the AIDA chamber using a rotating brush generator (RBG1000, PALAS).5Measured by a combination of SMPS and APS at AIDA (INUIT06_6, 14).6Measured by a combination of SMPS and APS at AIDA (INUIT08_6, 7, 9, 10). 7Water-suspended NCC was aerosolized using the customized-atomizer (Wex et al., 2015).8The SEM-based mode diameter of atomized NCC is 0.28±<0.1µm, which is similar to that of bulk NCC.9Average aspect ratio per substrate: the numbers in parentheses represent a total number of particles/substrate(s) analyzed under SEM for each subset.10Geometric SSA is derived from ADIA measurements (i.e., fraction of total surface area concentration to total mass concentration estimated from a combination of SMPS and APS; see Fig. S1). The particles in AIDA were all<10µm in diameter.11Measured using droplet residuals derived from 5 µL of 0.03 wt % suspension. Uncertainty is not given because all individual particle counts were compiled to calculate the SSA value of each sample.12Brunauer et al., 1938.13Nishiyama et al., 2002.14Aulin et al., 2009.15Two NCC samples from different batches, namely non-sterile NCC (NCC01) and freshly generated NCC (NCC02), were used for the IN characterization.
2 Sample characterization
All of our samples are linear polymers of glucosyl deriva-tives, mechanically extracted through<200◦C heat applica-tion and catalytic oxidaapplica-tion (e.g., Battista et al., 1962; Brinchi et al., 2013). In particular, MCC is extracted from hardwoods (e.g., oak; personal communication with the manufacturer, Aldrich). A summary of major properties of three samples is provided in Table 1. Briefly, these highly stable biopolymers, whose bulk density ranges between 1.0 and 1.5 g cm−3, ex-hibit different physical dimensions depending on sample pro-cessing and treatments. As seen in Table 1, the geometric size of dispersed particles is more than 10-fold smaller than the size of bulk materials measured by electron microscopy with-out any exception, suggesting the presence of super
N. Hiranuma et al.: A comprehensive characterization of ice nucleation 4827
diameter of>2.5 µm. A more detailed discussion of particle and residual size distributions is available in Sect. S1 in the Supplement.
The average aspect ratios (ARs) of each cellulose material in Table 1 were estimated with an identical procedure em-ployed in our previous H15a study. We evaluated a total of 4.976 MCC, 371 FC and 764 NCC particles. The Everhart– Thornley detector (ETD) of a scanning electron microscope (SEM, FEI, Quanta 650 FEG) was used to acquire the below-the-lens micrograph image and measure two-dimensional axis length of particles deposited on membrane filters. The degree of elongation appears to be higher for NCC (average AR up to 2.93) when compared to MCC and FC (average AR of<2.30). Nonetheless, all sample types show that par-ticles are elongated with an aspect ratio varying from∼2 to 3, which is similar to our previous measurement on MCC particles (i.e., 2.1).
Three different measurements of the unit surface area per unit mass (specific surface area, SSA), namely geo-metric SSA, SEM-based SSA and Brunauer–Emmett–Teller (BET) SSA, for each system are also shown in Table 1. These measurements correspond to SSA of (1) mechanically aerosolized particles (<10 µm in diameter) in the Aerosol Interaction and Dynamics in the Atmosphere (AIDA) cham-ber, (2) droplet residuals obtained after evaporating water content of a 5 µL droplet of 0.03 wt % aqueous suspension and (3) bulk samples. Our intention of using different SSA metrics is to provide the most adequate parameter for the ns,geo(T )estimation of individual techniques based on their
characteristics (e.g., geometric SSA for dry dispersion niques and SEM-based SSA for aqueous suspension tech-niques). As demonstrated in our previous H15b comparison effort, when a reduced SSA value is observed for the same sample, it indicates the presence of agglomeration. Hence, the degree of aggregation of cellulose fibers is presumably responsible for the observed differences in SEM-based SSA values for residuals obtained from suspensions from geo-metric SSA of the mechanically aerosolized particles (Ta-ble 1). Alternatively, a loss of larger particles from the sam-ple, which may happen in airborne aerosols due to settling or impaction in the particle generation setup may also lead to different SSA values if the surface properties of the cel-lulose particles differ with the particle size. A more detailed discussion of chemical composition and impurity analyses of our sample materials, including single-particle aerosol spec-trometry and scanning electron microscopy, are discussed in Sects. S2 and S3 in the Supplement, respectively.
3 Methods
3.1 Ice nucleation measurements
A total of 20 techniques were used to investigate the ice-nucleating properties, in particular immersion freezing (Vali
et al., 2015), of cellulose particles (Table 2). In this study, nine techniques employed dry dispersion methods that re-fer to experiments employing water vapor condensation onto dry dispersed particles followed by droplet freezing, and an-other set of 11 techniques used aqueous suspension meth-ods that denote the experiments started with the test sample pre-suspended in water before cooling. Detailed information of individual methods and their applications to study atmo-spherically relevant INPs are provided in references given in Table 2 and elsewhere (e.g., DeMott et al., 2017). More de-tailed quantitative and nominal descriptions of both dry dis-persion and aqueous suspension methods used in this study are available in Sect. S4.
Note that only nonmandatory guidelines were provided as an experimental protocol by INUIT to those who employed aqueous suspension techniques, and the experimental proto-col for the wet suspension techniques was decided by each investigator. The intention was not to introduce limitations and constraints to participants. For MCC and FC, the INUIT protocol recommended the following procedures:
1. measurements with<0.05 wt % suspension,
2. idle time of∼30 min without stirring for large particles to settle out,
3. preparation of droplets out of the quasi-steady state sus-pension (i.e., the upper layer of the sussus-pension), 4. storage of the sample in the chemically inert container
at ambient temperature.
In a similar way, for NCC, the INUIT protocol suggested 1. 1 min sonication of the original sample for initial
ho-mogenization,
2. dilution to the desired final concentration using deion-ized water (18.2 Mcm−1),
3. mixing the suspension vigorously for 3 min using a high-shear mechanical stirrer, homogenizer or probe sonicator to obtain a homogenous suspension, alterna-tively, using an ultrasonic bath for 30 min in the case of a sample volume<10 mL,
4. measurements with <0.03 wt % in order to diminish particle aggregation,
5. storage of the sample in a dry and cool (4◦C)
environ-ment.
More detailed discussion regarding nominal parameters is given in Sect. S4.
3.2 Ice nucleation parameterization
and aqueous suspension techniques. The immersion freezing data of cellulose particles in a wide range of temperatures is then discussed by comparing ns,geo(T ) spectra from all 20
instruments. Please note that using the scaled metrics for the validation (e.g.,ns,geo(T )scaling with the technique-specific
SSA value) is indispensable in this study because the changes or uncertainties in surface area amongst groups are an issue as described in Sect. S4. The INP concentration per volume of air (nINP(T ); e.g., DeMott et al., 2017; Vali, 1971) is a
useful parameter for instrumental evaluation when utilizing identical samples at a single location with known sampling flows but is not applicable in this work.
The majority of dry dispersion methods employ the ap-proximation of Niemand et al. (2012). If the activated ice fraction is small (<0.1), the Taylor series approximation can be applied, and we can estimatens,geo(T ):
ns,geo(T )= −ln
1−Nice(T )
Ntotal
1 Sve
(1)
≈Nice(T )
NtotalSve
=Nice(T )
Stotal
,
in whichNice(T )is the cumulative number concentration of
formed ice crystals at T (cm−3),Ntotal is the total number
concentration of particles prior to any freezing event (cm−3), Sve is the volume-equivalent surface area of an individual
particle (m2)andStotalis the total surface area (m2). For the
LACIS (Leipzig Aerosol Cloud Interaction Simulator) data, the left part of Eq. (1) was used without any approximation.
One distinct exception is the electrodynamic balance (EDB) method, in which the probability of contact freezing on a single collision, ec, is first inverted from frozen
frac-tion (FF) to take into account the rate of collision and, then, scaled to surface area of a single INP to estimatens,geo(T )
(Hoffmann et al., 2013a, b): ns,geo(T )=
ec(T )
kimm·Sve
. (2)
Note that the INP colliding with the supercooled droplet is only partially submersed in water, and therefore the sur-face available for nucleation is corrected by a dimensionless factorkimm. The value of this factor depends on the
wetta-bility of the particle surface and is generally unknown. In this work,kimm=1 has been assumed. The effective surface
area of MCC particles has been derived from the scanning electron microscope images of the particles collected on the Nuclepore® membrane filters placed inline to the EDB, as described in Sect. S1.
The results of 11 aqueous suspension methods are inter-preted in terms of the frozen fraction (FF), INP concentration per volume of liquid (cINP, Vali, 1971) and geometric
size-based ice nucleation active surface-site density (ns,geo(T );
Connolly et al., 2009; H15b). The cumulative FF atT is FF(T )=1−Nu
N , (3)
whereNuis the number of unfrozen droplets and N is the
total number of originally liquid entities. Following Eq. (1) in DeMott et al. (2017), conversion tocINPatT is expressed
by
cINP(T )= −
1 Vd
ln N
u(T )
N
, (4)
whereVd represents the individual droplet volume. Finally,
thens,geo(T )value as a function ofT can be estimated by
ns,geo(T )=
cINP(T )
ρwωθ
, (5)
whereρwis the water density (=997.1 g L−1),ωis the mass
ratio of analyte and water (unit-less), andθis the SSA value (m2g−1), provided in Tables 2, S1 and S2.
Accordingly, we compare the ns,geo(T ) and
1log(ns,geo)/1T (i.e., the freezing spectral slope
pa-rameter, H15b) data from our measurements to five literature results. These reference results include previously reported ns,geo(T )curves of illite NX particles from H15b (hereafter
H15NX), MCC particles from H15a (hereafter H15MCC), Snomax (Wex et al., 2015, hereafter W15), desert dusts (Ull-rich et al., 2017, hereafter U17) and K feldspar (Atkinson et al., 2013, hereafter A13). Thens,geo(T )(m−2as a function
of◦C) fits from the reference literature are
nH15NXs,geo ,dry=exp((27.92×exp(−exp(0.05 (6)
×(T+13.25))))+6.32),
T ∈ [−37,−18];1log(ns,geo)/1T =0.18,
nH15NXs,geo ,wet=exp((22.64×exp(−exp(0.16 (7)
×(T+20.93))))+5.92),
T ∈ [−34,−11];1log(ns,geo)/1T =0.37,
nH15MCCs,geo ,dry=exp(−0.56×T +7.50), (8)
T ∈ [−30,−15];1log(ns,geo)/1T =0.24,
nH15MCCs,geo ,wet=
2.57×10⁷+ −2.84×10⁷
1+exp(−251..1945−T)
SEM−basedSSAMCC
, (9)
T ∈ [−28,−22];1log(ns,geo)/1T =0.35,
nW15s,geo=
(1.40×1012)
× 1−(exp((−2.00×10⁻¹⁰ exp(−2.34×T ))))
geometric SSASnomax
, (10)
T ∈ [−38,−2];1log(ns,geo)/1T =0.88(−2◦C< T <−10.7◦C),
N. Hiranuma et al.: A comprehensive characterization of ice nucleation 4831
nA13s,geo=104×exp(−1.038(T+273.150)+275.260) (12)
×BET−SSAK−feldspar
geo−SSAK−feldspar
,
T ∈ [−25,−5];1logns,geo)/1T=0.45.
For H15MCC (wet), thenm(T )-to-ns,geo(T )conversion was
performed using SEM-based SSA constants of 0.068 m2g−1. The geometric SSA value of 7.99 m2g−1was used for W15. This SSA value was derived from the polydisperse particle size distribution measurements of Snomax obtained during AIDA studies, whose IN data are included to compute im-mersion freezing results reported in Wex et al. (2015). For microcline (K feldspar), thens,geo(T )-to-ns,BET(T ),
conver-sion was performed using a laser diffraction-based geometric SSA of 0.89 m2g−1and an N2 BET SSA of 3.2 m2g−1
re-ported in Atkinson et al. (2013). Please note that laser diffrac-tion tends to be sensitive to the larger particles in a distribu-tion, so it may miss the smaller particles and underestimate surface area.
3.3 Temperature binning
A consistent data interpolation method is important to sys-tematically compare different ice nucleation measurement methodologies as demonstrated in H15b. In this study, we presentT-binned average ice nucleation data (i.e., 1◦C bins for −36◦C< T <−4◦C). Unless the data were originally provided in 1◦C binned data (i.e., weighted average or cu-mulative counts) (i.e., BINARY, DFPC-ISAC, FRIDGE-CS (MCC portion), LINDA, NC State-CS, NIPR-CRAFT, WIS-DOM and WT-CRAFT), all data are binned in a consistent manner using either a moving average (where original data points are finer than 1◦C) or a piecewise cubic hermite inter-polating polynomial function (where original data points are equivalent to or coarser than 1◦C). For the former case, the default span for the moving average is 3 (i.e., centered mov-ing average for a 0.5◦C resolution data). If the temperature resolution is finer than 0.5◦C, the number of moving average
span is equal to the number of data points in each tempera-ture bin (an even span is reduced by 1). The comparison of T-binned immersion freezing spectra from particle disper-sion methods and aqueous suspendisper-sion methods is discussed in Sect. 4.1.
4 Results and discussions
4.1 Dry dispersion vs. aqueous suspension methods Temperature-binned ensemblens,geo(T )spectra of MCC, FC
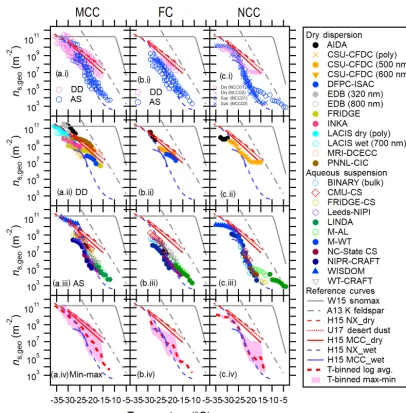
and NCC in a temperature range between −4 and−38◦C are presented in Fig. 1. Different columns (a–c) correspond to different sample types: (a) MCC, (b) FC and (c) NCC. Figure 1a.i, b.i and c.i show a comparison between dry-dispersion-type measurements and aqueous suspension
mea-surements of cellulose samples with previous parameteri-zations of other reference samples (Fig. 1a.i, b.i, c.i). The ns,geo(T )spectra from each subgroup of techniques are
inde-pendently summarized in Fig. 1a.ii–c.ii and a.iii–c.iii. More detailed representations of ns,geo(T ) spectra from
individ-ual techniques are discussed in Sect. 4.3. Lastly, Fig. 1a.iv, b.iv and c.iv show the overall deviation between maxima and minima ofns,geo(T )as pink shaded areas. As inferred from
Fig. 1a.i–c.i, a.ii–c.ii and a.iii–c.iii, dry particle-dispersed measurements generally show higherns,geo(T )values than
aqueous suspension measurements above−24◦C regardless of sample types. Furthermore, as apparent in Fig. 1a.iv–c.iv, thens,geo(T )differences among measurements can extend to
up to 3 orders of magnitude at−20◦C (for MCC and FC) and
−15◦C (for NCC), where the results from particle dispersion measurements and a majority of suspension measurements coexist.
The observed divergence in ns,geo(T ) is most
sig-nificant at temperatures higher than −24◦C, where the slope in the aqueous suspension spectra is steeper (i.e., 1log(ns)/1T >0.34). Most aqueous suspension methods
capture the abruptly increasing segment of the ns,geo(T )
spectral slopes at−20◦C> T >−25◦C. In thisT region, the slope is virtually identical to the slopes of wet H15NX and H15MCC spectra (0.35–0.37, Eqs. 7 and 9) and is also closely parallel to the A13 parameterization (0.45, Eq. 12), suggesting the number of active sites are different. Likewise, ourT-binned data from dry dispersion methods exhibit sim-ilarns,geo(T )values when compared to the previous
param-eterizations. For instance, our dry-dispersed cellulose spec-tra (i.e.,1log(ns)/1T of 0.20, 0.28 and 0.22 for MCC, FC
and NCC) present trends comparable to the dry H15 curves (0.18–0.24, Eqs. 7 and 9) and U17 parameterization (0.22, Eq. 11).
It is interesting that a similar difference between dry dis-persion and aqueous suspension results (i.e., ns,geo(T ) of
dry-dispersed particle> ns,geo(T ) of suspension results) is
made by previous intercomparison activities with mineralog-ically heterogeneous dust particles (Emersic et al., 2015; H15b). In brief, Emersic et al. (2015) report the dry disper-sion chamber-measured ns,geo(T ) can be up to a factor of
1000 larger than the cold stage results for multiple mineral dust samples, including illite NX, kaolinite and K feldspar. Our previous study also shows thatns,geo(T )of illite NX
in-creases sharply at lower temperatures in theT range from
−18 to −27◦C, followed by the leveling off segment at the low-temperature region. It is certainly common for the ns,geo(T )spectrum to level off at thens,geo(T )maxima. As
mentioned in Sect. 1.2, several studies (Emersic et al., 2015; Beydoun et al., 2016) reported the mechanism of the ob-served divergence between two subsets of methods. Nonethe-less, the reduction in the slope ofns,geo(T )spectrum may be
a plausible contributor to the higher reportedns,geo(T )values
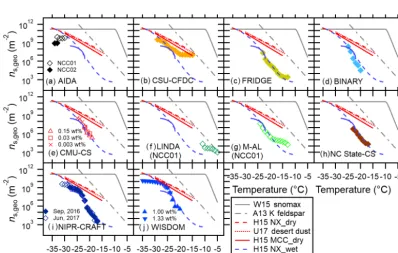
Microar-Figure 1.Immersion freezingns,geo(T )spectra for MCC(a), FC(b)and NCC(c)from different techniques. Dry dispersion results (DD, pink markers) and aqueous suspension results (AS, blue markers) are shown in (a.i–c.i)to highlight the difference between these two subsets. Intercomparisons of DD and AS for each cellulose sample type usingT-binnedns,geo are presented in(a.ii–c.ii)and(a.iii–c.iii), respectively. The log average of all results as well as the deviation between maxima and minima ofns,geo(T )are shown in(a.iv–a.iv). Reference immersion freezingns(T )spectra for MCC (H15a) illite NX (H15b), Snomax (Wex et al., 2015), desert dusts (U17; Ullrich et al., 2017) and K feldspar (A13; Atkinson et al., 2013) are also shown (see Sect. 4.1). For NCC, the results from two different batches (NCC01 from December 2014 and NCC02 from May 2015) are shown.
ray), CMU-CS (Carnegie Mellon University – cold stage) in Sect. 4.3), which are comparable to the dry dispersion results (i.e., data of freezing of individual droplets containing a sin-gle aerosol particle) for illite NX and cellulose (Beydoun et al., 2016).
Next, Fig. 2 depicts the ns,geo(T ) diversity in
log(ns,ind.)/log(ns,avg), which represents the ratio of
the log of individual measurements (ns,ind)to the log
aver-age of ns,geo(T ) expressed asns,avg at given temperatures.
In other words, this figure provides an overview of the ns,geo(T )deviations across the various techniques employed
in this work. Thesens ratios are shown for the temperature
range covered by at least two measurement techniques used in the present study. In this figure, different panels show three differentns,avg values as denominators, including the
average based on all bulk data (all, panels a.i–c.i, a.ii–c.ii and a.iii–c.iii), dry dispersion subgroup (dry, panels a.iv–c.iv), or aqueous suspension subgroup (sus, panels a.v–c.v). As for numerators (ns,ind), the interpolated T-binned data (1◦C)
[image:10.612.96.502.62.474.2]N. Hiranuma et al.: A comprehensive characterization of ice nucleation 4833
Figure 2.T-binned ratios of the interpolated individual measurements to the average of the data, log(ns,ind.)/log(ns,avg), based on the geometric surface area (ns,geo)for MCC(a), FC(b)and NCC(c).T-binned log(ns,ind.)/log(ns,avg)values are presented for(a.i–c.i)ratios of the log average to dry dispersion measurements (DD) or aqueous suspension measurements (AS) to the log average to all the data (All), (a.ii–c.ii)ratios of the individual DD measurements to all,(a.iii–c.iii)ratios of the individual AS measurements to all,(a.iv–c.iv)ratios of the individual particle dispersion measurements to DD and(a.v–c.v)ratios of the individual aqueous suspension measurements to AS. The black dotted line represents log(ns,ind.)/log(ns,avg)=1.(c.iv)is left blank since only one dataset is available at each temperature; thereby, no differences can arise.
of−33◦C< T <−15◦C is given in Fig. 2a.i–c.i. As shown in these panels, data deviation (i.e., scatter from the average log(ns,ind.)/log(ns,avg)=1 line) can be seen in both dry
dis-persion and aqueous suspension measurements. Other panels provide more evidence on the measurement diversity. In short, while the log(ns,ind.)/log(ns,avg) values range within
0.8–1.2 for dry dispersion (DD) and aqueous suspension (AS) cases (panels a.iv–c.iv and a.v–c.v), more prominent scatter of the log(ns,ind.)/log(ns,avg) values (0.6–1.4) is seen
when “all” is used as ns,avg values (panels a.i–c.i, a.ii–c.ii
and a.iii–c.iii). Thus, the observed deviation is the largest withns,avg of all (i.e., both AS and DD). Furthermore, the
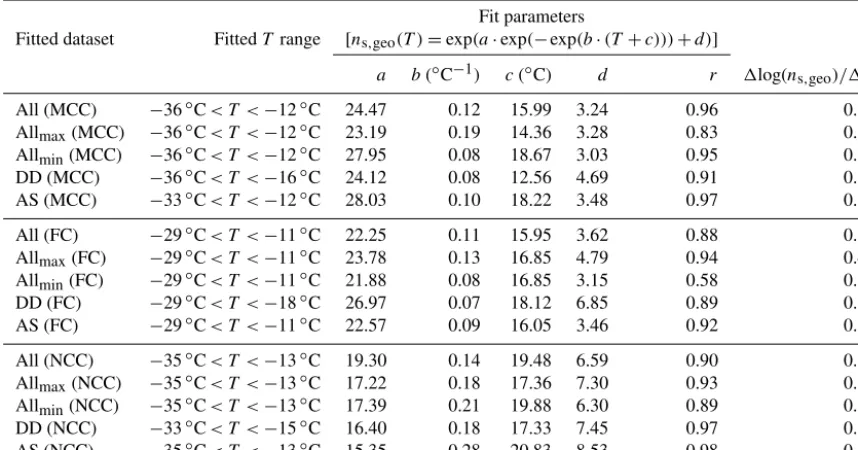
Table 3.List of the Gumbel cumulative distribution fit parameters to thens,geo(T )forT-binned ensemble datasets of MCC, FC and NCC (All). The datasets are fitted in the log space. In addition to all, fit parameters for ensemble maximum values (Allmax), ensemble minimum values (Allmin), suspension subset (AS) and the dry-dispersed particle subset (DD) are also included in this table. The correlation coefficient,
r, for each fit is also shown. Allns,geo(T )values are per square meter.T is in degrees Celsius.
Fit parameters
Fitted dataset FittedT range [ns,geo(T )=exp(a·exp(−exp(b·(T +c)))+d)]
a b(◦C−1) c(◦C) d r 1log(ns,geo)/1T
All (MCC) −36◦C< T <−12◦C 24.47 0.12 15.99 3.24 0.96 0.32
Allmax(MCC) −36◦C< T <−12◦C 23.19 0.19 14.36 3.28 0.83 0.33
Allmin(MCC) −36◦C< T <−12◦C 27.95 0.08 18.67 3.03 0.95 0.30
DD (MCC) −36◦C< T <−16◦C 24.12 0.08 12.56 4.69 0.91 0.20
AS (MCC) −33◦C< T <−12◦C 28.03 0.10 18.22 3.48 0.97 0.37
All (FC) −29◦C< T <−11◦C 22.25 0.11 15.95 3.62 0.88 0.33
Allmax(FC) −29◦C< T <−11◦C 23.78 0.13 16.85 4.79 0.94 0.40
Allmin(FC) −29◦C< T <−11◦C 21.88 0.08 16.85 3.15 0.58 0.26
DD (FC) −29◦C< T <−18◦C 26.97 0.07 18.12 6.85 0.89 0.28
AS (FC) −29◦C< T <−11◦C 22.57 0.09 16.05 3.46 0.92 0.29
All (NCC) −35◦C< T <−13◦C 19.30 0.14 19.48 6.59 0.90 0.31
Allmax(NCC) −35◦C< T <−13◦C 17.22 0.18 17.36 7.30 0.93 0.29
Allmin(NCC) −35◦C< T <−13◦C 17.39 0.21 19.88 6.30 0.89 0.32
DD (NCC) −33◦C< T <−15◦C 16.40 0.18 17.33 7.45 0.97 0.29
AS (NCC) −35◦C< T <−13◦C 15.35 0.28 20.83 8.53 0.98 0.30
4.2 Comparison of three cellulose sample types
The multiple exponential distribution fits (also known as the Gumbel cumulative distribution function) forT-binned data of all three cellulose samples are summarized in Table 3. Fit parameters as well as 1log(ns)/1T for each category are
given in this table. As can be inferred from the table, the over-all1log(ns)/1T value is almost identical for all three
sam-ple types (0.31–0.33) in spite of some deviations observed for the minimum and maximum (0.26–0.40). The observed consistency in the spectral slopes suggests cellulose mate-rial exhibits relatively similar ice nucleation above examined temperatures (>−36◦C).
For all cellulose types, a reasonable correlation coeffi-cient (r) is found for each technique (i.e., DD and AS), suggesting reasonable agreement and consistency for the re-sults from a similar group of immersion freezing techniques. However, we must reiterate the discrepancy between DD and AS. For instance, our observation of lower values of DD slopes (0.20–0.29) compared to those of AS slopes (0.29– 0.37) in the similar temperature range suggests distinct dif-ferences between the two subsets of methods. Moreover, the dry-dispersed MCC shows relatively lower1log(ns)/1T of
0.20 than FC and NCC (note not all instruments delivered FC and NCC measurements; see Table 2). This exception po-tentially indicates a fundamental difference of dry-dispersed MCC from other sample types.
Table 4 provides the log average of T-binnedns,geo(T )
values for all of the cellulose samples, representing detailed
comparisons of MCC, FC and NCC. Section S6 (Fig. S7) also summarizes the comparison between the averages for each material. As seen in the table and figure, there is a dis-crepancy between this study and previous work for MCC. At−28◦C, for example, our log averagens,geo(T )of MCC
(3.25×10⁹m−2, Table 4) is smaller than the previous MCC result at the same T (1.18×10¹⁰m−2, H15a). This differ-ence possibly reflects the fact that our averagens,geo(T )
in-cludes the results from a multitude of aqueous suspension measurements, which typically fall in the lower range of DD measurements (Sect. 4.1), while H15MCC (Eq. 9) is derived from a dry dispersion method only. Note that thens,geo(T )
maxima from Table 4 reasonably overlap with the H15MCC parameterization.
The highestns,geo(T )value of the FC experiments (3.6×
1010m−2at−29◦C from AIDA) is somewhat lower than that of MCC. Similarly, the highestns,geo(T )value of the NCC
experiments (1.5×10¹⁰m−2at−35◦C from WISDOM) is an order of magnitude lower than that of MCC as well as W15.
Table 4 also implies that MCC possesses higher ice nucle-ation efficiency relative to the other two types. First, at above
−25◦C, the immersion freezing ability of MCC typically
ex-ceeds that of NCC. Second, at−22 to−24◦C, where more than seven instruments are involved to calculate the average T-binnedns,geo(T ), the MCCns,geo(T )is consistently 1
N. Hiranuma et al.: A comprehensive characterization of ice nucleation 4835 T able 4. T -binned
ns,
geo v alues (per square meter) of three dif ferent cellulose samples based on the log av erage of all av ailable results at T (i.e., Fig. 1a–c.i v)). The first MCC column represents reference immersion freezing ns , geo (T ) v alues for MCC from H15a. The numbers in parentheses are maxima and minima of ns , geo at T . The numbers in brack ets represent the number of instruments used to calculate the log av erage ns , geo at T . The ns , geo (T ) v alues deri v ed from a single instrument are not included in this table. T ( ◦C) ns,
trend holds true when we compare MCC to NCC at T be-low −17◦C. The observed difference is up to 2 orders of
magnitude at −20◦C. Please note that, at the high T
re-gion (>−17◦C), dry dispersion techniques are not sensitive enough to detect INPs with their experimental parameters used in this study (Tables S1 and S3). In contrast, detect-ing rare INPs by increasdetect-ing the concentration of the aqueous particle suspension is advantageous yet also challenging. In other words, the measurement uncertainties generally prop-agate towards high temperatures because the confidence in-terval is relatively wider when there are only a few frozen droplets. Hence, our observation of less immersion freez-ing ability of MCC at this T range (up to a factor of∼20 at −16◦C) may not be conclusive. Particle sedimentation, aggregation and the concentrations effect identified by Bey-doun et al. (2016) are also more prominent at higher concen-tration, especially for cellulose samples.
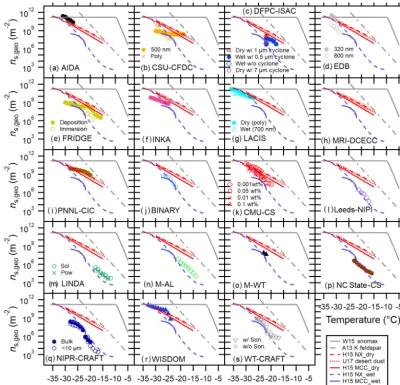
4.3 Individual immersion freezing measurements All individualns,geo(T )spectra of MCC, FC and NCC from
each technique are shown in Figs. 3, 4 and 5, respectively. Only brief remarks regarding each technique are summarized below. Several special experiments were carried out using seven techniques to complement our understanding of cel-lulose ice nucleation. The results from these unique experi-ments are first described (Sect. 4.3.1–4.3.7) followed by the other remarks (Sect. 4.3.8–4.3.19).
4.3.1 CSU-CFDC
Immersion freezing ability of both polydisperse and quasi-monodisperse dry-dispersed MCC particles was character-ized by CSU-CFDC (Colorado State University – Con-tinuous Flow Diffusion Chamber). In short, ice-nucleating efficiencies of differential mobility analyzer (DMA) size-selected MCC particles (500 nm mobility diameter) were compared to those of the polydisperse population for immer-sion freezing experiments.
As seen in Fig. 3b, the discrepancy between the re-sults from two populations is substantial. Similar to the LACIS result, a weak temperature dependence ofns,geo(T )
of monodisperse MCC particles is observed within defined experimental uncertainties (Table S1). Observed quasi-flat 1log(ns,geo)/1T of the monodisperse case suggests a weak
T dependence of immersion freezing ability of a given spe-cific size of MCC particles for the investigated temperature range. Conversely, a polydisperse spectrum, which repre-sents the result of an ensemble of different MCC particle sizes, shows a stronger trend of the slope towards a low T segment, suggesting a nonuniform distribution of active sites over the availableStotalof cellulose in this study. Some
previ-ous INUIT studies demonstrated the size independence of the ns,geo(T )value using submicron hematite and illite NX
par-ticles based on AIDA ice nucleation experiments (Hiranuma
et al., 2014, 2015b). Such a characteristic may not remain true for the immersion mode freezing of supermicron-sized fiber particles.
For all sample types, as seen in Figs. 3b, 4b and 5b, the CSU-CFDC results do not agree well with H15a (MCC_dry, Eq. 8). Instead, they virtually agree with the wet genera-tion results. This is especially true for the results with poly-disperse population. Note that formerly observed agreement within a factor of 3 inns,geo(T )estimation (cloud simulation
chamber INAS>CSU-CFDC INAS; DeMott et al., 2015) is seen only at−30◦C. The observed discrepancy may be due to nonuniform active site density for different sizes. An-other possible explanation may be due to the alternation of cellulose physicochemical properties perhaps upon humidi-fication during shipping, causing behavior more like aque-ous suspended particles. One thing that we need to keep in mind is that the CFDC uses a 2.4 µm particle impactor at its inlet (Table S3). Because of the impactor, there is loss of larger particles. Thus, thens,geo(T ) results may vary,
pos-sibly due to the difference in the size of cellulose samples examined. At−23◦C, where the data of size-selected mea-surements exist for all three cellulose samples, CSU-CFDC show ns,geo,MCC≈ns,geo,FC> ns,geo,NCC (Figs. 3b, 4b and
5b).
4.3.2 DFPC-ISAC
The DFPC-ISAC (Dynamic Filter Processing Chamber – Institute of Atmospheric Sciences and Climate) instrument (Santachiara et al., 2010) provided data for condensation and immersion freezing. The use of 103 % RHwin this
investiga-tion was optimized to count statistically significant amounts of INPs in this system for examined cellulose particles (i.e., MCC and FC). With this system, we assessed the IN effi-ciencies of different sizes of MCC and FC particles gener-ated by means of different cyclone cut sizes (0.5, 1.0, 7.0 µm or none). Further, both dry-dispersed (dry) and nebulizer-generated particles (wet) were systematically assessed for their INP activities. Without an exception, INP concentra-tions were measured at−22◦C for all specimens. For the case of particles (<0.5 µm cyclone-selected), we addition-ally measured INP concentrations at−18◦C to assess the general trend of the INP activated as a function ofT. This particular case was selected for the extended study due to the similarity of their geometric SSAs to those of the AIDA cloud parcel simulation measurements. In addition, while collecting the cellulose particles on nitrate membrane filters (Millipore, 0.47 µm pore size) used for IN assessment, par-allel measurements of particle size distributions using an op-tical particle counter (Grimm, 1.108) were carried out. The results of size distributions, represented by the SSA values, are summarized in Table 5.
N. Hiranuma et al.: A comprehensive characterization of ice nucleation 4837
Figure 3.Intercomparison of 20 INP measurement methods for MCC usingT-binnedns,geo. FRIDGE results of default (solid circles) and imm.mode (open circles) measurements are both presented in(e). Reference immersion freezingns(T )spectra for MCC (H15a) illite NX (H15b), Snomax (Wex et al., 2015), desert dusts (U17; Ullrich et al., 2017) and K feldspar (A13; Atkinson et al., 2013) are also shown (see Sect. 3.2). Both aqueous suspension and dry dispersion results of FRIDGE are presented in panele.
This observation is valid as the cyclone is used to remove particles larger than the designated cut size. Regardless of whether using the cyclone or not, particle sizes out of the nebulizer generation are somehow comparable to those of dry dispersion with a cyclone of 1 µm cut size. The observed difference between wet and dry is indicative of the changes in particle size and morphology while drying atomized par-ticles from a suspension of the powder in water as described in Sect. S2.
Figures 3c and 4c show all the results of INP measuments by DFPC-ISAC. For MCC, the interpolated DFPC re-sults of the immersed particles (<0.5 µm cyclone-selected) fall in the middle of FRIDGE (FRankfurt Ice Nuclei De-position FreezinG Experiment) results that two different modes for −22◦C< T <−18◦C. More interestingly, the slope of the DFPCns,geo(T )spectrum (1log(ns,geo)/1T =
0.24) represents the median of the slopes of FRIDGE mea-surements (i.e., 0.17 for default mode and 0.31 for immer-sion mode). This observation is consistent with other results of (1) size-selected particles tend to exhibit a gentle slope (similar to the observations from CFDC and LACIS) and (2) nebulizer-generated techniques tend to result in a dete-riorated INP activity (H15b).
Another important implication of the DFPC results is that submicron dry particles show the highest INP efficiencies, which practically lie onns,geo(T ) data points of H15a
pa-rameterization at a givenT for both MCC and FC. Moreover, inclusion of supermicron sizes (no cyclone or 7 µm) seems to reduce IN efficiencies of both MCC and FC. Further investi-gation is required to interpret these results.
Figure 4.Intercomparison of 12 INP measurement methods for FC usingT-binnedns,geo. Reference immersion freezingns(T )spectra are provided as in Fig. 3.
Figure 5.Intercomparison of 11 INP measurement methods for NCC usingT-binnedns,geo. Reference immersion freezingns(T )spectra are provided as in Fig. 3. Note that unless otherwise specified, the data are for NCC02.
show ns,geo,FC≈ns,geo,MCC (Figs. 3c and 4c). Note that
ns,geo,FCappears to be slightly higher thanns,geo,MCC. This
observation is not consistent with the general trend of ns,geo,MCC> ns,geo,FC(Sect. 4.2). However, the observed
dif-ference is only a factor of<2 on average.
4.3.3 FRIDGE
The FRIDGE (FRankfurt Ice Nuclei Deposition FreezinG Experiment) data were derived from both default mode (a combination of deposition, condensation ice nucleation and immersion freezing at RHwof 101 %) and immersion mode
[image:16.612.99.498.323.576.2]N. Hiranuma et al.: A comprehensive characterization of ice nucleation 4839
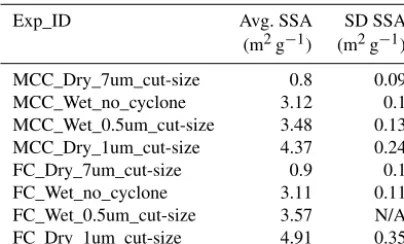
Table 5.Summary of the geometric SSA of MCC and FC particles assessed by DFPC-ISAC. In general, high SSA values indicate the presence of small grains because the relative dominance of the mass to the surface becomes small.
Exp_ID Avg. SSA SD SSA
(m2g−1) (m2g−1)
MCC_Dry_7um_cut-size 0.8 0.09
MCC_Wet_no_cyclone 3.12 0.1
MCC_Wet_0.5um_cut-size 3.48 0.13
MCC_Dry_1um_cut-size 4.37 0.24
FC_Dry_7um_cut-size 0.9 0.1
FC_Wet_no_cyclone 3.11 0.11
FC_Wet_0.5um_cut-size 3.57 N/A
FC_Dry_1um_cut-size 4.91 0.35
modes, FRIDGE investigated the ice nucleation ability of both dry and droplet-suspended particles deposited on a sub-strate. In particular, the default mode operation of FRIDGE provided data from −16 to −30◦C (MCC) by scanning RHiceand RHw(low to high) at a constant temperature.
Ac-cordingly, ice crystals formed at the highest RHwof 101 %
were considered to be a measure of immersion Nice from
dry-dispersed particle measurements. Likewise, the immer-sion mode operation of FRIDGE provided data from−19 to
−28◦C (MCC) and from−13 to−23◦C (NCC). As demon-strated in H15b, this immersion mode counts immersion freezing of suspended particles in which the particles are first washed into droplets and then placed on the substrate to be comparable to the dry dispersion method. Hence, this method is advantageous to collect a filter sample of cellulose, pre-pared the same way as in the dry dispersion experiment and then run it on a cold stage.
Figure 3e shows the comparison of ns,geo(T ) derived
from the two different operation modes of FRIDGE. There are a few important implications from the FRIDGE results. First, on average, the measurements with dry particles in the “default” setting showed more than an order of magni-tude higherns,geo(T )in comparison to the immersed
parti-cles in FRIDGE experiments at T >−22◦C. As shown in Fig. 3e, the deposition mode data suggest thatns,geo(T )
val-ues for −22◦C< T <−19◦C are close (within a factor of 2) to those from MRI-DCECC, in which experiments were carried out with a high degree of particle agglomeration. In comparison to the default mode result, FRIDGE experiments in the pure immersion mode showed much lowerns,geo(T )
than that with the default setting but agreed with other im-mersion datasets. Second, a steeper1log(ns,geo)/1Tof 0.31
was found for the measurements with immersed particles at T >−24◦C when compared to the slope of the deposition mode data (i.e., 0.17). As a temperature shift (i.e., shifting the data a few degrees Celsius) does not offset the discrep-ancy, other mechanistic interpretations might be plausible causes of this discrepancy. For instance, this difference may
be a consequence of the different IN efficiencies of nucle-ation modes of both experimental approaches (e.g., depo-sition+condensation+immersion vs. immersion alone) in the examined temperature range, the different sample prepa-ration processes, effects of agglomeprepa-ration or a combination of the three. The divergence of default mode and cold-stage (CS) mode becomes notable atT >−24◦C, perhaps sug-gesting the effect of agglomeration. Specifically, agglomera-tion may take place inside the pipetted droplets. While pipet-ting agglomeration and separation are avoided by shaking the sample, but during cooling it lasts 15–30 min until a droplet freezes.
Figure 5c presents the summary of FRIDGE-CS measure-ments for NCC. Thens,geo(T )spectrum nearly overlaps with
the H15b (illite NX wet) reference spectrum. It also agrees well with the other droplet freezing instruments CMU-CS, NIPR-CRAFT (National Institute of Polar Research – Cryo-genic Refrigerator Applied to Freezing Test), NCS-CS, BI-NARY (Bielefeld Ice Nucleation ARraY) and WISDOM. Similarns,geo(T )values were obtained, although the
meth-ods analyzed droplets of different volumes. In particular FRIDGE and WISDOMns,geo(T )agree with each other by
better than 0.3◦C. By comparing NCC to MCC at−23◦C< T <−19◦C, the FRIDGE-CS results show ns,geo,MCC>
ns,geo,NCC for>1 order of magnitude throughout this
over-lapping T range. Note that the 1log(ns,geo)/1T value of
NCC (0.40) is somewhat higher than the average slope pa-rameters listed in Table 3.
4.3.4 LACIS
With LACIS (Leipzig Aerosol Cloud Interaction Simulator), we examined immersion mode freezing of both atomized and dry-dispersed MCC particles separately. For atomized parti-cle generation, partiparti-cles were dried in a diffusion dryer di-rectly after spraying the suspension. Succinctly, LACIS mea-sured immersion ice nucleation ability of atomizer-generated MCC particles for 700 nm mobility diameters in the temper-ature range of−35◦C< T <−30◦C. The selection of this relatively large size was necessary to obtain a signal above the limit of detection in the system. The experiments with dry-dispersed MCC were performed with polydisperse MCC particles for−36◦C< T <−27◦C. Note that a cyclone was used in the air stream of LACIS (Table S3).
Generally, LACIS measurements with dry dispersed MCC particles are in agreement with those from H15a as ap-parent in Fig. 3g (ns,geo (−30◦C)∼1.5×10¹⁰m−2).
Fur-thermore, LACIS measurements down to−36◦C with dry
polydisperse MCC particles show that1log(ns,geo)/1T (=
0.17, Table S1) is identical to MRI-DCECC for−28◦C< T <−16◦C. Contrastively, the slope of the spectrum for 700 nm size-segregated MCC particles (=0.05) is consider-ably lower than that of the polydisperse case. This slope of the LACISns,geo(T )spectrum is parallel to that of the
for −30◦C< T <−24◦C; Fig. 3b). Thus, though we can-not certainly define the relative importance of the aerosol generation method (e.g., the changes in physicochemical properties of particles occurred during atomization as pre-scribed in Sect. S2), the aerosol size might have a non-negligible impact on the variation in spectral slopes. There-fore, the immersion freezing efficiency of MCC particles is likely different for differently sized MCC particles, meaning that a single ns,geo(T ) curve cannot be reported for MCC.
With this, the method of accounting for differences in sur-face area between different groups and methods becomes questionable for a complex system like cellulose. Further-more, its complex morphology (see Sect. S5) causes the determination of the surface area to be quite prone to er-rors which can be a reason for the observed differences in ns,geo(T ). Thensframework must be rigorously tested with
more empirical data. Nevertheless, for LACIS, both polydis-perse and quasi-monodispolydis-perse MCC particles exhibit sim-ilar ns,geo(T ) values above −30◦C (e.g., ns,geo (−30◦C) ∼1.5×10¹⁰m−2in Fig. 3g), suggesting a negligible size de-pendency ofns,geo(T )for MCC particles in this temperature
range.
4.3.5 LINDA
LINDA (LED-based Ice Nucleation Detection Apparatus), a vial-based immersion freezing assay, was utilized to com-pare the freezing activity of bulk suspension (0.1 wt % cellu-lose in NaCl solvent) to that of dry powders individually sus-pended in each vial (sus vs. pow henceforth). Such a com-parison was carried out to ensure that employing different methods of vial preparation did not impede ice nucleation of cellulose samples, including MCC and FC. For the latter pro-cedure (pow), pre-weighed cellulose powders (0.2 mg) were directly poured into 200 mg (199.8 µL) of 0.1 % NaCl solu-tion to realize the concentrasolu-tion of cellulose in each vial to be equivalent to 0.1 wt %, such that two procedures became comparable. We note that all vials, regardless of the proce-dure, were sonicated (46 kHz) for 5 min prior to each LINDA measurement. Note that we used non-sterile NCC (NCC01) for the IN characterization with LINDA.
The results of MCC and FC are shown in Figs. 3m and 4g. The results suggest similarity ofns,geo(T )within the
ex-perimental uncertainties of LINDA (Stopelli et al., 2014) for the range of examined temperatures (−7 to−18◦C). Further, the slope of LINDAns,geo(T )spectra(1log(ns,geo)/1T )of
0.29 is identical for both scenario cases (i.e., sus and pow). Hence, for a given mass concentration of 0.1 wt %, both vial preparation procedures seem valid. Nonetheless, suspended cellulose powders settle rapidly in both cases, implying the necessity of taking great care when measuring INP activity of supermicron-sized particles with the∼200 µL vial-based assay.
For −18◦C< T <−12◦C, the LINDA results (bulk suspension) show ns,geo,MCC> ns,geo,FC with similar
1log(ns,geo)/1T (0.29–0.30), verifying comparable
per-formance of this vial-based technique to other suspension methods (Figs. 3m and 4g).
Figure 5f shows the freezing spectrum of NCC01 with the slope parameter(1log(ns,geo)/1T )of 0.21. The observation
of higher activity of NCC01 compared to MCC and FC im-plies possible inclusion of INA materials in the original 3 % solution of NCC01. The source is not known, and the source identification is beyond the scope of this work. The sample stability of another NCC sample from another batch, NCC02, is discussed in Sect. 4.3.6.
4.3.6 NIPR-CRAFT
NIPR-CRAFT (National Institute of Polar Research – Cryo-genic Refrigerator Applied to Freezing Test), a suite of cold stage instruments, offered the immersion freezing measure-ments of all three cellulose samples using droplets with vol-umes of 5 µL. This microliter range volume was the largest amongst all aqueous suspension techniques employed within this work. Such a large drop volume advantageously enables high-resolution immersion freezing analysis for a wide range of temperatures (−31◦C< T <−17◦C). The highest freez-ing temperatures are attained with the largest droplets, which contain the largest surface area of cellulose.
By means of Stokes law gravity differential settling (Tobo, 2016),<10 µm MCC and FC particles of were extracted to generate droplets containing size-segregated cellulose sam-ples. These droplets were subsequently assessed on NIPR-CRAFT, estimating an immersion freezing ability of MCC and FC with a SSA of 3.35 m2g−1 (the AIDA-derived
ge-ometric SSA value, accounting for only<10 µm particles). Afterwards, the obtained results of<10 µm were compared to those of bulk (SEM-based SSA of 0.068–0.087 m2g−1). Furthermore, we facilitated NIPR-CRAFT for the quality check of the NCC sample over time. Expressly, we stored NCC02 at 4◦C for 9 months and made follow-up measure-ments to examine the potential decay of the samples, poten-tially altering its immersion freezing.
Figures 3q and 4k show the NIPR-CRAFT results for MCC and FC. In general, the NIPR-CRAFT data represent the lower boundary of compiled ns,geo(T ) spectra defined
by the bulk of the instruments (Fig. 2a.iii and 2b.iii). Con-stant offset between NIPR-CRAFT and the log average of AS methods inns,geo(T ) is seen at−28◦C< T <−21◦C
N. Hiranuma et al.: A comprehensive characterization of ice nucleation 4841
size-segregated MCC and FC are 0.43 and 0.34, respectively, and are in agreement with bulk NIPR-CRAFT.
Figure 5i shows time trials of NCC02 and similarity in IN activity over 9 months. As inferred from the overlapped spectra, the influence of the decay over time is negligible. Over time, the spectral slopes andns,geo(T )remain similar,
indicating high stability of NCC02.
For investigated temperatures listed in Table 2, the bulk NIPR-CRAFT results show ns,geo,MCC> ns,geo,FC(Figs. 3q
and 4k). Corresponding1log(ns,geo)/1T values are similar
(0.41 for MCC and 0.39 for FC) but notably higher than any averaged slope parameters listed in Table 3. With an even higher slope value of 0.50, thens,geo,NCCvalues exceed both
ns,geo,MCCandns,geo,FCatT below−20◦C (Fig. 5i).
4.3.7 WT-CRAFT
The WT-CRAFT (West Texas A&M University – Cryo-genic Refrigerator Applied to Freezing Test) system, which is a replica of NIPR-CRAFT (Tobo, 2016), measured the freezing abilities of droplets containing 0.05–0.0005 wt % MCC and FC atT >−26◦C. WT-CRAFT also examined if the pre-treatment of aqueous suspension (i.e., sonication of 50 mL falcon tube for 15 min) has any influence on IN effi-ciency of MCC and FC. More specifically, we compared the IN efficiency of 49 drops made out of the sonicated suspen-sion containing a given percentage by weight of MCC and FC to those of non-sonicated suspension left idle for at least 60 min.
The results are shown in Figs. 3s and 4l. As seen in these figures, early freezer only appears in the case of pre-application of sonication. This trend is especially notable for the MCC case. As a result, the difference of the spectral slope for MCC deviates from 0.36 (sonicated case) to 0.52 non-sonicated case). Importantly, our results suggest that MCC may suffer more from the particle settling in the suspension when compared to FC for examined ranges of temperature and percentage by weight. Nevertheless, the difference in ns,geo(T )is within a factor of 4 at the most, which is well
within our experimental uncertainty (see Table S2).
Below−22◦C, WT-CRAFT showsns,geo,MCC> ns,geo,FC
(Figs. 3s and 4l). The MCC result exhibits a sharper in-crease inns,geo(T )within the limited temperature range with
a 1log(ns,geo)/1T of 0.36 than FC (1log(ns,geo)/1T =
0.30). 4.3.8 AIDA
The AIDA (Aerosol Interaction and Dynamics in the Atmo-sphere) cloud simulation chamber facility at KIT represents the world’s foremost facility for studying ice clouds in a con-trolled setting. As shown in Fig. 2, for all cellulose types, the AIDA data hover in the upper bound of the comprehen-sive ns,geo(T ) spectrum defined by the bulk of the
instru-ments. The corresponding log(ns,ind.)/log(ns,avg) is within
1.2. The spectral slope for immersion freezing of cellulose from AIDA varies depending on the sample type. For MCC, 1log(ns,geo)/1T is 0.24 and equivalent to that of H15a
(MCC, dry, Eq. 8). The larger slope value is found for FC (0.47), which is practically parallel to A13 (0.45), and devi-ates from other DD instruments (1log(ns,geo)/1T of 0.28).
But thens,geo(T )data of FC from AIDA are in fair agreement
with the logns,geo(T )average for examinedT. Finally, the
NCC02 results agree well with CSU-CFDC and WISDOM. Observed quasi-flat1log(ns,geo)/1T of NCC02 (0.04)
sug-gests a weakT dependence of immersion freezing ability for the investigated temperature range. In addition, similar to the observation made by LINDA, higher activity of NCC01 com-pared to NCC02 is seen in Fig. 5a. This difference suggests the inclusion of INA materials in the original 3 % solution of NCC01 (the source is not known). For investigated tempera-tures listed in Table 2, AIDA showsns,geo,MCC> ns,geo,FC
andns,geo,MCC> ns,geo,NCC (Figs. 3a, 4a and 5a; see also
Sect. S7). 4.3.9 EDB
EDB (electrodynamic balance) contact freezing experiments have been performed with MCC particles preselected in the DMA at two electrical mobility diameters: 320 and 800 nm. Due to the low concentration (typically less than 30 cm−3) of the MCC particles produced by the dry dispersion method (a turbulent flow disperser, Table S3), and relatively low IN efficacy of MCC particles, the measurements ofecwere
possible only in a limited temperature range between−29 and−32◦C. A strong asphericity of the MCC particles con-tributes to the uncertainty ofns,geo(T )determination, which
differs by 2 orders of magnitude for particles with mobility diameters of 320 and 800 nm. An additional uncertainty fac-tor is the unknown portion of the MCC particle submersed in water upon contact with the supercooled droplet (kimm;
see Eq. 2). We setkimm=1, thus giving a lower estimate of
the possiblens,geo(T )value. On the whole, the contact INAS
density falls nicely within the range ofns,geo(T )values
mea-sured by other instruments but does not exceed H15MCC parametrization for dry NCC particles. This is not very sur-prising given the experimental uncertainties of the EDB-based method.
4.3.10 INKA
The aerosol freezing ability was measured from−32.5 to
−25◦C for increasing relative humidity from well below
liq-uid water saturation to about 110 % RH in a total of eight scans. Data reported in this paper were interpolated at a rel-ative humidity of 107 %, taking into account that the nom-inal relative humidity for CFDCs has to be above 100 % in order to enable full aerosol activation (DeMott et al., 2015; Garimella et al., 2017). INKA measured ice nucleation sur-face site densities, which are close to the average of all mea-sured data (see Fig. 2). The results match the data meamea-sured by the CSU-CDFDC for polydisperse aerosol, with slightly less pronounced temperature dependence.
4.3.11 MRI
The MRI (Meteorological Research Institute) cloud simula-tion chamber experiments were conducted to demonstrate that MCC particles can act as efficient immersion freez-ing nuclei in simulated supercooled clouds. The evacuation rate corresponded to the updraft velocity of 5 m s−1. Dry MCC powders were dispersed by a rotating brush gener-ator (PALAS, RBG1000) and injected into the ventilated 1.4 m3chamber vessel. Using the data from six experiments, we calculated the ice-nucleation-active surface-site densities of aerosolized cellulose in the temperature range from−15 to−30◦C. The regression line for the experimental data is ns,geo(T )=exp(−0.56T +7.50) with a correlation
coeffi-cient of 0.84. As shown in Figs. 2 and 3h, for the dry MCC type, the MRI cloud simulation chamber data exist in the up-per bound of the comprehensivens,geo(T )spectrum.
4.3.12 PNNL-CIC
At PNNL-CIC (Pacific Northwest National Laboratory – Compact Ice Chamber) immersion freezing properties of size-selected MCC samples at a temperature ranging from
−20 to −28◦C were investigated. The chamber was oper-ated at RHw=106±3 %, and the evaporation section of
the chamber was maintained at aerosol lamina temperature. The uncertainty (±0.5◦C) in the aerosol lamina tempera-ture was calculated based on aerosol lamina profile calcu-lations.ns,geo(T )calculations were performed using
immer-sion freezing frozen fraction and surface area of MCC parti-cles. Thens,geo(T )values varied from 1×10⁸to 1×10⁹m−2.
1log(ns,geo)/1T (=0.13, Fig. 3i) agreed well with that of
the U17 dust parameterization in the same temperature range. 4.3.13 BINARY
The three different cellulose types were investigated with the BINARY (Bielefeld Ice Nucleation ARraY) setup (Budke and Koop, 2015), and their sample preparation is described in Table S4. We note that the original MCC and FC data are those published in H15a, i.e., before the recommended sus-pension preparation procedure was developed. As described in H15a these bulk suspensions suffered from sedimentation
and hence are not predestined for ans,geo(T )
intercompari-son. The original raw data from H15a were re-analyzed here in order to have the same 1◦C binning and averaging as other
techniques. Moreover, a different background correction was applied, also to the NCC samples: the first 5 % and last 5 % of nucleation data points in a given frozen fraction curve (i.e., the data smaller than 0.05 and greater than 0.95 in FF) were excluded in order to account for a concentration variation be-tween individual droplets due to sedimentation and for nucle-ation events triggered by the glass substrate or impurities in the “pure” water background.
For −25◦C< T <−22◦C, the bulk BINARY data for the different cellulose samples are in a similar active site range, i.e., the results show ns,geo,MCC> ns,geo,FC≈
ns,geo,NCC (Figs. 3j, 4d and 5d). At−25◦C the MCC and
FC data show a rapid change in slope and at a lower tem-perature they level off at ans,geo(T )value of about 108m−2,
which may be due to the sedimentation of cellulose parti-cles with lower ice nucleation activity as discussed above. In contrast, no such change in slope is observed for NCC (which did not suffer from apparent sedimentation), thus con-sistent with higherns,geo,NCCvalues observed below−25◦C
in small-droplet experiments and with dry suspension tech-niques. Moreover, above−25◦C the NCC data agree well with other large-volume droplet experiments such as NIPR-CRAFT and NC-State CS as well as with small-droplet tech-niques such as WISDOM. In summary, these observations imply that techniques using large droplets may suffer from sedimentation if the suspended material consists of particles with a wide size distribution. However, if smaller and homo-geneous particles are suspended they give results similar to small-droplet techniques.
4.3.14 CMU-CS
The immersion freezing ability of a wide range of aqueous suspension concentrations and immersion freezing temper-atures was measured by CMU-CS (Carnegie Mellon Uni-versity – cold stage; Polen et al., 2016, 2018; Beydoun et al., 2017). This cold stage device facilitates the sampling of drops within a squalene oil matrix that allows for experi-ments using varied percentage by weight of the cellulose test samples (0.001 to 0.15 wt %) for this study. Drops contain-ing MCC, FC and NCC02 were studied at a coolcontain-ing rate of 1◦C min−1to determine the immersion freezing temperature spectrum.
A total of 10 immersion mode freezing experiments with a droplet volume of 0.1 µL were performed. Using this in-strument, a wide range of temperatures were investigated (T >−30◦C) yieldingns,geo(T )values ranging from 105to
1010m−2. The data from the 10 individual runs collapsed into a single ns,geo(T ) spectrum, suggesting that the mass