White Rose Research Online URL for this paper:
http://eprints.whiterose.ac.uk/108497/
Version: Accepted Version
Article:
Parsons, S. G., Marsh, T. R., Gaensicke, B. T. et al. (4 more authors) (2013) A magnetic
white dwarf in a detached eclipsing binary. Monthly Notices of the Royal Astronomical
Society, 436 (1). pp. 241-252. ISSN 0035-8711
https://doi.org/10.1093/mnras/stt1588
[email protected]
https://eprints.whiterose.ac.uk/
Reuse
Unless indicated otherwise, fulltext items are protected by copyright with all rights reserved. The copyright
exception in section 29 of the Copyright, Designs and Patents Act 1988 allows the making of a single copy
solely for the purpose of non-commercial research or private study within the limits of fair dealing. The
publisher or other rights-holder may allow further reproduction and re-use of this version - refer to the White
Rose Research Online record for this item. Where records identify the publisher as the copyright holder,
users can verify any specific terms of use on the publisher’s website.
Takedown
If you consider content in White Rose Research Online to be in breach of UK law, please notify us by
arXiv:1308.4423v1 [astro-ph.SR] 20 Aug 2013
Mon. Not. R. Astron. Soc. 000, 1–13 (2013) Printed 22 August 2013 (MN LATEX style file v2.2)
A magnetic white dwarf in a detached eclipsing binary
S. G. Parsons
1⋆, T. R. Marsh
2, B. T. G¨ansicke
2, M. R. Schreiber
1, M. C. P. Bours
2,
V. S. Dhillon
3, and S. P. Littlefair
31Departmento de F´ısica y Astronom´ıa, Universidad de Valpara´ıso, Avenida Gran Bretana 1111, Valpara´ıso, Chile 2Department of Physics, University of Warwick, Coventry CV4 7AL, UK
3Department of Physics and Astronomy, University of Sheffield, Sheffield, S3 7RH, UK
Accepted 2013 August 16. Received 2013 August 16; in original form 2013 July 15
ABSTRACT
SDSS J030308.35+005444.1 is a close, detached, eclipsing white dwarf plus M dwarf binary which shows a large infrared excess which has been interpreted in terms of a circumbi-nary dust disk. In this paper we present optical and near-infrared photometric and spectro-scopic data for this system. At optical wavelengths we observe heated pole caps from the white dwarf caused by accretion of wind material from the main-sequence star on to the white dwarf. At near-infrared wavelengths we see the eclipse of two poles on the surface of the white dwarf by the main-sequence star, indicating that the white dwarf is magnetic. Our spectroscopic observations reveal Zeeman split emission lines in the hydrogen Balmer series, which we use to measure the magnetic field strength as 8 MG. This measurement indicates that the cyclotron lines are located in the infrared, naturally explaining the infrared excess without the need for a circumbinary dust disk. We also detect magnetically-confined material located roughly midway between the two stars. Using measurements of the radial velocity amplitude and rotational broadening of the M star we constrain the physical parameters of the system, a first for a magnetic white dwarf, and the location of the poles on the surface of the white dwarf. SDSS J030308.35+005444.1 is a pre-cataclysmic variable that will likely evolve into an intermediate polar in∼1 Gyr.
Key words: binaries: eclipsing – stars: magnetic fields – stars: late-type – white dwarfs
1 INTRODUCTION
Cataclysmic variables (CVs) are semi-detached binaries contain-ing a white dwarf accretcontain-ing material from a main-sequence com-panion star via Roche-lobe overflow. Around 20% of CVs con-tain white dwarfs with magnetic fields strong enough to effect the flow of material on to it (Wickramasinghe & Ferrario 2000; Araujo-Betancor et al. 2005; Pretorius et al. 2013). These magnetic CVs are divided into two types: polars, in which the white dwarf is synchronously rotating with the binary orbit, and intermediate po-lars (IPs), in which the white dwarfs usually rotate faster than the binary orbit.
Magnetic CVs are thought to have a similar evolutionary history to non-magnetic CVs. Both initially started out as main-sequence binaries that underwent a common envelope phase, where the two stars orbited within a single envelope of material, los-ing angular momentum and spirallos-ing closer together. The re-sulting system consists of a close, detached white dwarf plus main-sequence binary, known as a post common envelope binary (PCEB). These systems have orbital periods of a few hours to a
few days and gradually lose angular momentum via gravitational radiation (Kraft et al. 1962; Faulkner 1971) and magnetic braking (Verbunt & Zwaan 1981; Rappaport et al. 1983) eventually bring-ing them close enough together to initiate mass transfer on to the white dwarf.
However, whilst the number of identified PCEBs has increased rapidly in the last few years, there is a complete lack of systems containing obviously magnetic white dwarfs (Liebert et al. 2005; Silvestri et al. 2006, 2007; Rebassa-Mansergas et al. 2010, 2012). Given that at least 10% of isolated white dwarfs also show evidence of magnetic fields with strengths in excess of 2 MG (Liebert et al. 2003), this is a large discrepancy.
Magnetic white dwarfs are thought to be generally more mas-sive (hence smaller and fainter) than non-magnetic white dwarfs (K¨ulebi et al. 2010; Dobbie et al. 2012, 2013; K¨ulebi et al. 2013), which could account for some of this discrepancy, but cannot ex-plain the complete absence of strongly Zeeman-split hydrogen lines in the more than 2000 spectroscopically identified white dwarf plus main-sequence binaries (Rebassa-Mansergas et al. 2012).
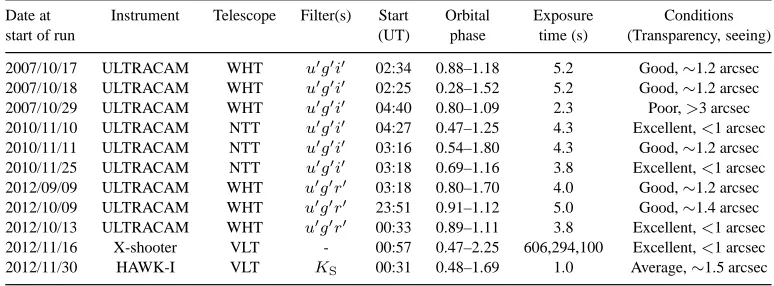
Table 1. Journal of observations. Exposure times for X-shooter observations are for UVB arm, VIS arm and NIR arm respectively. The primary eclipse occurs
at phase 1, 2 etc.
Date at Instrument Telescope Filter(s) Start Orbital Exposure Conditions start of run (UT) phase time (s) (Transparency, seeing)
2007/10/17 ULTRACAM WHT u′g′i′ 02:34 0.88–1.18 5.2 Good,∼1.2 arcsec
2007/10/18 ULTRACAM WHT u′g′i′ 02:25 0.28–1.52 5.2 Good,∼1.2 arcsec
2007/10/29 ULTRACAM WHT u′g′i′ 04:40 0.80–1.09 2.3 Poor,>3 arcsec
2010/11/10 ULTRACAM NTT u′g′i′ 04:27 0.47–1.25 4.3 Excellent,<1 arcsec
2010/11/11 ULTRACAM NTT u′g′i′ 03:16 0.54–1.80 4.3 Good,∼1.2 arcsec
2010/11/25 ULTRACAM NTT u′
g′
i′ 03:18 0.69–1.16 3.8 Excellent,
<1 arcsec 2012/09/09 ULTRACAM WHT u′
g′
r′ 03:18 0.80–1.70 4.0 Good,∼1.2 arcsec
2012/10/09 ULTRACAM WHT u′g′r′ 23:51 0.91–1.12 5.0 Good,∼1.4 arcsec
2012/10/13 ULTRACAM WHT u′g′r′ 00:33 0.89–1.11 3.8 Excellent,<1 arcsec
2012/11/16 X-shooter VLT - 00:57 0.47–2.25 606,294,100 Excellent,<1 arcsec 2012/11/30 HAWK-I VLT KS 00:31 0.48–1.69 1.0 Average,∼1.5 arcsec
are descendents of somewhat more massive main-sequence bina-ries and so could harbour magnetic white dwarfs, invisible at op-tical wavelengths due to their bright main-sequence companions. An alternative hypothesis involves the generation of magnetic field during the common envelope phase itself via a magnetic dynamo (Tout et al. 2008; Potter & Tout 2010). In this scenario, systems with strongly magnetic white dwarfs emerge from the common en-velope at small separations and hence evolve into CVs on short timescales.
There are a small number of magnetic white dwarfs ac-creting from the wind of their main-sequence companion stars (Reimers et al. 1999; Reimers & Hagen 2000; Schmidt et al. 2005, 2007; Vogel et al. 2007, 2011; Schwope et al. 2009). These systems are characterised by cool white dwarfs with field strengths of a few 10 MG (i.e. cyclotron lines in the optical) and main-sequence stars that underfill their Roche-lobes, hence these systems are in fact pre-polars, yet to become CVs. The accretion rates in these systems are of the order of10−13
–10−14
M⊙/yr, several orders of
magni-tude smaller than in normal polars, but much higher than in equiv-alent detached non-magnetic PCEBs (Debes 2006; Tappert et al. 2011; Pyrzas et al. 2012; Parsons et al. 2012a; Ribeiro et al. 2013) which have accretion rates of the order of 10−17
–10−15 M⊙/yr.
The exception to this is the non-magnetic system QS Vir which has a mass transfer rate of 10−13
M⊙/yr (Matranga et al. 2012),
although this system may be a hibernating CV (O’Donoghue et al. 2003; Matranga et al. 2012).
SDSS J030308.35+005444.1 (henceforth SDSS J0303+0054) was identified as an eclipsing PCEB containing a cool (∼8000 K) featureless DC white dwarf with a low-mass M dwarf companion in a 3.2 hour orbit by Pyrzas et al. (2009). Parsons et al. (2010b) pre-sented high-speed photometry of the system and noted an unusual modulation in theu′
andg′
bands that could not be attributed to the ellipsoidal distortion of the M star, they proposed that starspots on the M star could be responsible. Recently, Debes et al. (2012) discovered a large infrared excess in the system which they argue is caused by a circumbinary dust disk.
In this paper we present new optical and near-infrared photo-metric and spectroscopic data for SDSS J0303+0054 which shows that the white dwarf is in fact magnetic, eliminating the need for a highly spotted M star or circumbinary disk. We also constrain the physical parameters and evolution of the binary.
2 OBSERVATIONS AND THEIR REDUCTION
2.1 ULTRACAM photometry
SDSS J0303+0054 was observed with ULTRACAM mounted as a visitor instrument on the4.2m William Herschel Telescope (WHT) on La Palma in 2007 and 2012 and at the3.5m New Technology Telescope (NTT) on La Silla in 2010. ULTRACAM is a high-speed, triple-beam CCD camera (Dhillon et al. 2007) which can acquire simultaneous images in three different bands; for our observations we used the SDSSu′
,g′
and eitherr′
ori′
filters. A complete log of these observations is given in Table 1. We windowed the CCD in order to achieve exposure times of∼3–4 seconds which we varied to account for the conditions; the dead time between exposures was
∼25ms.
All of these data were reduced using the ULTRACAM pipeline software. Debiassing, flatfielding and sky background sub-traction were performed in the standard way. The source flux was determined with aperture photometry using a variable aperture, whereby the radius of the aperture is scaled according to the full width at half maximum (FWHM). Variations in observing condi-tions were accounted for by determining the flux relative to a com-parison star in the field of view. We flux calibrated our targets by de-termining atmospheric extinction coefficients in each of the bands in which we observed and calculated the absolute flux of our tar-gets using observations of standard stars (from Smith et al. 2002) taken in twilight. Using our extinction coefficients we extrapolated all fluxes to an airmass of0.
2.2 HAWK-I NIR photometry
We observed SDSS J0303+0054 for a full binary orbit with the in-frared imager HAWK-I installed at the Nasmyth focus of VLT-UT4 at Paranal (Kissler-Patig et al. 2008). We used the fast photometry mode which allowed us to window the detectors and achieve a neg-ligible dead time between frames (a few microseconds). We used theKSband filter and exposure times of 1 second. The data were reduced using the ULTRACAM pipeline in the same manner as de-scribed in the previous section. The data were flux calibrated using 2MASS measurements of nearby comparison stars.
2.3 X-shooter spectroscopy
An eclipsing magnetic white dwarf
3
Figure 1. Phase folded ULTRACAM and HAWK-I light curves. The light curves have been normalised to the regions immediately before and after the primary
eclipse and offset from each other vertically by 1. The gaps in ther′and
KSbands are caused by a lack of coverage.
(D’Odorico et al. 2006) mounted at the Cassegrain focus of VLT-UT2 at Paranal. X-shooter consists of 3 independent arms that give simultaneous spectra longward of the atmospheric cutoff (0.3 mi-crons) in the UV (the “UVB” arm), optical (the “VIS” arm) and up to 2.5 microns in the near-infrared (the “NIR”arm). We used slit widths of 1.0”, 0.9” and 0.9” in X-shooter’s three arms and binned by a factor of two in the dispersion direction in the UVB and VIS arms resulting in a spectral resolution of 2500–3500 across the en-tire spectral range.
The reduction of the raw frames was conducted using the stan-dard pipeline release of the X-shooter Common Pipeline Library (CPL) recipes (version 1.5.0) within ESORex, the ESO Recipe Ex-ecution Tool, version 3.9.6. The standard recipes were used to opti-mally extract and wavelength calibrate each spectrum. The instru-mental response was removed by observing the spectrophotometric standard star LTT 3218 and dividing it by a flux table of the same star to produce the response function. The wavelength scale was also heliocentrically corrected. A telluric correction was applied using observations of the DC white dwarf GD 248 obtained just before the start of our observations of SDSS J0303+0054.
3 RESULTS
3.1 Light curves
Figure 1 shows our ULTRACAM and HAWK-I light curves folded on the ephemeris of Pyrzas et al. (2009). The features visible are similar to those reported by Parsons et al. (2010b), namely ellip-soidal modulation in the longer wavelength bands, and small out-of-eclipse variations in theu′
andg′
bands. Figure 2 shows a zoom-in on these variations, which are roughly szoom-inusoidal, peakzoom-ing just
before the eclipse of the white dwarf. This variation is strong in the u′
band (∼10%) whilst it is slightly weaker in theg′
band (∼5%). The M dwarf is not detected during theu′
band eclipse im-plying that it contributes a negligible amount of flux in this band. Therefore, the variations in theu′
band light curve must originate from variations in brightness on the surface of the white dwarf (rul-ing out starspots on the M star as suggested in Parsons et al. 2010b). The fact that this variation has remained constant over the 5 years spanning our ULTRACAM observations strongly implies that the white dwarf is synchronously rotating with the binary (as is the M star, since its tidal synchronisation timescale is much shorter than the cooling age of the white dwarf). The M star contributes 20% of the overall flux in theg′
band meaning that, in addition to the vari-ation from the white dwarf, there is also a small ellipsoidal modu-lation component in this band (although the white dwarf variations still dominate). Since ellipsoidal modulation causes peaks at phases 0.25 and 0.75, the maximum of the light curve occurs slightly ear-lier than in theu′
band, and the minimum occurs slightly later (see Figure 2).
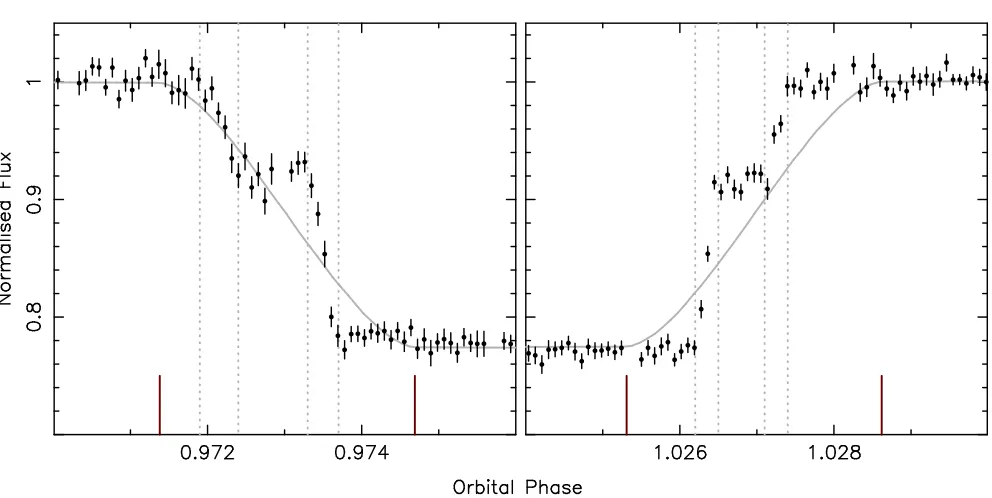
Figure 3 shows the HAWK-IKSband light curve around the time of the white dwarf eclipse. The first thing to note is that the eclipse of a∼8000 K white dwarf photosphere (Pyrzas et al. 2009) by an M4 dwarf should be∼1% in theKSband (see for example Figure 8), instead we observed a∼20% deep eclipse. Also plotted in Figure 3 is a model fitted to theg′
band ULTRACAM light curve (see Section 3.7 for details of the model fitting). The contact phases of the white dwarf eclipse at optical wavelengths do not correspond to those observed in theKS band. Furthermore, the ingress and egress are stepped, indicating that two small regions (bright in the KSband) on the surface of the white dwarf are being eclipsed.
Figure 2. Out-of-eclipse variations in the ULTRACAMu′andg′band light
curves. Eclipse points have been removed and the data binned by a factor of 5. There is a negligible contribution from the M star in theu′band, hence
the variations in this band must originate from the white dwarf. There is a small contribution from the M star in theg′band in the form of ellipsoidal
modulation, which increases the flux around phase 0.25 and 0.75, moving the maximum earlier and the minimum later, compared to theu′band.
dwarf in SDSS J0303+0054 is in fact a magnetic white dwarf ac-creting a small amount of material from the wind of the M star. In theKSband we see cyclotron emission from accretion column above the magnetic poles of the white dwarf, it is this emission that is eclipsed. At optical wavelengths we see photospheric emis-sion from the two heated pole caps on the white dwarf, on top of the general photospheric emission of the white dwarf (which dom-inates). Differences in the viewing angle to these poles as the white dwarf rotates causes the variations seen in theu′
andg′
band light curves. Although since the white dwarf photosphere dominates at these wavelengths, there is no hiatus visible during the eclipse at these wavelengths. Heated pole caps have been detected from every accreting magnetic white dwarf with appropriate observa-tions (see for example Stockman et al. 1994; Araujo-Betancor et al. 2005; G¨ansicke et al. 2006; Burleigh et al. 2006), hence there is lit-tle doubt that the white dwarf in SDSS J0303+0054 is accreting material from the wind of its companion.
A magnetic white dwarf also explains the infrared excess iden-tified initially by Debes et al. (2012). This excess is consistent with cyclotron emission from low-level accretion on to the magnetic white dwarf, and thus there is no compelling evidence for the exis-tence of a circumbinary disk.
3.2 Location of the poles
The correct determination of the pole locations require the ephemeris of the HAWK-I data to be as accurate as possible, since a shift of only a couple of seconds is significant compared to the ingress/egress times. Fortunately we have ULTRACAM observa-tions from a month before the HAWK-I observaobserva-tions, which re-duces the uncertainty in the ephemeris for these data. We used the quadratic ephemeris derived in Section 4.3 to determine the orbital phase of each HAWK-I data point. We estimate the timing accu-racy to be better than 1 second, smaller than our HAWK-I exposure times, and hence not a large source of uncertainty.
We constrain the location of the poles on the surface of the
white dwarf using the HAWK-I eclipse light curve and our model fit to the optical data (Section 3.7). We use our model to determine the location of the eclipse terminator on the surface of the white dwarf at the start and end of the eclipse of each pole. Figure 4 shows the regions where the poles are located. It is a highly non-dipolar field with each pole pointing more-or-less in the direction of the M star. The first pole to be eclipsed is the weaker, southern pole (which gives a shallower eclipse depth). However, this is the last pole to emerge from behind the M dwarf. This places an upper limit on the binary inclination (87.3◦
), above which it is impossible for this spot to emerge last, and the location of both spots is undetermined.
3.3 Spectrum
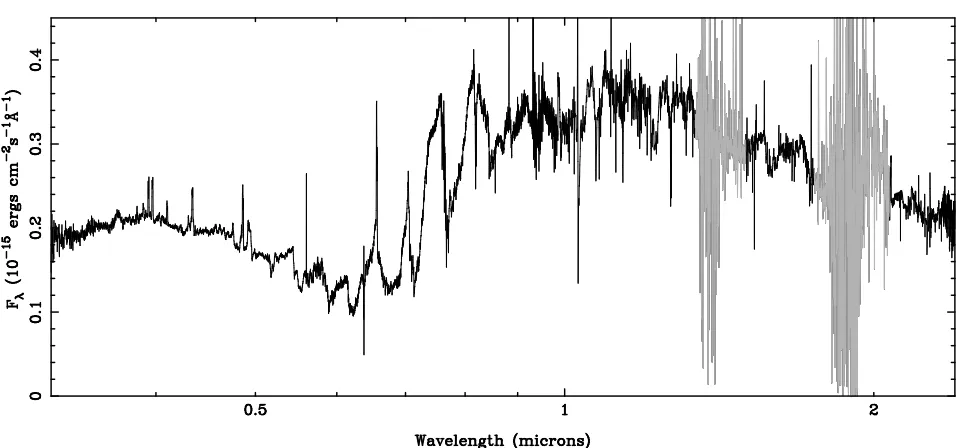
[image:5.612.43.279.68.251.2]The average spectrum of SDSS J0303+0054 is shown in Figure 5. The two components are easily visible, although no absorption fea-tures from the white dwarf are detected, confirming its DC nature. Several strong emission lines are seen originating from the M dwarf including the hydrogen Balmer series and the CaIIH and K lines. Figure 6 shows a trailed spectrum of the Hαemission line, reveal-ing that it is in fact split in two obvious components. The strongest component comes from the M dwarf and peaks around phase 0.5, its radial velocity amplitude is slightly less than that of the M dwarf centre-of-mass (see Section 3.4). This implies that a large amount of the line flux originates from the inner hemisphere of the M star. This is often seen is systems with hot white dwarfs (e.g. Parsons et al. 2010a), but the white dwarf in SDSS J0303+0054 is too cool to directly heat the M dwarf to such an extent (it receives
∼0.001 times its own luminosity from the white dwarf). This effect has been seen in other cool white dwarf plus main-sequence bina-ries, WD 0137-349 for example (Maxted et al. 2006). It is possible that the accretion of the M dwarf’s wind material on to the white dwarf produces X-rays directed back towards the M star, driving this emission on the hemisphere facing the white dwarf.
Arguably the most interesting feature in Figure 6 is the second, weaker and lower-amplitude component. Given that the stronger component comes from the inner face of the M star, this weaker component cannot come from the M dwarf itself, but rather ma-terial between the two stars. However, since this weaker compo-nent moves in the same direction as the M dwarf, the material does not extend beyond the binary centre-of-mass towards the white dwarf. If it did we would expect to see some material moving in antiphase with the M star, which we do not detect. Therefore, it is likely that this material is being magnetically confined be-tween the two stars. Similar features have been seen in several CV and have been attributed to slingshot prominences (Steeghs et al. 1996; G¨ansicke et al. 1998; Kafka et al. 2005, 2006; Watson et al. 2007), similar features have also been seen in the PCEB QS Vir (Parsons et al. 2011). Interestingly, this weaker component shows a narrow eclipse-like feature around phase 0.79. Given that this fea-ture repeats itself between orbits it is likely real. However, since the two stars are side-by-side at this phase, as seen from Earth, any eclipse of this material by one of the stars seems unlikely. The emission also appears to have some structure but the resolution of our data is inadequate to resolve this.
3.4 M star radial velocity amplitude
com-An eclipsing magnetic white dwarf
5
Figure 3. HAWK-IKSband light curve around the time of the white dwarf eclipse. Overplotted is a model (gray line) of the white dwarf eclipse from fitting theg′band light curve (i.e. the white dwarf photosphere) scaled to give the same eclipse depth. The vertical dotted lines indicate the contact phases of the
eclipse of each pole, note the difference between these and the eclipse of the photosphere (the measured photospheric contact points are indicated by the red lines). Furthermore, there is a hiatus halfway through the ingress and egress, indicating that what we see eclipsed in the data are two small regions on the surface of the white dwarf.
ponent. We also fitted the KI7700 ˚A absorption line (which is un-affected by telluric absorption) in the same manner. All the fea-tures gave consistent results and Figure 7 shows the fit to one of the sodium lines. We measure a radial velocity amplitude for the M star of Ksec = 339.9±0.3 km s−1 with a systemic compo-nent ofγsec= 14.9±0.2 km s−1, consistent with, but more pre-cise than, the measurements of Pyrzas et al. (2009). We also find no significant variations in the equivalent width of the line throughout the orbit, indicating that the strength of the absorption is uniform across the surface of the M star and hence we are indeed tracking the centre of mass of the star.
3.5 The white dwarf’s spectrum
Having determined the radial velocity amplitude of the M dwarf we then attempted to remove this component from the spectra to reveal the underlying white dwarf’s spectrum. Two spectra were taken completely in eclipse and only contain the spectrum of the M dwarf, hence we averaged these spectra to make the M dwarf spectrum. We then shifted and subtracted this spectrum from all the others, based on our radial velocity measurements. In each case the M dwarf spectrum was scaled in order to minimise the residuals after subtraction in regions dominated by large M dwarf absorption features (regions also unlikely to contain any white dwarf features). This corrects for the varying contribution of the M dwarf compo-nent to the overall flux during the orbit, due mainly to ellipsoidal modulation. However, the M dwarf emission lines are not removed since their strengths vary during the orbit in a different way to the the absorption features. Furthermore, since the additional emission component from the confined material does not move with the M dwarf it too was not removed. To avoid confusing residuals we re-moved the emission components in the M dwarf template spectrum
Figure 4. Location of the two magnetic poles on the surface of the white
dwarf for an inclination of 84.5◦, longitude zero points towards the M star.
Dashed lines show the position of the eclipse terminator during the ingress, as it moves north-eastward, whilst solid lines show the terminator during the egress, as it moves south-eastward. We show the terminator position for four phases on the ingress and four on the egress. These are the start and end phases of the eclipse of each pole as determined from the HAWK-I eclipse (the dotted lines in Figure 3). The shaded regions indicate the possible lo-cations of the spots, black lines for the first (weaker) pole eclipsed (and last to emerge) and red lines for the second (stronger) pole to be eclipsed (the first to emerge). Also shown is the total surface of the white dwarf visible at these phases, indicated by the lines on either side, the difference between results from the rotation of the white dwarf during the eclipse.
by manually setting the emission regions to the surrounding con-tinuum level.
[image:6.612.310.539.390.555.2]Figure 5. Averaged, telluric corrected X-shooter spectrum of SDSS J0303+0054. The strongJandHband telluric absorption regions have been grayed out.
Figure 6. Trailed spectrum of the Hαline. The continuum has been sub-tracted. Two emission components are visible, the strongest, high-amplitude component originates from the M dwarf and becomes stronger around phase 0.5. The weaker low-amplitude component originates between the two stars and is likely caused by magnetically confined material. The red line tracks the motion of the centre-of-mass of the M star.
[image:7.612.43.284.333.512.2]VIS arms of X-shooter. SDSS J0303+0054 was observed with GALEX as part of the Medium Imaging Survey (MIS) with ex-posure times of 2422s and 3687s in the far- and near-ultraviolet, respectively. We indicate the measured GALEX fluxes in Figure 8. As previously noted, the strong M dwarf emission components have not been removed, neither has the additional component from the confined material. However, additional emission lines are seen in Figure 8. These features do not move with the M dwarf. Given the magnetic nature of the white dwarf, these are likely to be Zeemen split and shifted components of the hydrogen lines from the white dwarf. Zeeman split emission lines have only been seen in one other white dwarf, GD 356 (Greenstein & McCarthy 1985; Ferrario et al. 1997). The emission lines in the apparently isolated
Figure 7. Radial velocity fit to the NaI8200 ˚A absorption doublet from the M dwarf. The error bars are too small to be seen in the upper panel.
[image:7.612.305.544.333.510.2]An eclipsing magnetic white dwarf
7
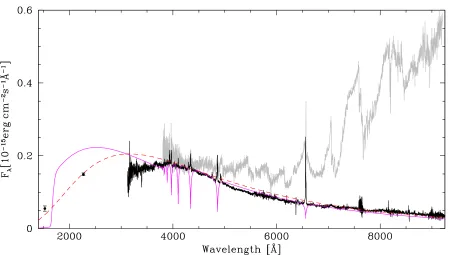
Figure 8. Spectrum of SDSS J0303+0054 with the white dwarf and M star components separated. Emission features from the M star and the confined material
[image:8.612.42.547.398.583.2]were not removed from the white dwarf component. Additional emission features are seen near the hydrogen Balmer lines (most obvious for the Hβline in this plot) these are Zeeman split and shifted components from the white dwarf. Also overplotted are a 9150 K blackbody spectrum (dashed red line) and a non-magnetic DA white dwarf spectrum (solid magenta line) scaled to fit the spectrum of the white dwarf in SDSS J0303+0054. We also show the GALEX FUV and NUV fluxes, the non-magnetic white dwarf clearly over-predicts the NUV flux.
Figure 9. White dwarf emission features. The central (strong) components in each line are from the M star and confined material. Overplotted are the positions
of the Zeeman split components as a function of the magnetic field strength. The peaks of the emission features show good agreement with a field strength of 8±1MG.
white dwarf would make these components unreliable tracers of the centre-of-mass of the white dwarf.
Figure 9 shows a zoom in on several of the hydrogen Balmer lines. Over-plotted are the locations of the Zeeman split compo-nents as a function of magnetic field strength from Friedrich et al. (1996). Good agreement is found for a field strength of 8 MG. This field strength is supported by the lack of any obvious cyclotron lines in our data. For a field strength of 8 MG the fundamental cyclotron line will be located at 13.3 microns far beyond our wavelength
cov-erage, in fact the 5thharmonic at 2.2 microns would be the lowest harmonic visible. This is consistent with the large infrared excess detected by Debes et al. (2012) which peaks around 10 microns.
The emission lines from the white dwarf likely originate from above its surface. Although measurements of the gravitational red-shift of absorption and emission lines in the PCEB LTT 560 showed little difference (Tappert et al. 2011) indicating that the emitting re-gions are close to the surface. Since the magnetic field strength decreases with hight as1/r3
field strength. However, the components are fairly sharp meaning that the field strength does not vary considerably over the emit-ting region, hence it cannot extend too far. Furthermore, in po-lars, where both (photospheric) Zeeman components and cyclotron lines are visible, the field strengths generally agree. For example, a field strength of 24–25 MG was measured from both the Zee-man and cyclotron components in the polar MR Ser (Schwope et al. 1993) and the 13 MG measurement of the field strength in EF Eri (Beuermann et al. 2007) from the Zeeman lines is consistent with the 12.6 MG measurement from the cyclotron lines (Campbell et al. 2008). Therefore, it is likely that the field strength of the white dwarf in SDSS J0303+0054 is close to 8 MG.
In Figure 8 we also plot a blackbody spectrum and a non-magnetic DA white dwarf spectrum fitted to the observed white dwarf spectrum. Adopting a distance of 140 pc and a white dwarf radius of 0.00975R⊙(see section 4.1) gives a best fit blackbody
temperature of 9150 K. A DA white dwarf model with aTeff of 9150 K (shown in Figure 8) matches the optical spectrum, but clearly over-predicts the GALEX NUV flux. This is somewhat un-expected as the effect of a 8 MG field should not dramatically affect the Lymanαline. However, with the data to hand we are unable to explain this discrepancy. UV spectroscopy would be helpful in identifying the cause.
3.6 M star rotational broadening
Limits can be placed on the physical parameters of the two stars in SDSS J0303+0054 by measuring the rotational broaden-ing (vrotsini) of the M star. This was achieved using the method detailed in Marsh et al. (1994). We corrected the radial velocity of each spectrum to the rest frame of the M star and averaged the re-sulting spectra together. We then artificially broadened the spectra of four template M dwarf stars: GJ 849 (M3.5), GJ 876 (M4.0), GJ 3366 (M4.5) and GJ 2045 (M5.0), and subtracted these from the spectrum of SDSS J0303+0054 (multiplied by a constant rep-resenting the fraction of the flux from the M star). The constant was varied to optimise the subtraction, and theχ2
difference be-tween the residual spectrum and a smoothed version of itself is computed. We focused on the sodium 8190 ˚A absorption doublet (using the wavelength range 8100–8300 ˚A). Figure 10 shows the
χ2
of the fit as a function of rotational broadening for all four template stars as well as the minimumχ2
values. We found that the M3.5 and M4.0 template spectra were a poor fit to the M star in SDSS J0303+0054, giving a minimumχ2
a factor of five and four worse than the M4.5 template respectively. The M5.0 tem-plate was a better fit than both these temtem-plates but not as good as the M4.5 template (by a factor of 1.5 in χ2
) which gives an ex-cellent fit to the data, although the optimal values for all the tem-plates are similar. These values are slightly dependent upon the choice of limb-darkening coefficient used. For a main-sequence star with a spectral type in this range we would expect a limb-darkening coefficient of∼0.5 (Claret & Bloemen 2011) around the sodium lines. We note that this value is strictly only appropriate for the continuum of the M star and so we calculated the opti-mal values for a range of limb-darkening coefficients from 0.4 to 0.6 and find that this shifts the results by∼1km s−1
, similar to the small effects seen by Copperwheat et al. (2012) for the donor star in the CV OY Car. Therefore, we conclude that the M star in SDSS J0303+0054 has a spectral type of M4.5–M5.0 with a ro-tational broadening ofvrotsini= 81.7±1.1 km s−1(the uncer-tainty comes from the unknown limb-darkening coefficient, the for-mal error estimate is∆χ2
[image:9.612.306.545.70.245.2]±1 = 0.7for the M4.5 template star).
Figure 10. χ2
as a function of rotational broadening for the M star in SDSS J0303+0054, using four different template stars, using a limb-darkening coefficient of 0.55. The number shown below the spectral type is the minimumχ2value for that template. The M4.5 template broadened by 81.7km s−1gives an excellent fit to the M dwarf in SDSS J0303+0054.
We will use this measurement to constrain the parameters of the stars in Section 4.1.
3.7 Modeling the light curve
Eclipsing PCEBs have been used to measure masses and radii of white dwarfs and low-mass stars to high-precision (see for example Parsons et al. 2010a, 2012a,b; Pyrzas et al. 2012). For SDSS J0303+0054, we chose to fit just the g′
band light curve around the eclipse of the white dwarf. In theory the ellipsoidal mod-ulation seen in thei′
band light curve can be used to constrain the inclination (and hence radii) of the system. However, the magnetic effects of the white dwarf on the light curves (Section 3.1) are dif-ficult to model correctly and could lead to significant systematic uncertainties in any derived parameters. The transit of the white dwarf across the face of the M star can also be used to measure the inclination but is too shallow to detect in our data. The eclipse of the white dwarf in theg′
band is deep and has high signal-to-noise, whilst also being less affected by the photospheric emission from the heated pole caps than theu′
band, making it the cleanest feature visible in our light curves.
We model the light curve data using using a code writ-ten for the general case of binaries containing white dwarfs (see Copperwheat et al. 2010 for a detailed description). The program subdivides each star into small elements with a geometry fixed by its radius as measured along the direction of centres towards the other star with allowances for Roche geometry distortion. The limb darkening of both stars was set using a 4-coefficient formula:
I(µ)/I(1) = 1−
4
X
i=1
ai(1−µi/2), (1)
An eclipsing magnetic white dwarf
9
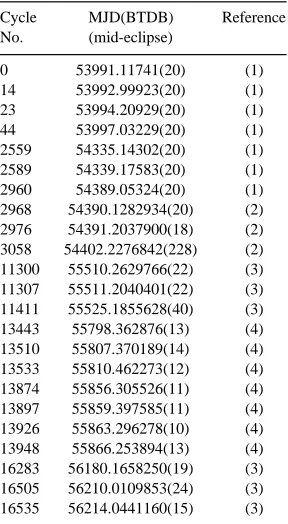
Table 2. Eclipse times for SDSS J0303+0054. (1) Pyrzas et al. (2009), (2)
Parsons et al. (2010b), (3), this paper, (4) Backhaus et al. (2012).
Cycle MJD(BTDB) Reference No. (mid-eclipse)
0 53991.11741(20) (1) 14 53992.99923(20) (1) 23 53994.20929(20) (1) 44 53997.03229(20) (1) 2559 54335.14302(20) (1) 2589 54339.17583(20) (1) 2960 54389.05324(20) (1) 2968 54390.1282934(20) (2) 2976 54391.2037900(18) (2) 3058 54402.2276842(228) (2) 11300 55510.2629766(22) (3) 11307 55511.2040401(22) (3) 11411 55525.1855628(40) (3) 13443 55798.362876(13) (4) 13510 55807.370189(14) (4) 13533 55810.462273(12) (4) 13874 55856.305526(11) (4) 13897 55859.397585(11) (4) 13926 55863.296278(10) (4) 13948 55866.253894(13) (4) 16283 56180.1658250(19) (3) 16505 56210.0109853(24) (3) 16535 56214.0441160(15) (3)
[image:10.612.90.234.105.367.2]phase-fold the data. The measured mid-eclipse times, as well as other published eclipse times for SDSS J0303+0054 are listed in Table 2.
Having determined the mid-eclipse times for all our light curves we phase-folded the data and fitted a model to the com-bined light curve. The eclipse of the white dwarf alone does not contain enough information to break the degeneracy between the orbital inclination(i) and the radii of the two stars scaled by the orbital separation (RWD/aandRsec/a). However, for a given in-clination and mass ratio, the eclipse light curve (combined with the period andKsecmeasurement) allows us to solve for the masses and radii of both stars using only Kepler’s laws. Therefore, we fit-ted the eclipse light curve over a range of probable inclinations (i >80◦) and mass ratios (q =M
sec/MWD <0.35). Figure 11 shows the fit to the combinedg′
band eclipse light curve.
4 DISCUSSION
4.1 System parameters
As previously stated, modeling the eclipse of the white dwarf alone does not allow us to independently solve for all the system parame-ters. However, it does allow us to exclude some areas of parameter space. This is because it is impossible to fit the eclipse light curve for low mass ratios without the M star filling its Roche-lobe, which we know not to be the case (there are no disc or stream features in our data and SDSS J0303+0054 is not an X-ray source). Figure 12 shows the region in which the M star fills its Roche lobe, from this constraint alone we know thatq > 0.06. We also plot the upper limit on the inclination of87.3◦
from theKSband eclipse of the two poles on the surface of the white dwarf, above which it is im-possible to reproduce their observed eclipse phases in theKSband
Figure 11. Model fit to the eclipse of the white dwarf in the ULTRACAM g′band.
eclipse light curve (i.e. their location on the surface of the white dwarf is undetermined).
For each combination of mass ratio and inclination we com-pute the volume average radius of the M star. We then determined what the rotational broadening of such a synchronously rotating M dwarf would be. The shaded area of Figure 12 shows the re-gion where this computed value is consistent with the measured value from our spectroscopic data (i.e. the true system parameters lie somewhere in the shaded region). This increases our minimum mass ratio limit toq >0.12and places a lower limit on the incli-nation ofi>83◦
.
Also plotted in Figure 12 is the mass-radius relationship for a 3 Gyr old active low-mass star from Morales et al. (2010). The masses and radii of low mass stars in eclipsing PCEBs have gen-erally been consistent with these mass-radius relationships (see for example Parsons et al. 2012b). However, several measurements from eclipsing PCEBs as well as results from eclipsing main-sequence binaries and other sources have shown that the measured radii can be up to 10% oversized when compared to mass-radius re-lationships (Feiden & Chaboyer 2012; Terrien et al. 2012). There-fore, we also also show the constraints for a 10% oversized M star in Figure 12, the actual M star radius almost certainly lies be-tween these two limits. The region where these constraints overlap with the rotational broadening constraint indicates the most likely system parameters, which are listed in Table 3. These results are broadly consistent with those of Pyrzas et al. (2009) but are more precise. These parameters also predict an ellipsoidal modulation amplitude consistent with our ULTRACAMi′
band observations (where this effect dominates), although due to the heated poles of the white dwarf the fit is not perfect. The white dwarf’s mass and radius show good agreement with models but our use of the low-mass star low-mass-radius relationship means that these results are not suitable for testing the relationships themselves. Nevertheless, there is no doubt that SDSS J0303+0054 hosts one of the most massive white dwarfs in a close, detached binary.
7450-Figure 12. Constraints on the inclination and mass ratio of the binary. The
light curve model constrains the minimum mass ratio, below which the M star fills its Roche lobe (i.e. the area to the right of this line is consistent with theg′ band eclipse data). The shaded area shows the region that is
also consistent with the rotational broadening measurement. TheKSband eclipse places an upper limit on the inclination, above which it is impossible to determine the location of the poles on the surface of the white dwarf. This constraint is only loosely dependent upon the mass ratio. Also plotted is the mass radius relationship for a 3 Gyr old active star star from Morales et al. (2010) and the same relationship but with a 10% oversized main-sequence star.
7550 ˚A and 7140-7190 ˚A. Measuring the observed fluxfTiOfrom the spectrum, the distance is then calculated as
d= r R2 sec FTiO fTiO . (2)
The uncertainty onRsecis fairly small hence the main uncertainties in the distance estimate are the flux calibration of the spectroscopy, and the spectral type of the companion. Adopting a conservative uncertainty in the spectral type of M5±1.0, and using the X-shooter spectrum, we find a distance of140±25pc, which is consistent with the result of Debes et al. (2012).
Better (model-independent) constraints on the system param-eters can be obtained using the full light curve (i.e. the ellipsoidal modulation) but will require a better understanding of the variations arising from the magnetic white dwarf (e.g. via polametric obser-vations). This would lead to the first model-independent mass and radius measurement for a magnetic white dwarf.
4.2 Location of the confined material
We can use our constraints on the system parameters to calculate the position of the confined material seen in the Hαline (Figure 6). Assuming that this material co-rotates with the binary, its location is given by
Kmat/Ksec= (1 +q)
R
a
−q, (3)
whereKmat andKsec are the radial velocity semi-amplitudes of the extra material and M star respectively,qis the mass ratio and R/ais the distance of the material from the white dwarf scaled by the orbital separation (a).
We measureKmatby fitting the Hαline with a combination of a first order polynomial and two Gaussians. We follow the
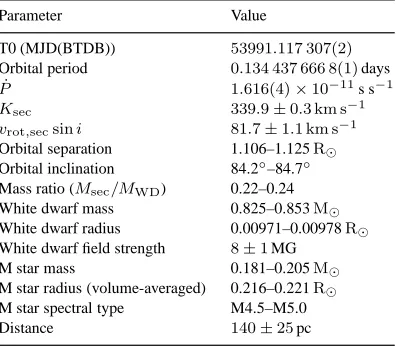
pro-Table 3. Orbital and physical parameters of SDSS 0303+0054.
Parameter Value
T0 (MJD(BTDB)) 53991.117 307(2) Orbital period 0.134 437 666 8(1)days
˙
P 1.616(4)×10−11s s−1
Ksec 339.9±0.3 km s−1
vrot,secsini 81.7±1.1 km s−1 Orbital separation 1.106–1.125R⊙
Orbital inclination 84.2◦–84.7◦
Mass ratio (Msec/MWD) 0.22–0.24 White dwarf mass 0.825–0.853M⊙
White dwarf radius 0.00971–0.00978R⊙
White dwarf field strength 8±1MG M star mass 0.181–0.205M⊙
M star radius (volume-averaged) 0.216–0.221R⊙
M star spectral type M4.5–M5.0
Distance 140±25pc
cedure outlined in Parsons et al. (2012a), whereby all of the spec-tra are fitted simultaneously and the position of the Gaussians are varied from spectrum-to-spectrum according to their orbital phase. This approach minimises any systematic effects caused by the two components crossing over. We also allowed the strength of the M dwarf component to vary with orbital phase according to
H=H0−H1cos(2πφ),
which allows the strength to peak at phase 0.5.
We findKmat = 117±1 km s−1. Using this measurement and the values in Table 3 givesR/a = 0.47, indicating that the material is located roughly half way between the two stars, slightly closer to the white dwarf, but still some way from the binary centre-of-mass.
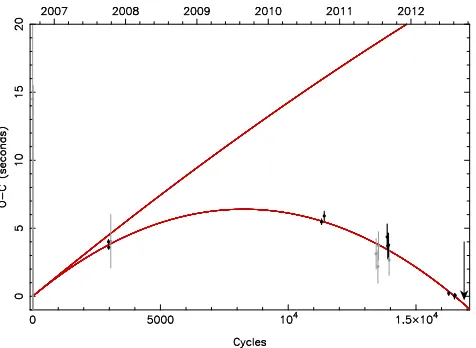
4.3 Orbital period variations
The best fit linear ephemeris to all the eclipse times of SDSS J0303+0054 is
MJD(BTDB) = 53991.117 307(2) + 0.134 437 666 8(1)E.
However, the eclipse arrival times show some deviations from this ephemeris (∼5 seconds, or more than 30σfor some points). Adding a quadratic term to the ephemeris results in a far better fit and is shown in Figure 13. The best-fit quadratic ephemeris is
MJD(BTDB) = 53991.117 243(3) + 0.134 437 687 9(7)E
−1.086(38)×10−12
E2,
which, following the procedure of Brinkworth et al. (2006), implies a rate of period change ofP˙ = 1.616(4)×10−11
s s−1 or an angular momentum loss ofJ /J˙ ≃4.0×10⁻¹¹
.
To estimate an upper limit on the angular momentum loss from the system, we use the standard magnetic braking relationship from Rappaport et al. (1983) (which is much larger than the angular mo-mentum loss via gravitational radiation)
˙
J≈ −3.8×10⁻³⁰
M⊙R4⊙MsecRγsecω
3
erg, (4)
[image:11.612.43.281.65.247.2] [image:11.612.306.504.96.269.2]An eclipsing magnetic white dwarf
11
Figure 13. Observed-Calculated (O-C) plot for the eclipse arrival times of
SDSS J0303+0054, with the gradient term removed. Times with uncertain-ties larger than 1 second have been grayed out. We also show a quadratic fit to the eclipse times. The other curve (virtually a straight line) is the max-imum period change possible from magnetic braking alone, which vastly under-predicts the true change meaning an additional period change mecha-nism is required. The arrow indicates the time of the HAWK-I observations.
period variation in Figure 13. The maximum angular momentum loss via standard magnetic braking in SDSS J0303+0054 isJ /J˙ ≃
5.3×10⁻¹²
, an order of magnitude smaller than seen and the curve in Figure 13 clearly under-predicts the observed period change.
The magnetic nature of the white dwarf may cause a reduc-tion in angular momentum loss via magnetic braking. This is be-cause the field lines from the M star are closed or connect to the field of the white dwarf, reducing the magnetic flux in open field lines hence reducing the effect of magnetic braking (Li et al. 1994). Furthermore, the mass of the M star is below the fully convective boundary hence it is likely that magnetic braking is not operating at all. Therefore, there is clearly an additional mechanism causing the period decrease.
The standard mechanism used to explain period variations in close binaries is Applegate’s mechanism (Applegate 1992), which is caused by fluctuations in the gravitational quadrupolar moment of the M star. Using the approach of Brinkworth et al. (2006) we find that1.2×1036
erg are required to drive the∆P = 2.086×
10−4
second period variation over the last∼6 years. Interestingly, the M star is comfortably able to supply this energy; the total energy available from the M star over this time period is2.9×1039
erg, therefore Applegate’s mechanism is a possible cause for the early eclipse arrival times. However, virtually every PCEB with long enough coverage eventually shows period variations that are too large to be explained as the result of Applegate’s mechanism. In many cases the variations are interpreted as the influence of a third body in orbit around the binary (see Zorotovic & Schreiber 2013 for a comprehensive list). It remains to be seen what the true cause is of the period decrease in SDSS J0303+0054.
4.4 Evolution
We calculate the future evolution of SDSS J0303+0054 following Schreiber & G¨ansicke (2003). Given the low mass of the M star we assume that the only angular momentum loss mechanism that is acting is gravitational radiation. This allows us to estimate the time needed to evolve in to a CV to be slightly less than a Gyr
(∼970Myrs). Roche-lobe overflow will start when the orbital pe-riod has decreased toPorb ∼ 2.1hrs corresponding to a binary separation of 0.83R⊙. At the onset of Roche-lobe overflow
ma-terial will reach a minimum distance from the white dwarf of rmin/a= 0.0488×q−0.464(Lubow & Shu 1975), which cor-responds to roughly ten per cent of the binary separation of the CV that will have formed. Using Equation 1 of Ferrario et al. (1989) we estimate the equilibrium radius between magnetic pressure from the∼8 MG magnetic field of the white dwarf and the ram pressure from the infalling material to be smaller thanrmin even for very low accretion rates of1014
g/sec. This implies that a disk will form around the white dwarf and that SDSS J0303+0054 will become an intermediate polar. However, as a note of caution, we highlight that the lowest-field polar known, i.e. V2301 Oph (Ferrario et al. 1995), is quite similar to the CV that SDSS J0303+0054 will become. Fur-thermore, the equation from Ferrario et al. (1989) represents just a rough approximation as, for example, a pure dipole and radial in-flow is assumed, and we know the field is not dipolar, based on the location of the poles. We therefore cannot completely exclude the possibility that SDSS J0303+0054 will become a polar instead of an intermediate polar.
At first glance, the history of SDSS J0303+0054 seems to be even less certain than its future. It could either have emerged from the common envelope and is now a classical PCEB evolving slowly into a CV or, given its current period of 3.2 hrs and the period it will have when starting mass transfer of 2.1 hrs, one might also specu-late that it is in fact a detached CV that recently entered the period gap (Davis et al. 2008). However, one needs to take into account that above the orbital period gap SDSS J0303+0054 must have been an intermediate polar (i.e. the white dwarf was asynchronously ro-tating). According to Equation 1 of Campbell (1984), after enter-ing the period gap it would have taken∼ 1.2Gyrs for the white dwarf to reach its current synchronised state. If this is correct it implies that SDSS J0303+0054 is not a gap-CV:1.2Gyrs ago the system had an orbital period of∼4.2 hrs and was not even close to Roche-lobe filling, hence SDSS J0303+0054 has never been a CV. We therefore conclude that SDSS J0303+0054 is a genuine detached PCEB on its way from the common envelope phase to-wards becoming a CV. In this scenario, the cooling age of the WD (∼ 2Gyrs) tells us that roughly two thirds of its PCEB lifetime have passed (recall it needs∼1Gyrs to start mass transfer). Given the high mass of the primary, the progenitor of the white dwarf must have been fairly massive (> 4 M⊙). Thus, the time the
sys-tem spent as a main sequence binary is small compared to the total PCEB lifetime (∼3 Gyrs). This means that SDSS J0303+0054 is a pre-CV in the sense defined by Schreiber & G¨ansicke (2003), i.e. it’s total CV formation time is less than the age of the Galaxy and it can be considered representative for the progenitors of the current CV population.
5 CONCLUSIONS
able to determine the location of these poles and found that the field is highly non-dipolar, with both poles facing more-or-less towards the M star. Our spectroscopic observations revealed the existence of material roughly half way between the M star and the white dwarf, that is likely to be magnetically confined.
We combine radial velocity measurements, rotational broad-ening measurements and a model to the light curve to constrain the system parameters. The 0.84M⊙white dwarf is relatively massive
for a post common envelope binary whilst the M4.5 dwarf star has a mass of 0.19M⊙.
Finally, we also detect a decrease in the orbital period of the system over the last 6 years of∆P = 2.086×10⁻⁴
s. The magni-tude of this period decrease is too large to be caused by angular mo-mentum loss via magnetic braking. However, it can be comfortably explained as the result of Applegate’s mechanism. Further monitor-ing of the system will reveal the true nature of this period change. SDSS J0303+0054 is a pre-CV that will likely evolve into an inter-mediate polar in∼970 Myrs.
ACKNOWLEDGMENTS
We thank the anonymous referee for their comments. SGP ac-knowledges support from the Joint Committee ESO-Government of Chile. ULTRACAM, TRM, BTG, VSD and SPL are supported by the Science and Technology Facilities Council (STFC). The research leading to these results has received funding from the European Research Council under the European Union’s Seventh Framework Programme (FP/2007-2013) / ERC Grant Agreement n. 267697 (WDTracer). MRS thanks for support from FONDECYT (1100782) and Millennium Science Initiative, Chilean ministry of Economy: Nucleus P10-022-F. The results presented in this paper are based on observations collected at the European Southern Ob-servatory under programme IDs 087.D-0046 and 090.D-0277.
REFERENCES
Applegate, J. H., 1992, ApJ, 385, 621
Araujo-Betancor, S., G¨ansicke, B. T., Long, K. S., Beuermann, K., de Martino, D., Sion, E. M., Szkody, P., 2005, ApJ, 622, 589 Backhaus, U., et al., 2012, A&A, 538, A84
Beuermann, K., 2006, A&A, 460, 783
Beuermann, K., Euchner, F., Reinsch, K., Jordan, S., G¨ansicke, B. T., 2007, A&A, 463, 647
Brinkworth, C. S., Marsh, T. R., Dhillon, V. S., Knigge, C., 2006, MNRAS, 365, 287
Burleigh, M. R., et al., 2006, MNRAS, 373, 1416 Campbell, C. G., 1984, MNRAS, 211, 69
Campbell, R. K., Harrison, T. E., Schwope, A. D., Howell, S. B., 2008, ApJ, 672, 531
Claret, A., Bloemen, S., 2011, A&A, 529, A75+
Copperwheat, C. M., Marsh, T. R., Dhillon, V. S., Littlefair, S. P., Hickman, R., G¨ansicke, B. T., Southworth, J., 2010, MNRAS, 402, 1824
Copperwheat, C. M., et al., 2012, MNRAS, 421, 149
Davis, P. J., Kolb, U., Willems, B., G¨ansicke, B. T., 2008, MN-RAS, 389, 1563
Debes, J. H., 2006, ApJ, 652, 636
Debes, J. H., Hoard, D. W., Farihi, J., Wachter, S., Leisawitz, D. T., Cohen, M., 2012, ApJ, 759, 37
Dhillon, V. S., et al., 2007, MNRAS, 378, 825
Dobbie, P. D., Baxter, R., K¨ulebi, B., Parker, Q. A., Koester, D., Jordan, S., Lodieu, N., Euchner, F., 2012, MNRAS, 421, 202 Dobbie, P. D., et al., 2013, MNRAS, 428, L16
D’Odorico, S., et al., 2006, in Proc. SPIE, vol. 6269, p. 98 Faulkner, J., 1971, ApJ, 170, L99+
Feiden, G. A., Chaboyer, B., 2012, ApJ, 761, 30 Ferrario, L., 2012, MNRAS, 426, 2500
Ferrario, L., Tuohy, I. R., Wickramasinghe, D. T., 1989, ApJ, 341, 327
Ferrario, L., Wickramasinghe, D., Bailey, J., Buckley, D., 1995, MNRAS, 273, 17
Ferrario, L., Wickramasinghe, D. T., Liebert, J., Schmidt, G. D., Bieging, J. H., 1997, MNRAS, 289, 105
Friedrich, S., Oestreicher, R., Schweizer, W., 1996, A&A, 309, 227
G¨ansicke, B. T., Hoard, D. W., Beuermann, K., Sion, E. M., Szkody, P., 1998, A&A, 338, 933
G¨ansicke, B. T., Long, K. S., Barstow, M. A., Hubeny, I., 2006, ApJ, 639, 1039
Gianninas, A., Strickland, B. D., Kilic, M., Bergeron, P., 2013, ApJ, 766, 3
Greenstein, J. L., McCarthy, J. K., 1985, ApJ, 289, 732
Kafka, S., Honeycutt, R. K., Howell, S. B., Harrison, T. E., 2005, AJ, 130, 2852
Kafka, S., Honeycutt, R. K., Howell, S. B., 2006, AJ, 131, 2673 Kissler-Patig, M., et al., 2008, A&A, 491, 941
Kraft, R. P., Mathews, J., Greenstein, J. L., 1962, ApJ, 136, 312 K¨ulebi, B., Jordan, S., Nelan, E., Bastian, U., Altmann, M., 2010,
A&A, 524, A36
K¨ulebi, B., Kalirai, J., Jordan, S., Euchner, F., 2013, A&A, 554, A18
Li, J. K., Wu, K. W., Wickramasinghe, D. T., 1994, MNRAS, 268, 61
Liebert, J., Bergeron, P., Holberg, J. B., 2003, AJ, 125, 348 Liebert, J., et al., 2005, AJ, 129, 2376
Lubow, S. H., Shu, F. H., 1975, ApJ, 198, 383
Marsh, T. R., Robinson, E. L., Wood, J. H., 1994, MNRAS, 266, 137
Matranga, M., Drake, J. J., Kashyap, V., Steeghs, D., 2012, ApJ, 747, 132
Maxted, P. F. L., Napiwotzki, R., Dobbie, P. D., Burleigh, M. R., 2006, Nature, 442, 543
Morales, J. C., Gallardo, J., Ribas, I., Jordi, C., Baraffe, I., Chabrier, G., 2010, ApJ, 718, 502
O’Donoghue, D., Koen, C., Kilkenny, D., Stobie, R. S., Koester, D., Bessell, M. S., Hambly, N., MacGillivray, H., 2003, MN-RAS, 345, 506
Parsons, S. G., Marsh, T. R., Copperwheat, C. M., Dhillon, V. S., Littlefair, S. P., G¨ansicke, B. T., Hickman, R., 2010a, MNRAS, 402, 2591
Parsons, S. G., Marsh, T. R., G¨ansicke, B. T., Tappert, C., 2011, MNRAS, 412, 2563
Parsons, S. G., et al., 2010b, MNRAS, 407, 2362 Parsons, S. G., et al., 2012a, MNRAS, 420, 3281 Parsons, S. G., et al., 2012b, MNRAS, 426, 1950 Potter, A. T., Tout, C. A., 2010, MNRAS, 402, 1072
Pretorius, M. L., Knigge, C., Schwope, A. D., 2013, MNRAS, 432, 570
Pyrzas, S., et al., 2009, MNRAS, 394, 978 Pyrzas, S., et al., 2012, MNRAS, 419, 817
An eclipsing magnetic white dwarf
13
Rebassa-Mansergas, A., G¨ansicke, B. T., Schreiber, M. R., Koester, D., Rodr´ıguez-Gil, P., 2010, MNRAS, 402, 620 Rebassa-Mansergas, A., Nebot G´omez-Mor´an, A., Schreiber,
M. R., G¨ansicke, B. T., Schwope, A., Gallardo, J., Koester, D., 2012, MNRAS, 419, 806
Reimers, D., Hagen, H.-J., 2000, A&A, 358, L45
Reimers, D., Hagen, H.-J., Hopp, U., 1999, A&A, 343, 157 Ribeiro, T., Baptista, R., Kafka, S., Dufour, P., Gianninas, A.,
Fontaine, G., 2013, A&A, 556, A34
Schmidt, G. D., Szkody, P., Henden, A., Anderson, S. F., Lamb, D. Q., Margon, B., Schneider, D. P., 2007, ApJ, 654, 521 Schmidt, G. D., et al., 2005, ApJ, 630, 1037
Schreiber, M. R., G¨ansicke, B. T., 2003, A&A, 406, 305 Schwope, A. D., Beuermann, K., Jordan, S., Thomas, H.-C., 1993,
A&A, 278, 487
Schwope, A. D., Nebot Gomez-Moran, A., Schreiber, M. R., G¨ansicke, B. T., 2009, A&A, 500, 867
Silvestri, N. M., et al., 2006, AJ, 131, 1674 Silvestri, N. M., et al., 2007, AJ, 134, 741 Smith, J. A., et al., 2002, AJ, 123, 2121
Steeghs, D., Horne, K., Marsh, T. R., Donati, J. F., 1996, MNRAS, 281, 626
Stockman, H. S., Schmidt, G. D., Liebert, J., Holberg, J. B., 1994, ApJ, 430, 323
Tappert, C., G¨ansicke, B. T., Schmidtobreick, L., Ribeiro, T., 2011, A&A, 532, A129
Terrien, R. C., Fleming, S. W., Mahadevan, S., Deshpande, R., Feiden, G. A., Bender, C. F., Ramsey, L. W., 2012, ApJ, 760, L9 Tout, C. A., Wickramasinghe, D. T., Liebert, J., Ferrario, L.,
Pringle, J. E., 2008, MNRAS, 387, 897 Verbunt, F., Zwaan, C., 1981, A&A, 100, L7
Vogel, J., Schwope, A. D., G¨ansicke, B. T., 2007, A&A, 464, 647 Vogel, J., Schwope, A. D., Schwarz, R., 2011, A&A, 530, A117 Watson, C. A., Steeghs, D., Shahbaz, T., Dhillon, V. S., 2007,
MN-RAS, 382, 1105
Wickramasinghe, D. T., Ferrario, L., 2000, PASP, 112, 873 Wickramasinghe, D. T., Farihi, J., Tout, C. A., Ferrario, L.,
Stan-cliffe, R. J., 2010, MNRAS, 404, 1984