promoting access to White Rose research papers
White Rose Research Online [email protected]
Universities of Leeds, Sheffield and York
http://eprints.whiterose.ac.uk/
This is the author’s post-print version of an article published inPowder Technology
White Rose Research Online URL for this paper:
http://eprints.whiterose.ac.uk/id/eprint/78352
Published article:
Yuan, Q, Jia, X and Williams, RA (2012) Validation of a multi-component digital dissolution model for irregular particles.Powder Technology, 240. 25 - 30. ISSN 0032-5910
Validation of a Multi-Component Digital Dissolution Model for Irregular Particles
Qingchun Yuan, Xiaodong Jia*, Richard A. Williams**
Institute of Particle Science and Engineering, School of Process, Environment and Materials Engineering, University of Leeds, Leeds, LS2 9JT, UK
* Corresponding author: [email protected]
** and College of Engineering and Physical Sciences, University of Birmingham, Birmingham, UK
Abstract
A new mesoscale simulation model for solids dissolution based on an computationally efficient and versatile digital modelling approach (DigiDiss) is considered and validated against analytical solutions and published experimental data for simple geometries. As the digital model is
specifically designed to handle irregular shapes and complex multi-component structures, use of the model is explored for single crystals (sugars) and clusters. Single crystals and the cluster were first scanned using X-ray microtomography to obtain a digital version of their structures. The digitised particles and clusters were used as a structural input to digital simulation. The same particles were then dissolved in water and the dissolution process was recorded by a video camera and analysed yielding: the overall dissolution times and images of particle size and shape during the dissolution. The results demonstrate the coherence of simulation method to reproduce
experimental behaviour, based on known chemical and diffusion properties of constituent phase. The paper discusses how further sophistications to the modelling approach will need to include other important effects such as complex disintegration effects (particle ejection, uncertainties in chemical properties). The nature of the digital modelling approach is well suited to for future implementation with high speed computation using hybrid conventional (CPU) and graphical processor (GPU) systems.
Keywords: Dissolution, simulation, Lattice Boltzmann Method, X-ray microtomography, CPU-GPU computation
1. Introduction
only on macroscopic properties (e.g., solubility, diffusion constant, surface area) but also on spatial arrangement of exposed surfaces[1,4]. Models used for the simulation thus need instantly to capture the interface evolution during the dissolution shrinkage of complex shapes. As a common feature, this is also shared in the simulation of such as the formation of ‘‘wormholes” in oil reservoir for enhanced oil recovery [5], the trapping of carbon dioxide for geological
sequestration [6], and the immobilizations of toxic contaminants in groundwater aquifers [7]. To be of practical use, it is essential for the computer models to be able to deal with real and arbitrary geometries containing multiple components, as clusters or agglomerates, in a complex structure. Advanced simulation needs to provide comprehensive knowledge for the formulation and manufacture of products with desired release profiles, and needs to be validated.
Several simulation models, all capable of handling irregular shapes, have been proposed. The shapes are usually represented either by a polygonal mesh (vector approach) or in a regular lattice grid (lattice approach). The vector approach tends to have difficulty in dealing with complex and varying solid/liquid interface at microscales.
In early work the authors cited the development of an algorithmic approach for using digital representations of particles to reveal their extent of overlap [8]. This was developed further to enable representation of complex and real particulate structures in a digital space. Since the location of phases was precisely in the digital grid defined no further computational overhead was needed to compute location. Consequently a framework for observing particle packing and
property changes with time was proposed [9-11]. The instant three dimensional geometry tracing capacity was then incorporated, by Jia and Williams [1,2], for dynamic digital simulation of dissolution (‘DigiDiss’). As a hybrid approach the DigDiss method sits between vector approach and lattice approach. Like the vector approach, it solves convective-diffusion partial differential equation for concentration distribution in the liquid medium; but unlike the vector approach, the calculations are done in the finite difference, instead of finite element/volume, fashion. The hybrid model uses LBM to provide the convection terms. The pure LBM approach normally only deals with limiting cases: either diffusion-controlled or reaction-controlled [5,12-14]. The hybrid model, on the other hand, handles the more general case where neither is missing, as well as the limiting cases. The model has been validated with analytical solutions for simple geometrical setups.
However, in most applications both diffusion and dissolution contribute significantly to the dissolution process.
Kang et al. [5] developed a LBM model for two dimensional simulation of chemical dissolution of limestone in porous framework into an injected acid media. The model coupled the surface
reaction with the diffusion between the wall and the bulk fluid flowing and transporting in arbitrary geometries and with locally unsteady state reactions. Accounting for the interaction of forced convection, molecular diffusion and surface reaction, a systematic simulation verified the experimental observation that there exists an optimal flow rate to facilitate the formation of wormhole and the minimized number of pore volumes to break through. The model and simulation were based on the assumption that solute concentrations are sufficiently low not to influence the solvent flow. This may not be the case in drug dissolution and delivery.
Using a vector approach, Stepaneck [3] developed a model and simulated the dissolution of three-dimensional virtual granules with varying porosity and binder–solids ratio. A surface mesh was used to represent a particle geometry and conventional CFD to calculate the flow. Effective dissolution rates of the granules were determined by gradually eroding material from the granule surface according to a material balance on the solid–liquid interface, obtained as the solution of a convection– diffusion problem in the surrounding liquid phase. Although possible, the model as presented in the paper did not appear to include re-meshing. As a result, the solid object shrank in size but did not change in shape during dissolution, whereas in reality sharp corners tend to disappear faster than smooth surfaces and the morphology of the dissolving particle keeps changing.
Li et al. [15] integrated a level set method into the standard grid-based approach to capture interface evolution of precipitation and/or dissolution using a sub-grid. Using this method they demonstrated flow and reactive transport simulation in one arbitrary three dimensional pore. The work demonstrated the three-dimensional capability and to explore the difference between the two- and three-dimensional physics, but the simple geometry only provides an insight into the coupling between physical and chemical processes. More efficient parallel codes need to be developed for more complex three-dimensional geometry and structure. In addition, the model was only validated by comparing with one-dimensional analytical solution and by performing a grid-refinement study.
reports a validation exercise, involving single brown sugar grains and monosodium glutamate (MSG) crystals, and a cluster formed by such crystals. The single crystals and the cluster were first scanned using X-ray microtomography to obtain a digital version of their structures. The digitised particles were used as a structural input to DigiDiss for simulations. The same particles were then dissolved in water and the dissolution process was recorded by a video camera attached to an optical microscope. From the recordings, overall dissolution times were obtained. These, together with the recorded images showing changes in shape during the dissolution process, were compared with model predictions. The results are encouraging. General agreement between experimental observations and model predictions has been observed for both the single crystals and the cluster. The exercise also revealed aspects of the model that need improvements. These aspects are briefly discussed in the paper.
2. Brief model description
Using the bottom-up approach, the problem can be formulated at cell level for mass balance as shown in Figure 1. For clarity the figure is shown as a 2D cell, but the formulation itself is in 3D. Take the interface between cell E0 and cell E2 as an example and without losing generality assuming a positive convective flow velocity along X axis, ux > 0. If both are fluid cells, flux J of
the dissolved entering E0 from E2 may be written as the first of the two boxed equations in Figure
1, which has in general two contributions: convection and diffusion where diffusion is described by Fick’s first law. If E2 is solid and E0 fluid, Noyes-Whitney equation is applied at the interface
to describe release of solid from E2 into E0. This is the second of the boxed equations in Figure 1.
In these equations, C is concentration, Cs solubility or saturation concentration, D diffusion constant, k dissolution constant, and Δx cell width. Similar equations can be written for other sides of cell E0. Combining the equations, we have a general expression for the transient case [1]:
(1)
For the steady state case, the left-hand side of Equation (1) is simply set to zero. Equation (1) updates the concentration explicitly at each time step. The formulation is first-order accurate in space and time. The same expression can also be obtained using a standard top-down finite difference scheme to discretise the convective-diffusion equation with Noyes-Whitney equation acting as boundary conditions at the solid/fluid interface. For each dissolving component:
Q z C y C x C D z C u y C u x C u t C z y
x
2 2 2 2 2 2 (2)
kS
C C
t W sat (3)
where C is the concentration at time t, D is diffusion coefficient, Q is a source term which links the two equations at solid/liquid interface, W is the weight of the dissolving component at time t, k is the dissolution rate constant, S is exposed surface area and Csat the saturation concentration of
3. Experimental
3.1Materials
Billington’s natural sugar crystals and large monosodium glutamate crystals (> 99.95%, Hongmei) were selected to be used as the materials to validate the dissolution model. The sugar crystals are composed of unrefined cane sugar with the natural molasses of the sugar cane. Both materials have very high solubility in water: 184 g/100 ml water for sugar, and 74 g/100ml water for monosodium glutamate at 20oC. These correspond to saturation limits (grams of the dissolved component in a unit solution) of 879 g/m3 for sugar and 717 g/m3 for monosodium glutamate.
3.2X-ray microtomography and digital model
X-ray microtomography was used to obtain both the internal and external structure of the particles studied, giving rise to a three dimensional particle model. A Phoenix Nanotom (Phoenix, GE) was used to scan the small particles at a lower micrometer (1-9 micron per voxel). The scan was carried out at 80-100 kv, 50-100 µA and a scan step of 0.25º per projection. The 1440 projections were reconstructed using Phoenix reconstruction software for the three dimensional structure. Such three dimensional data were then processed by using an in-house software program (DigiUltility) to orientate the model similar to that used in experiment and to scale down to a suitable voxel size to be accommodated into DigiDiss for dissolution simulation.
As mentioned in [16] understanding errors in spatial modelling may be of critical importance in accuracy of simulation. Both X-ray scan and pixel processing followed could give rise to errors to the original samples. Boundaries composed of pixels (internal and external surface, interface between different components) may have errors within one pixel length. To achieve more presentable models scanning resolutions at a lower micrometer were used. The higher resolution model was scaled down to an acceptable digital volume for simulation. To limit the generation of secondary errors in pixel operation, the scaling was carried out by combining a number of pixels avoiding the split of pixel.
A microscopic imaging method was developed to record the particle projection shape while it is dissolving in approximately 5 ml of tap water at room temperature. The experiment is carried out by either dropping the particle into the prepared water in a 10 ml beaker, or by rapidly adding water into the container. A transmission stereo-optical microscope of Nikon SMZ800, with a continuously adjustable objective lens of 1 to 6.3 times, was used to observe the shape and size change. The projection was recorded using a digital camera of Spot Insight QE Model # 4.2 and the software of SPOT Advanced. The images were taken in a sequence mode at a given time interval set. A Canon video camera was used to record the dissolving process of a larger particle cluster. The recoding has a resolution of 640x480.
4. Results and Discussion
4.1 Single particle
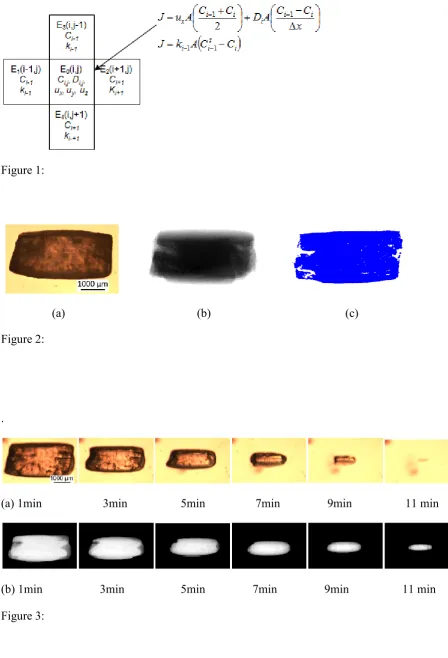
A brown sugar particle, as shown in Figure 2a, is used for the first example in the simulation of the dissolution process. The particle has an irregular external shape. Impurities in darker brown colour were observed in the sugar particle. The particle was scanned at a resolution of 9 µm per voxel for its three dimensional structure using x-ray micro-tomography. The scanned volume was rotated to the desired orientation as placed in actual experimental dissolution and then scaled down by combining a number of voxels to reduce the digital volume for simulation (Figure 2b and c). The three and two dimensional structures show there exit some random pores in the middle of the particle. Its digitised model shows a very similar appearance to the optical image.
The absolute solid volume and surface area of the particle were examined after the rotation and scaling down for the digital model preparation. The rotation and scale down to 36 µm resulted in a volume variation of less than 0.4 % to the scanned data, while the surface (including external and internal surface) counted varies approximately 15 % by re-orientation and scale down,
respectively.
After the X-ray scan, the sugar particle was dissolved in water for its real dissolving history as shown in Figure 3a. For the simulation, the model of 123x61x63 voxels with a voxel size of 36 µm was placed at the bottom of a virtual container of grid size of 400x400x300 voxels.
The diffusion coefficient of glucose in water of 6.73x10⁻¹⁰ m2/s [17] was used in the simulation. The dissolution rate constant was set at 5x10⁻⁴ m/s. Figure 3 shows that the simulated structures are generally similar to the experimentally recorded ones. There is an obvious difference in size towards the end of the dissolution process: the recorded one is smaller than the simulated. A probable reason is that as the sugar grain dissolved, it shrank and moved away from the fixed objective (lens) thus appearing smaller than it really was. The existence of impurities in the natural sugar crystal, and the natural convection driven by the dissolving heat, are some other factors that can make the difference.
Figure 4 shows the simulated release profile. The complete dissolution time, 750s, is the same as experimentally observed. The inset images show the concentration distribution of sugar in the water. Within the image four colour zones can be seen. The white in the middle is solid sugar. The red region next to the solid sugar is the high concentration zone of dissolved sugar. Further out as the sugar concentration decreases, we see yellowish, greenish and blue zone. The images suggest that the sugar dissolves faster than it diffuses away so that a significant high concentration zone formed. This phenomenon is more obvious in the hollows/gaps on the sugar surface, as shown in the inset images of Figure 4. The physical barrier hinders the diffusion and delays the dissolving rate of the local structure. The consequence is the volume at the convex part dissolves faster than that at the gap surface. Gradually, the remaining solid structure turns to have round edges and corners.
The procedure was repeated several times with different sugar grains, the trends are similar to the one reported here.
4.2 Particle cluster
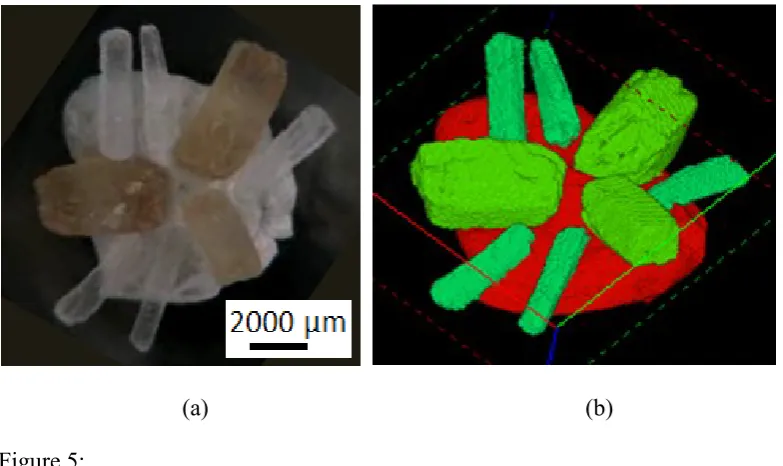
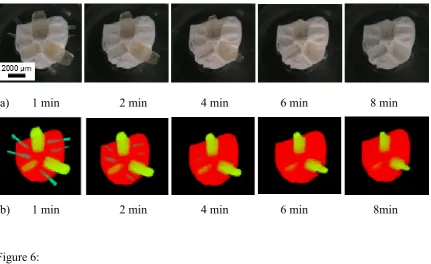
A crystal cluster made of three brown sugar grains and five monosodium glutamate needle crystals provides an example to further validate the dissolution process in a more complex environment. The solid particles/crystals were fixed on a non-dissolving adhesive soft substrate firmly as shown in Figure 5a. The cluster was scanned using X-ray microtomography at a voxel size of 7.5 µm, and further processed for its digital model, Figure 5, with a resolution of 120 µm per voxel for dissolution simulation. The dissolving process of the cluster sample was videoed. The images at the time 1, 2, 4, 6 and 8 minutes are shown in Figure 6a.
8x10⁻⁶ m/s were used for the monosodium glutamate. A higher diffusion coefficient is used, because monosodium glutamate ionises easily in water, as an electrolyte.
The simulated particle structures, Figure 6b, show that the monosodium glutamate crystals disappeared in about 2-3 minutes. The protruded parts thinned faster than those embedded in the soft substrate; and they disappeared first whether they were thinner or thicker than the other ends. The simulation results are consistent with those captured in the actual dissolving test, Figure 6a.
Similar trend was observed for the sugar grains. The images (Figure 6) also demonstrate that as the dissolution going on, the remaining structures have significantly smaller aspect ratios than the original geometries or equally shrank structures. This may suggest the top surface at the
embedded section dissolves quicker than the side surfaces, which is also consistent with the videoed images in Figure 6a.
Figure 7 shows simulated release profiles of the sugar grains and monosodium glutamate crystals. The inset images, of the cross sectional structures at 60 and 360 seconds, clearly show the
influence of sample geometry and diffusion on the dissolution of the solid particle. It agrees well with the decrease of the surface area in contacting with water and the hindered diffusion.
However, the total release time of the sugar grains simulated is much longer than observed (650-700 s). One plausible contribution to this large difference is that there was a small gap either pre-existed or developed during the dissolution test in the real cluster structure between the dissolving crystal grains and the non-dissolving white-tack substrate. Simulations show that even a small gap can make a significant difference. For example, consider simulations of a sugar cube (of
50x50x50 lattice dimensions) dissolving in water. If the cube was kept on the bottom side of the domain, thus, not participating in the dissolution, the complete dissolution time of the cube was 3047 s. If the cube was placed one pixel above the bottom to start with, the complete dissolution time became 2302 s which is very similar to the dissolution time (2295 s) of when the cube was placed in the middle of the domain. In other words, gap width only made a 0.3% difference; but blocking just one side (1/6 of total surface area) lengthens the dissolution time by about 1/3 (100*(3047-2302)/2302 = 32.4%). In the simulation setup of the cluster case, about 40% of
4.3 Discussion
The hybrid mesoscale model in the present stage simulates the dissolution process of randomly shaped particles using the lattice approach to capture the interface evolution, and the vector approach to control the dissolution and diffusion. The dissolution rate is purely governed by the saturation concentration (an equilibrium property) and diffusion rate of individual component (representing a steady-state condition). In the dissolution condition used in this paper, we
observed natural convection caused by either dissolution heat or desorption of adsorbed gas under microscope. Such convection was observed to significantly alter local dissolution rate and residual solid structure. Such effects need to be incorporated in future validation test, which requires developing better controlled experimental methods, ideally to provide three dimensional data sets for more comprehensive model evaluation.
Dissolution is a molecular level process and critically dependent on exposed surface area. It is well known that surface area obtained from digital imaging is different from (usually much lower than) its true value [19] and the difference is resolution dependent. The macroscopic level effects arising from this difference can be lumped in the empirical dissolution constant, k, in the Noyes-Whitney equation, but for a meso-scale simulation model still using Noyes-Noyes-Whitney equation, the choice of k value is much less straightforward. More work is required to investigate its influence on simulation results and to develop a robust calibration procedure.
For a system with multiple soluble components, the model assumes that dissolution and diffusion of individual components are independent, only the geometrical/structural effects are considered. This is an over-simplification and even counter-intuitive, but we are not aware of a quantitative description that can be used in the model to account for the multi-component effects.
Tablet dissolution can be much more complicated than the systems studied in this paper. Dissolution of the active often follows the disintegration of the excipient. Such disintegration generates a fairly strong local convection of the media enhancing the dissolution (shrinkage) of the active particles. The excipient dissolution may also alter the feature of liquid media to some extent. All these will contribute to more accurate prediction of the particle shrinkage and dissolution profiles of the active in tablets.
5. Conclusions
measured by standardised dissolution test methods [18]. The route is both time and cost
consuming. Validated computer models can provide a more comprehensive and economic design aide to shorten the trial and error process used so far. DigiDissis developed to be such an aide. It aims to provide a quantitative link from fundamental properties of the particles (including their three dimensional geometry) to the dissolution behaviour of granules and even whole tablets. This paper has used X-ray microtomographical structures of natural sugar crystal grains and clusters of the sugar and monosodium glutamate crystals as real structure input for digital simulation, and has compared the three dimensional simulation results with their actual dissolution results, and
demonstrated good agreement between the simulated and actual results. The work demonstrates that digital methods open up routes for more process realistic modellingand simulation – this is disruptive to some current practices and trusted standards.
Further validation case studies are needed, for example, to ascertain in a quantitative manner how much influence digitisation errors have on the predicted dissolution behaviour. Further
developments in these areas can be anticipated. For instance, more sophisticated algorithms needs to be developed to incorporate the effect of natural convection, to deal with disintegration and, maybe, some extent of interaction of the active component with the administration environment. All the development will lead to the ultimate validation using standardised dissolution tests.
There are also two other distinctive virtues of the digital methods. First, it is relatively
straightforward to accommodate inherent complexities of the system (e.g. detailed chemistry of multiple-phases and interacting phases, differential solubilities on crystal faces) and methods to account for disintegration behaviour. For example, for some tablet dissolution features rapid ejection of particles from the mass and these are difficult to model explicitly. However such behaviour observed through laboratory can be recreated within the digital model to emulate these types of transactions based through introducing an augmented reality into the simulation.
6. Acknowledgements
The authors are grateful toProfessor Aibing Yu for the possibility of presenting this work at Particulate Processes in the Pharmaceutical Industry III in the Gold Coast, July 2011 and also acknowledge contributions made by members of the Institute of Particle Science and Engineering at University of Leeds. The support of the UK Engineering and Physical Sciences Research Council (EPSRC), the Nanofactory Initiative (ERDF) and Structure Vision Ltd is also acknowledged.
7. References
1) X. Jia, R. A. Williams, A hybrid mesoscale modelling approach to dissolution of granules and tablets, Chemical Engineering Research and Design. 85(2007) 1027–1038
2) X. Jia and R. A.Williams, Microstructures of tablets and granules to their dissolution behaviour, Dissolution Technologies. 13(2006), 11-19.
3) F. Stepanek, Computer-aided product design Granule Dissolution, Chemical Engineering Research and Design. 82(2004) 1458–1466.
4) M. A. Ansari, F.Stepanek, The effect of granule microstructure on dissolution rate, Powder Technology. 181 (2008) 104–114.
5) Q. Kang, D. Zhang, S. Chen, X. He, Lattice Boltzmann simulation of chemical dissolution in porous media, Physical Review E. 65(2001), 036318
6) T. F. Xu, J. A. Apps, K. Pruess, Numerical simulation of CO2 disposal by mineral trapping in deep aquifers, Appl. Geochemistry 19 (2004) 917–936.
7) P.C. Burns, A.L. Klingensmith, Uranium mineralogy and neptunium mobility, Elements 2 (2006) 351–356.
8) X. Jia, R. A. Williams, A packing algorithm for particles of arbitrary shapes, Powder Technology, 120 (2001), 175-186.
9) X. Jia, M. Gan, R. A. Williams, D. Rhodes, Validation of a digital packing algorithm in predicting powder packing densities. Powder Technology, 174(2007) 10-13.
10) C. Selomulya,T. M. Tran,X. Jia, R. A. Williams, An integrated methodology to evaluate permeability from measured microstructures. AIChE Journal 52(2006) 3394-3400.
12) F. Verhaeghe, S. Arnout, B. Blanpain, P. Wollants, Lattice Boltzmann model for diffusion-controlled dissolution of solid structures in multicomponent liquids. Physical Review E. 72(2005), 036308
13) J. Liu, F. Verhaeghe, M. Guo, B. Blanpain,P. Wollants, In-situ observation of the
dissolution of spherical alumina particles in CaO-Al2O3-SiO2 melts, J. Am. Ceram. Soc. 90(2007), 3818–3824.
14) F. Verhaeghe, J. Liu, M. Guo, S. Arnout, B. Blanpain, P. Wollants, Dissolution and diffusion behavior of Al2O3 in a CaO-Al2O3-SiO2 liquid: an experimental-numerical approach. Appl. Phys. Lett. 91(2007), 124104.
15) X. Li, H. Huang, P. Meakin, A three-dimensional level set simulation of coupled reactive transport and precipitation/dissolution International, Journal of Heat and Mass Transfer. 53 (2010) 2908–2923.
16) R. Moreno-Atanasio, R. A. Williams, X. Jia,Combining X-ray microtomography with computer simulation for analysis of granular and porous materials. Particuology, 8 (2010) 81-99.
17) 92nd edition of the CRC handbook of chemistry and physics, Diffusion coefficient, 2011-2012.
18) R. Hanson, V. Gray, Handbook of Dissolution Testing, 3rd edition (Dissolution Technologies, Inc., Hockessin, Delaware, USA) 2004.
19) S. Lowell, J.E. Shields, M. A. Thomas, M. Thommes, Characterization of Porous Solids and Powders: Surface Area, Pore Size and Density, Kluwer Academic Publishers, 2004. ISBN 1-4020-2302-2.
Caption list
Figure 1: Schematics of mathematical formulation for dissolution.
Figure 2: (a) Optical image of a brown sugar grain; (b) digitalised three dimensional model of the grain using x-ray microtomography, and (c) a cross section of the sugar grain showing its internal structure.
Figure 3: (a) Optical images of a sugar grain dissolving in water at a series of time; (b) Projection images of the same sugar grain as simulated by DigiDiss.
Figure 4: Simulated fractional release profile of a single brown sugar grain in water. Simulation setup was as follows: diffusion coefficient of 6.73x10⁻¹⁰ m2/s, dissolution rate constant 5x10⁻⁴ m/s, virtual sugar concentration at the domain boundaries; 36 µm per pixel resolution. Insets are the sugar concentration map at 60 seconds and 300 seconds.
Figure 5: (a) Optical image of a cluster sample with 5 monsodium glutamate crystals and 3 brown sugar grains fixed in a piece of substrate; (b) the digitised model with a voxel size of 120 µm prepared by using XMT and DigiUtility.
Figure 6: a) Optical images of dissolution process of a particle cluster of sodium monoglutamate crystals and brown sugar particles granule in water; (b) Simulated dissolution process of the cluster structures with diffusion coefficient of 3x10⁻⁹ m2/s for the monosodium glutamate, 8x10⁻¹⁰ m2/s for the sugar, dissolving constant at 6.73x10⁻⁶ m/s for the sodium glutamate 5x10⁻⁴ m/s for the sugar. The model used for the simulation has a voxel size at 120 µm.
Figure 1:
(a) (b) (c)
Figure 2:
.
(a) 1min 3min 5min 7min 9min 11 min
(b) 1min 3min 5min 7min 9min 11 min
Figure 4:
(a) (b)
Figure 5:
0 100 200 300 400 500 600 700
0.0 0.2 0.4 0.6 0.8 1.0
Fr
a
cti
o
n
re
le
a
se
d
[image:17.595.73.465.364.597.2](a) 1 min 2 min 4 min 6 min 8 min
[image:18.595.76.508.69.333.2](b) 1 min 2 min 4 min 6 min 8min
[image:18.595.69.473.220.681.2]Figure 6:
Figure 7:
0 200 400 600 800 1000 1200 1400
0.0 0.2 0.4 0.6 0.8 1.0
Fr
a
cti
o
n
re
le
a
se
d