MUIR
Massey University Institutional Repository
Forsyth, D. (2006). Determiners of accuracy when making an
expected duration estimation: The role of ‘past’ event/task
saliency. (Department of Management and International Business
Research Working Paper Series 2006, no. 7). Auckland, NZ:
Massey University. Department of Management and International
Business.
Massey Author:
Forsyth, Darryl
Research
Working
Paper Series
Department ofManagement and International
Business
2006, no. 7
Darryl Forsyth
Keywords
Determiners of accuracy when making an expected duration estimation: The role of ‘past’ event/task saliency
Time Management Scheduling
Duration Estimation Schematic Memory
Contact Details
Dr Darryl Forsyth
Department of Management & International Business Massey University (Auckland) Private Bag 102 904
Auckland, New Zealand Ph 64 9 414 0800 ex 9135 Email [email protected]
Copyright
ABSTRACT
One of the important ‘skills’ which is associated with effective time management is the
ability to accurately estimate the probable duration of a to-be-scheduled event or task.
The present study explored the effect that presenting a highly salient, similar
to-be-estimated task had on a subsequent task estimate. Participants in this experiment tended
to allocate significantly less time to the completion of a task if they had previously
estimated the expected duration of a similar, shorter task. Conversely, they tended to
allocate significantly more time to the completion of a task if they had previously
estimated the expected duration of a similar but longer task. The results are discussed in
The ability to accurately estimate the probable duration of a to-be-scheduled event or
task is associated with effective time management (Burt & Forsyth, 1999). An ‘expected
duration’ process model developed by Forsyth (2004) suggests that people reach these
estimates by ‘reflecting’ back upon memories of similar tasks. Furthermore the model
suggests that this ‘reflection’ will involve ‘reconstructed’ events or tasks that will tend to be
in the form of schematic event memories rather than reconstructions of a specific event
(Michon, 1998; Schank, 1999). One aspect of this process that is likely to effect the resulting
expected duration estimate is the degree to which this schematic event memory is ‘up-dated’
as a result of relevant experience. The present study explored the effect that presenting a
highly salient, similar to-be-estimated task had on a subsequent task estimate.
A substantial amount of longitudinal and cross-sectional research has demonstrated
importance of effective time management for psychological well-being (e.g., Banks &
Jackson, 1982; Feather, 1990; Hepworth, 1980; Kilpatrick & Trew, 1985; Warr & Payne,
1983). Research has demonstrated that poor time management skills are associated with
negative outcomes such as high levels of stress (e.g., Goldberger & Breznitz, 1982; Macan,
Shahani, Dipboye, & Phillips, 1990; McLaughlin, Cormier, & Cormier, 1988; Schuler, 1979;
Tanner & Atkins, 1990; Wratcher & Jones, 1986), low performance/productivity (e.g.,
Britton & Tesser, 1991; Kleijn, Van der Ploeg, & Topman, 1994; Macan et al., 1990;
Wratcher & Jones, 1986), feelings of purposelessness, neuroticism, hopelessness and
depression (Bond & Feather, 1988; Feather & Bond, 1983), and less effective group and
individual decision making (Benson & Beach, 1996; Kelly, Jackson, & Hutson-Comeaux,
1997).
One of the important ‘skills’ which is associated with effective time management is
the ability to accurately estimate the probable duration of a to-be-scheduled up-coming event
or task (Burt & Forsyth, 1999). In relation to this process Forsyth (2004) has developed a
model of expected duration estimation which suggests that people will attempt to estimate the
expected duration of an upcoming event or task by ‘reflecting’ back upon memories of
similar tasks. The model suggests that this ‘reflection’ will often involve reconstructing
event/s from memory traces (Burt & Kemp, 1994). Additionally, Forsyth (2004) argues that
although these remembered events may be ‘reconstructed’ they will often appear to be a
verisimilar representation (Michon, 1990) of a specific event. Furthermore the model
suggests that reconstructed events will often be in the form of schematic event memories
everyday events are individually encoded they will tend to lose detail and acquire a
“schematic or prototypical character” (Michon, 1998, pp. 207).
It is argued that these schematic event memories may be very useful in making an
expected duration estimation. As Michon (1990) points out, adult humans have “access to a
large repertoire of temporal standards for concrete, everyday, ‘natural’ events, associated
with scenarios (scripts, frames), not only in order to efficiently execute routine activities, but
also in order to explain and communicate” (p. 43). Similarly, Schank (1999) has proposed
that much of human behaviour in everyday situations is guided by scenarios/explicit
representations of remembered situations that are sufficiently close to the prevailing situation
as to serve as a guide to further action. Over the course of a person’s life they build up a
repertoire of useful scenarios (Schank & Abelson, 1977). As each sort of scenario includes
an implicit temporal structure (Michon, 1998) a person who is exposed to a similar task will
be able to cognise whether it is unfolding in a temporally plausible way.
For example, Burt (1993) demonstrated that an event’s degree of typicality is
associated with duration estimation accuracy. Specifically, typicality scores were predictive
of both accuracy and whether the estimate was an under or overestimation. Burt’s study
provides support for the view that “the magnitude and nature of estimation error, under
conditions of substantial retention interval, are related to the typicality of the actual event”
(Burt, 1993, pp. 71). In addition, the findings suggest that the effect of actual event memory
on duration estimation typically is not sufficient to completely remove the effects of
general/typical event duration information.
Research by Yarmey (2000), Burt and Popple (1996), and Burt (1999) address
typicality using the retrospective duration estimation paradigm (un-cued estimations of past
temporal episodes). Yarmey (2000) undertook an interesting field study of the accuracy of
retrospective duration estimates of various invariant (e.g., a computer ‘booting up’) and
variant (e.g., talking to a friend) naturalistic events. One of the useful things about this study
for the present discussion is that it deals with a wide variety of naturalistic events of varying
objective duration (4 seconds to 80 minutes). In line with past research (e.g., Boltz, 1998) he
reported that people were significantly more accurate at estimating the duration of invariant
events than variant ones. However, this study was somewhat different to what people need to
do to estimate expected duration – for example the above study collected duration estimates
within seconds of the events’ completion.
Another relevant aspect of schematic event memory proposed by Burt and Popple
duration estimates. Specifically Burt (1999, pp. 353) suggested “the faster the actions in an
event are perceived to be, the shorter the estimated event duration”. For example, Burt and
Popple (1996) demonstrated that people tend to use their general knowledge concerning the
relationship between the speed of action and its duration. They showed that participants who
were led to believe an event involved running instead of walking provided retrospective
duration estimates which were significantly shorter. Similarly, Burt’s (1999) second
experiment had participants view a 76-second video of a bank robbery before one group was
asked to retrospectively estimate the duration of the video and write a narrative describing it
straight after viewing, while another group were required to return the next day before being
prompted for the same information. One of the main findings of this study was that there was
a large degree of variation between the wording participants used to describe the robbery and
also variability in the estimated duration. However, somewhat surprisingly, there was no
significant difference between the immediate group and the delayed group on either of these
measures. Overall there was a general trend toward overestimating the duration of the
robbery in both groups. The results revealed a significant negative correlation between the
number of action words used and the participants’ estimate of the robbery’s duration – more
action words, shorter duration judgement. Unfortunately the results did not allow for
conclusions to be made as to the relationship between the ‘speed’ (i.e., charged vs. pushed vs.
passed) of the action words used and the duration judgement. It would be expected that there
would have been a significant interaction effect between the ‘speed’ of the words used, the
total number of action words used, and the duration estimation.
Burt (1999) suggested the direction of the causation of this effect is from the
construction of the narrative that describes the event to estimating the events duration. This
interpretation is in line with the view that retrospective duration estimates tend to be based on
reconstructive and constructive processes (Burt, 1992, 1993; Burt & Kemp, 1991).
As far as expected duration estimation is concerned, an interesting set of experiments
that shed light on the effect of semantic event memory was undertaken by Josephs and Hahn
(1995). They suggested that when people are required to estimate expected duration (of
various academic type tasks) they tend to trade accuracy in favour of minimising cognitive
effort. Their series of studies focused on the quality of information the schedulers received.
Overall they found that participants tended to base their estimates on task features that
required the least amount of computational effort to process. The resulting accuracy of such
In their first study Josephs and Hahn (1995) asked students to estimate how long they
would need to complete a written assignment of either four single-spaced pages or seven
double-spaced pages. As predicted students on average allotted significantly more time to the
completion of the seven-page assignment even though it contained fewer words. They
explained these findings in terms of the fact that although pages are less diagnostic than
number of lines they are computationally easier.
In their second study Josephs and Hahn (1995) found students estimated the
completion of significantly fewer anagrams when each anagram was attached to the front
cover of a journal (hence the anagram looked ‘bigger’). They suggested that this was because
the most salient feature of this task was the size of the ‘pile’ of anagrams, and so people
would use this information on which to base their estimate. One interesting issue is that
although they suggest that reducing cognitive effort by relying on surface features of the
to-be-estimated task tends to result in people vastly underestimating required duration, this
study in fact shows the opposite. In both cases participants completed substantially more (in
the order of 2-3 times more) anagrams than they had estimated, in both cases vastly
overestimating the actual duration required to complete each anagram.
Their third study reported a similar conclusion – people place more weight on page
length than more useful, but cognitively taxing, information like font and margin size when
estimating the expected duration of reading. In a similar vein are studies demonstrating that
people are more likely to complete and return a questionnaire if it is formatted onto fewer
pages (see Hornik, 1981).
Although Josephs and Hahn (1995) explain their findings in terms of minimising
cognitive effort, another way to look at it is in terms of typicality of to-be-estimated tasks or
events, whereby more typical ones were estimated with greater accuracy. For example, when
asked to estimate how long it would take you to read the paperback novel in front of you,
your accuracy would be dependant on how typical the book’s attributes were – its font type
and size, its grammatical complexity, its paper thickness, the size of its margins. In the first
study single-spacing may have been more typical of what students were required to do.
Likewise, it is a very atypical situation to have to complete anagrams attached to the cover of
journals.
In summary, it is argued that schematic event durations appear to be stored in memory
as part of general event memory and that this schematic duration is used as part of the
event duration is determined by the amount of experience/frequency of exposure to the
particular type of event.
Inherent in this view is that people will vary in their ability to perceive and judge
typicality (the level of congruence with the relevant schematic event memory) of
to-be-estimated tasks. As mentioned, Burt (1993) demonstrated that an event’s degree of typicality
is associated with duration estimation accuracy. Specifically, his study found that events that
were atypically long tended to be underestimated, whereas events that were atypically short
were overestimated. It appears that specific event duration estimation information in general
is not sufficient to completely remove the effects of general/typical event duration
information. Overall, people appear to underestimate the degree of atypicality.
One aspect of typically that has not been addressed is the number of presentations
required to ‘build’ a schematic event memory, and the effect of saliency (in the form of
recency) in updating a schematic event memory. Most research in this area has looked at
typicality, which has been built up over many years of experience and over numerous
presentations. For example, the relationship between the speed of action and duration (Burt
& Popple, 1996), between the number of action words used and the participants’ estimate of
the robberies (Burt, 1999), and standard formatting of printed material (Josephs & Hahn,
1995).
However, given the fact that people appear to adopt estimation strategies that
minimise cognitive effort (Josephs & Hahn, 1995) it may be the case that saliency of past
similar experiences may be a crucial factor in determining typicality. More specifically, it
may be the case that a single (recent) exposure to a similar expected estimation experience
may alter/effect a future expected duration estimation by ‘up-dating’ the schematic event
memory (Burt, 1993).
It is argued that a high degree of saliency (in the present case, specifically in the form
of recency) will have a similar effect to that of repetition in the formation of a schematic
event memory and associated duration. Further, it is argued that a person need not have
experienced the specific task or its ‘duration’ (i.e., actually completed the task or experienced
the event) in order to update schematic event memory, in that the person will most likely
reconstruct a type of verisimilar representation of what they believe the task entails. To test
these ideas the present experiment required participants to either estimate the expected
duration of a short ‘version’ of a task followed by a longer version or vice versa. Based on
The order of presentation of task, which only vary with respect to scale (e.g., 10 pages of proofreading as opposed to five pages of proofreading), will have a significant effect on the time participants allocate to the tasks’ completion. Specifically, participants will allocate significantly less time to the completion of a task if they have previously estimated the expected duration of a shorter similar task. Conversely, they will allocate significantly more time to the completion of a task if they have previously estimated the expected duration of a similar but longer task.
METHOD
Experiment design overview
The experiment consisted of two between-group conditions. In condition one,
participants were required to estimate the duration of four tasks which were presented in the
following order – short version of balance task, long version of balance task, short version of
proofreading task, long version of proofreading task. In condition two participants were also
required to estimate the duration of the same four tasks, however they where presented in a
different order from condition one – long version of balance task, short version of balance
task, long version of proofreading task, short version of proofreading task.
Participants
Eighty people, with a mean age of 20.8 years, undertaking a stage one psychology course
at the University of Canterbury, participated in this experiment. Forty were randomly
assigned to each of the two conditions. The first condition contained 12 males and 28
females, while the second condition contained 10 males and 30 females. The University of
Canterbury human ethics committee approved the experiment.
As mentioned above each of the two conditions were made up of the same two versions
of a balance and proofreading task. As shown below the two versions of each task differed
only in magnitude. The two conditions varied in respect to the presentation order of the short
and long versions of each of the two types of tasks – in condition one the short version of
each task was presented before the long version of the task. In contrast, in condition two the
long version of each task was presented before the short version of each task. The four tasks
are listed below in the form in which the participants received them (task headings were
omitted in experimental materials).
Balance task short version:
Five ‘bills’ (e.g., power bill, phone bill) are provided, along with an account balance sheet. Your task is to enter the ‘billed amount’ in the debt column and subtract the amount from the balance, creating a new balance after each subtraction (pen and paper subtraction - no calculator).
Balance task long version:
Twenty ‘bills’ (e.g., power bill, phone bill) are provided, along with an account balance sheet. Your task is to enter the ‘billed amount’ in the debt column and subtract the amount from the balance, creating a new balance after each subtraction (pen and paper subtraction - no calculator).
Proofreading task short version:
A three-page document typed (double-spaced) on A4 paper is provided. Your task is to proofread it for spelling mistakes. Circle each spelling mistake that you find.
Proofreading task long version:
A 13-page document typed (double spaced) on A4 paper is provided. Your task is to proofread it for spelling mistakes. Circle each spelling mistake that you find.
A space was provided below each of the four tasks for the participant to enter their
expected duration estimate. No temporal scale prompts were provided – no hour, minute, or
Procedure
Potential participants from stage one psychology laboratories were invited to take part in
a study requiring them to estimate how long they thought it might take them to complete four
office-type tasks. Interested participants were randomly assigned to one of the two
conditions outlined above. Participants were informed that they were to assume they worked
in an office-type environment and that they were required as part of their job to complete four
tasks. They were also asked to assume that they had the equipment/resources to complete the
tasks. Each participant received a self-explanatory questionnaire outlining the requirement to
estimate how long they thought it would take to complete each of the four tasks. After each
written description of a task, a space was provided in which to enter their estimation.
RESULTS
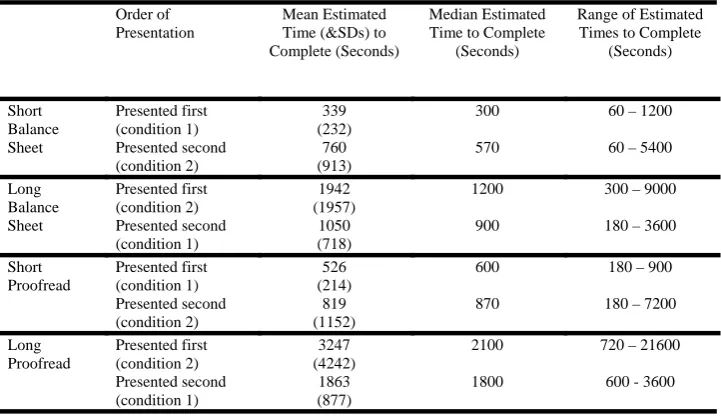
The first, second and third numerical columns of Table 1 show the average, the
median, and the range of expected duration estimates for the four tasks for each of the two
conditions.
_______________________________________________________
Insert Table 1 about here
_______________________________________________________
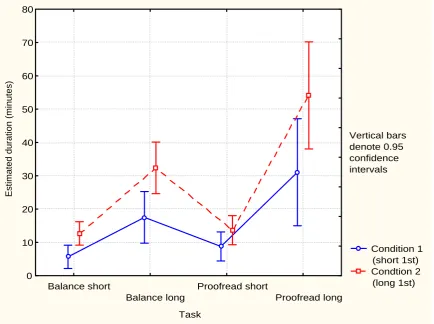
A 2x4 mixed design ANOVA, with the order of presentation (either long tasks first or
short tasks first) being the between subject variable and the duration estimates for the four
tasks being the within subject variables, was conducted to see whether these difference were
significant (Figure 1 depicts the relationship between these variables). The ANOVA revealed
a significant main effect for order of presentation (F (1,78) = 6.61, p=.012) and for the
different tasks (F (3,234) = 34.66, p=.000), however the interaction between these two did not
reach significance (F (3,234) = 2.50, p=.06). More specifically, planned comparisons
revealed significant differences between whether the short task was presented first or second
for three of the four tasks – short balance (F (1,78) = 8.00, p=.005), long balance (F (1,78) =
7.32, p=.008), and long proofread (F (1,78) = 4.08, p=.046) - short proofread (F (1,78) =
2.48, p=.11) did not reach significance.
_______________________________________________________
Insert Figure 1 about here
_______________________________________________________
Overall these results suggest that more time is allotted to relatively short tasks when
they are presented after a longer similar task. Conversely, it appears that less time is
allocated to the completion of a relatively long task if it is preceded by a shorter task.
Strengthening this view, the pattern is consistent across both types of tasks – balance and
DISCUSSION
This study demonstrated that presenting a highly salient similar to-be-estimated task
can affect a subsequent task estimate. Overall there was support for the hypothesis, in that
participants tended to allocate significantly less time to the completion of a task if they had
previously estimated the expected duration of a shorter similar task. Conversely, they tended
to allocate significantly more time to the completion of a task if they had previously
estimated the expected duration of a similar but longer task.
These results could be interpreted as suggesting that schematic event memories can
potentially be ‘adjusted’ with a single presentation of a similar task. Although further
research is required one can speculate that the ‘power’ of this single presentation lies in its
saliency, in that if participants were required to estimate the completion of the similar task the
day before, rather than immediately before, it would not have had such a large effect (if any)
on the estimation. Additionally, following on with a ‘change in schematic memory’ type
interpretation of the experimental results, and in line with the reconstructive process
involving a verisimilar representation advocated in the introduction, the ‘up-dating’ of
schematic event memories appear to occur even when the person has not actually
‘experienced’ the event firsthand.
Although a lot more research is needed to fully understand the role schematic event
memory plays in expected duration estimation, it is interesting to speculate whether it may be
feasible to develop an algorithm for scheduling software that could ‘measure’ the degree of
task typicality and adjust the estimate accordingly. Such an algorithm would need to
effectively classify tasks (both type and temporal magnitude) and ‘predict’ individual
response biases in relation to the tasks’ typicality (probably based on a combination of the
number of exposures and relative saliency of a similar ‘class’ of task). The measure of
typicality would be developed over time by recording and analysing the effectiveness of
previous scheduling. To be truly effective it would also have to take into account the
person’s awareness of the degree of typicality in relation to their schematic event memory for
that ‘type’ of task (i.e. is the person already adjusting the estimate appropriately?). Again,
this would need to be achieved by recording and analysing the effectiveness of previous
scheduling.
Additionally, one of the interesting and largely unexplained processes evident in most
able to choose and adjust the temporal ‘scale’ of their expected duration estimation (Burt &
Forsyth, 2001; Forsyth, 1998, 2004). Given the difficulty of making expected duration
estimates it is somewhat surprising estimators are as effective as they are at choosing an
appropriate scale. It is argued that this choice involves, along with other task and estimator
variables (such as experience at making duration estimates and temporal bounding effects),
an analysis of the task typicality in relation to the person’s schematic event memory for that
type of task. Similarly, the pattern of results may partly be a consequence of people choosing
their scale values based on the first task. Therefore, if a short task is first then people will use
a smaller scale/prototypical temporal value, meaning they will tend to allocate less time for
the following longer task, and vice versa for long tasks that are first.
In conclusion this experiment has demonstrated that the scheduling of an earlier
similar task can affect the amount of time allocated to a task. It has been suggested that this
effect could be due to an updating of schematic event memory, in that the process of
estimating the duration of the first task potentially affects memory in a similar way to
REFERENCES
Banks, M. H., & Jackson, P. R. (1982). Unemployment and risk of minor psychiatric disorder
in young people: Cross-sectional and longitudinal evidence. Psychological Medicine, 12, 789-798.
Benson, L., & Beach, L. R. (1996). The effects of time constraints on the prechoice screening
of decision options. Organizational Behavior and Human Decision Processes, 67(2), 222-228.
Boltz, M. G. (1998). Task predictability and remembred duration. Perception & Psychophysics, 60(5), 768-784.
Bond, M. J., & Feather, N. T. (1988). Some correlates of structure and purpose in use of time.
Journal of Personality and Social Psychology, 55(2), 321-329.
Britton, B. K., & Tesser, A. (1991). Effects of time-management practices on college grades.
Journal of Educational Psychology, 83(3), 405-410.
Burt, C. D. B. (1992). Reconstruction of the duration of autobiographical events. Memory and Cognition, 20(2), 124-132.
Burt, C. D. B. (1993). The effect of actual event duration and event memory on the
reconstruction of duration information. Applied Cognitive Psychology, 7, 63-73. Burt, C. D. B. (1999). Categorisation of action speed and estimated event duration. Memory,
7(3), 345-355.
Burt, C. D. B., & Forsyth, D. K. (1999). Designing Materials for Efficient Time
Management: Segmentation and Planning Space. Cognitive Technology, 4(1), 11-18. Burt, C. D. B., & Forsyth, D. K. (2001). Relationships between behavior, family support and
perceived time management ability. New Zealand Journal of Psychology, 30(1), 4-8. Burt, C. D. B., & Kemp, S. (1991). Retrospective duration estimation of public events.
Memory & Cognition, 19(3), 252-262.
Burt, C. D. B., & Kemp, S. (1994). Construction of activity duration and time management
potential. Applied Cognitive Psychology, 8(2), 155-168.
Burt, C. D. B., & Popple, J. S. (1996). Effects of implied action speed on estimation of event
duration. Applied Cognitive Psychology, 10, 53-63.
Feather, N. (1990). The psychological impact of unemployment. New York: Springer.
Feather, N., & Bond, M. (1983). Time structure and purposeful activity among employed and
Forsyth, D. K. (1998). Validation of the OPQ as a time management instrument. Unpublished Masters, University of Canterbury, Christchurch.
Forsyth, D. K. (2004). An investigation into expected duration estimation as used as part of the time management process. Unpublished PhD, University of Canterbury,
Christchurch.
Goldberger, L., & Breznitz, S. (1982). Handbook of stress: Theoretical and clinical aspects. New York: Free Press.
Hepworth, S. J. (1980). Moderating factors of the psychological impact of unemployment.
Journal of Occupational Psychology, 53, 139-146.
Hornik, J. (1981). Time cue and time perception effect on response to mail survey. Journal of Marketing Research, 18, 243-248.
Josephs, R. A., & Hahn, E. D. (1995). Bias and accuracy in estimates of task duration.
Organizational Behavior and Human Decision Processes, 61(2), 202-213.
Kelly, J. R., Jackson, J. W., & Hutson-Comeaux, S. L. (1997). The effects of time pressure
and task differences on influence modes and accuracy in decision-making groups.
Personality and Social Psychology Bulletin, 23(1), 10-22.
Kilpatrick, R., & Trew, K. (1985). Life-styles and psychological well-being among
unemployed men in Northern Ireland. Journal of Occupational Psychology, 58, 207-216.
Kleijn, W. C., Van der Ploeg, H. M., & Topman, R. M. (1994). Cognition, study habits, test
anxiety, and academic performance. Psychological Reports, 75, 1219-1226.
Macan, T. H., Shahani, C., Dipboye, R. L., & Phillips, A. P. (1990). College students' time
management: Correlations with academic performance and stress. Journal of Educational Psychology, 82(4), 760-768.
McLaughlin, M., Cormier, L. S., & Cormier, W. H. (1988). Relation between coping
strategies and distress, stress, and marital adjustment of multiple-role women. Journal of Counselling Psychology, 35(2), 187-193.
Michon, J. A. (1990). Implicit and explicit representations of time. In R. A. Block (Ed.),
Cognitive Models of Psychological Time (pp. 37-58). New Jersey: Lawrence Erlbaum Associates, Inc.
Schank, R. C., & Abelson, R. P. (1977). Scripts, Plans, Goals, and Understanding: An Inquiry into Human Knowledge Structures. Hillsdale, NJ: Lawrence Erlbaum Associates.
Schuler, R. S. (1979). Managing stress means managing time. Personnel Journal, 58, 851-854.
Tanner, C. K., & Atkins, T. T. (1990). Planning for stress reduction in the High School
Principalship. High School Journal, 74(1), 22-37.
Warr, P., & Payne, R. (1983). Social class and reported changes in behaviour after job loss.
Journal of Applied Social Psychology, 13(3), 206-222.
Wratcher, M. A., & Jones, R. D. (1986). A time management workshop for adult workers.
Journal of College Student Personnel, 27, 566-567.
Yarmey, A. D. (2000). Retrospective duration estimations for variant and invariant events in
Table 1. The effect of presentation order of tasks that vary in magnitude on expected duration
estimation
Order of
Presentation
Mean Estimated Time (&SDs) to Complete (Seconds)
Median Estimated Time to Complete
(Seconds)
Range of Estimated Times to Complete
(Seconds)
Presented first (condition 1)
339 (232)
300 60 – 1200 Short
Balance
Sheet Presented second (condition 2)
760 (913)
570 60 – 5400
Presented first (condition 2)
1942 (1957)
1200 300 – 9000 Long
Balance
Sheet Presented second (condition 1)
1050 (718)
900 180 – 3600
Presented first (condition 1)
526 (214)
600 180 – 900 Short Proofread Presented second (condition 2) 819 (1152)
870 180 – 7200
Presented first (condition 2)
3247 (4242)
2100 720 – 21600 Long Proofread Presented second (condition 1) 1863 (877)
Figure 1. A graphical representation of the relationship between the two conditions in
Experiment 1 and the estimated duration of the four tasks.
Vertical bars denote 0.95 confidence intervals
Condition 1 (short 1st)
Condtion 2 (long 1st) Balance short
Balance long
Proofread short
Proofread long Task
0 10 20 30 40 50 60 70 80
MASSEY UNIVERSITY
MASSEY RESEARCH ONLINE http://mro.massey.ac.nz/
Massey Documents by Type Working and Discussion Papers
Determiners of accuracy when making an
expected duration estimation: The role of
‘past' event/task saliency
Forsyth, Darryl
2006http://hdl.handle.net/10179/636