Contents lists available atScienceDirect
Economic Modelling
j o u r n a l h o m e p a g e : h t t p s : / / w w w . j o u r n a l s . e l s e v i e r . c o m / e c o n o m i c - m o d e l l i n g
Systemic risk in the US: Interconnectedness as a circuit breaker
Mardi Dungey
a,b,*, Matteo Luciani
c, David Veredas
d,eaSchool of Economics and Finance, University of Tasmania, Australia bCAMA ANU, Australia
cBoard of Governors of the Federal Reserve System, Washington D.C., USA dVlerick Business School, Brussels, Belgium
eGhent University, Ghent, Belgium
A R T I C L E I N F O
JEL classification:
C32 C51 C52 G10
Keywords:
Historical decomposition DY spillover
Granger causality Networks
A B S T R A C T
We measure systemic risk via the interconnections between the risks facing both financial and real economy firms. SIFIs are ranked by building on the Google PageRank algorithm for finding closest connections. For a panel of over 500 US firms over 2003–2011 we find evidence that intervention programs (such as TARP) act as circuit breakers in crisis propagation. The curve formed by the plot of firm average systemic risk against its variability clearly separates financial firms into three groups: (i) the consistently systemically risky (ii) those displaying the potential to become risky and (iii) those of little concern for macro-prudential regulators.
1. Introduction
The interconnections between the financial sector and the real econ-omy mean that systemic risk can significantly affect employment and output, as strikingly illustrated by the Great Depression of the 1930s, and the weak recovery of the US economy following the collapse of Lehman Brothers and the rescue of AIG in September 2008. Surpris-ingly, very few empirical models of systemic risk explore the inter-actions between financial and non-financial firms. The empirical lit-erature focuses on systemic risk within the financial sector itself, and in particular within the banking sector, sometimes with controls for macroeconomic or industry environment, as inKapadia et al. (2012) andSchwaab et al. (2011), and sometimes with reference to sovereign debt, as inKalbaskaa and Gatkowskib (2012). A survey of the extant empirical approaches is provided inBisias et al. (2012).
We provide a framework for a systemic risk index based on the inter-connectedness of firms from all sectors of the economy. We fill the gap in the empirical literature by explicitly recognizing the role of the real economy in initiating, amplifying and dampening systemic risk in the financial sector. Although theoretical frameworks such asAcemoglu et al. (2015)place the source shocks for systemic risk with the investments
* Corresponding author. School of Economics and Finance, University of Tasmania, Private Bag 85, Hobart, Tasmania, 7001, Australia.
E-mail addresses:[email protected](M. Dungey),[email protected](M. Luciani),[email protected](D. Veredas).
of banks in real economy firms the empirical literature does not reflect this. Connectedness is fundamental to systemic risk as it lies at the heart of the transmission of shocks around the economy, and is implicit in many of the alternative definitions of systemic risk, such as the role of common shocks, firm characteristics, networks, and the impediment to the functioning of the financial markets; see for exampleAllen et al. (2012), Huang et al. (2012), Drehmann and Tarashev (2011), Billio et al. (2012), Gai and Kapadia (2010), andTarashev et al. (2010).
Measuring interconnectedness is empirically challenging in these relatively large systems. Recent advances byDiebold and Yilmaz (2014) and Langfield et al. (2013) provide options for measuring both the degree and the direction of the connections in large systems. Our approach relies firstly on understanding systemic risk as interconnec-tions in a system of time varying risk shocks, and secondly on exploit-ing the technology of interconnectedness algorithms, such as typified by Google search engines. In this way we produce not only an over-all dynamic index of systemic risk, denoted the general systemic (GS) index, but also a means of obtaining an up-to-date ranking, known as the systemic risk (SR) ranking.
https://doi.org/10.1016/j.econmod.2017.10.004
Received 18 September 2017; Accepted 4 October 2017 Available online 3 November 2017
Our ranking of individual firms in the economy captures both the cross-sectional and time dimensions of systemic risk; see also Borio (2003)and 2011. In the taxonomy ofBisias et al. (2012)this relates to cross-sectional measures examining co-dependence; including the expected capital loss or capital shortfall approach ofAcharya et al. (2010), Moore and Zhou (2012), andBrownlees and Engle (2017). It also directly connects with the CoVar analysis ofAdrian and Brun-nemeier (2016), with an additional term relating correlation and volatility; seeArcharya et al. (2012)andBenoit et al. (2013)who derive these measures in a common framework.van de Leur et al. (2017) recently compared our ranking system with that of simple pairwise correlations and confirmed that there is an extra degree of informa-tion available in our approach over methods such asSRISK, CoVAR and Marginal Expected Shortfall (seeAcharya et al. (2010), Adrian and Brunnemeier (2016), Brownlees and Engle (2017)).
We examine the connections between shocks in risks over 500 US companies drawn from the S&P500 index for the period 2003–2011. The shocks to each company are computed from daily realized volatil-ities which are calculated from high frequency market trading data. Our focus on volatility as the source of risk shocks and the use of high frequency data is consistent with the approach ofDiebold and Yilmaz (2014)who consider a system of 13 US financial institutions with daily realized volatilities; see alsoHuang et al. (2009). AsDiebold and Yilmaz (2014)emphasize, realized volatility measures have the advantages of representing changes in market fear, and provide an indicator which increases with crisis conditions.1
The important advantages of using market data are their timeliness and extensive coverage of a wide variety of firms in the economy. They particularly facilitate frequent updating of our proposedGSindex for the financial sector and theSRranking for each firm increasing our ability to monitor risk in the financial sector. Alternative approaches include CDS data as inGiglio (2011), Markose et al. (2012), Nijskens and Wagner (2011), although scope is more limited and liquidity can be problematic;CPSS and IOSCO (2013). Interbank lending exposure data such as used inLangfield et al. (2013)and interbank money mar-ket trading as inGiratis et al. (2016)are difficult to obtain and do not venture beyond the banking system itself. Other information such as the firm-specific metrics calculated by theBasel Committee on Bank-ing Supervision (2011, 2013)to identify global systemically important banks are updated infrequently based on annual reports. Table 5 in Bisias et al. (2012)overviews the data inputs for 31 different systemic risk measures, emphasizing the wide range of macro and financial mar-ket data in use, and the difficulties of accessing commercially sensitive and private information.
Our empirical investigation highlights three main results. First, the index of systemic risk GSshows a discernible increase in the years leading up to September 2008. The index peaks in the lead-up to the Lehman Brothers bankruptcy and remains high in the following week with the accompanying uncertainty about potential rescue of other major banks and AIG. The index of systemic risk drops abruptly after the AIG rescue and the announcement and ratification of the TARP pro-gram. It increases again in April 2010 signaling the spillover effects of the European sovereign debt crisis.
Second, we compare ourGSindex with the index ofBrownlees and Engle (2017), which is based on potential capital shortfall. Both mea-sures indicated growing systemic risk in the lead up to September 2008. However, following the policy intervention of TARP
interconnected-1Earlier versions of our measure also contained three firm characteristics: leverage,
liquidity and size, each which has been associated with increased probability of identi-fying a systemically risky firm; seeMoore and Zhou (2012), andBrownlees and Engle (2017)However, we found that these had no meaningful effect on the rankings of firms using this approach, and served only to add complexity in determining the weights each characteristic should take.
ness risk falls, but systemic risk measured by capital shortfall does not, meaning that policies of this nature can act as a circuit breaker in agi-tating the crisis effects via the real economy; see also evidence inKing (2011).
Third, a plot of the average systemic risk against its variability (for each firm) effectively separates three groups of financial firms and high-lights two areas of considerable regulatory interest. The first consists of firms which are consistently ranked amongst the most risky in the economy and rarely move outside of this range – including JP Mor-gan, Wells Fargo, Bank of America and Lehman (before its demise). The second category of interest is firms with an average systemic rank-ing somewhere in the middle of our sample but with high variabil-ity, including AIG, KeyCorp, and Regions Financial Corp in our sam-ple. These are firms which on average do not seem to be a source of concern, but which have the capacity to quickly become a prob-lem. Financial firms are predominantly found in these two groups, providing strong evidence of the important role that macro pruden-tial regulation may play in ensuring financial and economic stability. The final group is firms which are consistently display little systemic risk.
The paper proceeds as follows: Section2explains our construction of theSRranking and theGSsystemic index of the financial sector as a whole. Results are discussed in Section3. We analyze the systemic risk index for the financial sector, and we compare it with the systemic risk index based on capital shortfall ofBrownlees and Engle (2017). We then move to the ranking of individual firms in Section4and show how the plot of the average versus standard deviation of our systemic ranking for individual firms effectively contributes to the discussion on macro prudential regulation by identifying groups of firms of interest to regulatory authorities. Section6concludes.
2. Methodology
We use an enhanced and adapted version of the eigenvector cen-trality measures often used in network analysis, in particular PageR-ank of Google.2 In a nutshell, we consider a network of financial and non-financial firms. Each firm is endowed with a level of risk, reflect-ing a potential for default. In line with previous literature (Acemoglu et al., 2015, and references therein), we consider the shocks in these risks. The connections between the firms are represented by the corre-lations between the shocks. A firm is systemically important if its shock is connected to many other financial and non-financial shocks, and if its strongest linkages are with other companies that are also systemically important.
Let N be the number of firms in the system; both financial and non financial. We denote bySkt the systemic importance, or central-ity, of firmkat timet. It depends on the systemic importance of its peers:
Skt= N
∑
j=1
Sjtckjt. (1)
The time varyingckjtrepresents the transmission channel between com-panieskandjat timet. The shocks in risk are computed by filtering the daily realized volatilities with ARFIMA models (as will be explained in Section3). The dynamics of the network are given by the strength of the connections, which is captured by the correlations between shocks in risk, denoted by𝜌:
ckjt=
|𝜌kjt| ∑
i∈jt|𝜌ijt|
. (2)
The shocks in risk are computed by filtering the daily realized volatilites with ARFIMA models (see Section3for more details).
The system of systemic importances can be written in matrix form as𝐒t=𝐂t⋅𝐒t. The matrix 𝐂t plays the role of the hyperlink matrix in network design, where elementijis non-zero when there is a link from nodejto nodei(where nodes in this case are individual firms). Every column of the hyperlink matrix sums to one – as long as that firm is connected to at least one other firm in the system. The solution is the eigenvector associated with the largest eigenvalue of𝐂t, which by construction is one.3
One of the features of the build-up of the financial crisis was the increase in system-wide risks, which is captured by the average sys-temic importance of the financial sector. Indeed, as the strength of the transmission channels increases, the network becomes more dense, which translates into an increase of the systemic importances. Letn
be the number of financial firms in our system and, without loss of generality, let us assume that the financial firms are order first so that firmk=1,…,nis a financial firm, and firmk=n+1,…,Nis a non-financial firm. Then, the systemic risk index of the non-financial sector, denotedGSt, equals
GSt= n
∑
k=1
Skt
n . (3)
Finally, our ranking metric –the Systemic Risk(SR)ranking– is
SRt=rank(𝐒t). (4)
The construction of the system also allows us to construct subsector indices; St is a matrix of systemic risks of both financial and non-financial firms. To illustrate the influence of the linkages between the insurance sector and the real economy we construct a financial (sub–)sector index, denotedGS̃t, which uses only the set of firms in the financial sector as the base for calculating the measures, i.e. the systemic importance of firmkat timetas it is defined in (1) is replaced bỹSkt=∑nj=1̃Sjtckjtwhich only contains information about the connec-tions between financials.
The methodology we propose is straightforward and quick to calcu-late with no need for optimizations, and it takes into account linkages between the financial sector and the real economy. This apparent sim-plicity belies its demonstrated effectiveness; see the analysis invan de Leur et al. (2017).
2.1. Constructing confidence bands
There exist a number of possible avenues to generate confidence bands, anda prioriit is difficult to discriminate between them. A first possibility is to bootstrap the risks shocks, and then use the boot-strapped shocks to generate bootstrap realized volatilities. Once the bootstrapped volatilities are generate we can repeat the whole proce-dure of calculating the systemic risk index.
A second more tractable possibility consists of bootstrapping the risks shock, and use the bootstrapped shocks to compute directly the correlation coefficients𝜌kjtin Equation(2). Finally, a third possibility is to skip the bootstrap, and to simulate at each drawdthe correla-tion coefficients. For computacorrela-tional tractability we implement this third avenue (noting that this system is relatively large with over 500 firms involved).
To simulate the correlation coefficients we exploit the approxi-mate distribution of the Fisher transform of the correlation coefficient. Namely, let̂𝜌kjt be the correlation coefficient between the shocks of
3The transmission matrix𝐂thas zeros in the main diagonal, since a firm does not
transmit risk to itself.
assetk, and the shocks of assetj, estimated on the sample ending at timet; and let
̂zkjt=1Tlog
(
1+̂𝜌kjt 1−̂𝜌kjt
)
be the Fisher transform of ̂𝜌kjt, which is approximately normal with mean̂zkjtand standard error √T1−3. Then at each drawdwe simulate
zd kjt∼
(
̂
zkjt,T1−3), and we apply the inverse Fisher transform to get 𝜌d
kjt, namely4:
𝜌d kjt=
exp(2zdkjt)−1
exp(2zd kjt
)
+1.
At each draw the algorithm works as follows: 𝜌dkjt is generated as explained above, (ii)ckjt is computed as in (2), (iii)𝐒dt is computed as the eigenvector associated to the largest eigenvalue of𝐂d
t, and (iv) theGSd
t index and the rankingSRdt are computed using (3) and (4). For each window this procedure is repeated 500 times, which gives a distribution for the index of systemic importance, and the ranking.
A crucial issue when simulating correlation coefficients is how to treat those entries that are not statistically different from zero. There exists a large statistical literature (seeBickel and Levina, 2008; Fan et al., 2013; Lam and Fan, 2009; among others) that has studied how to estimate large covariance matrices, and the proposed estimators always include some thresholding technique, which in our case is the testing procedure. Some of these thresholding techniques have the so-called “oracle property”, meaning that they consistently set to zero those cor-relation coefficients that are indeed zero. When a given thresholding technique has the oracle property, then the correct approach is not to simulate those entries that are cut out by the threshold. On the basis of this, in our simulations we set𝜌dkjt=0 if ̂𝜌kjtis not statistically signifi-cant, and when̂𝜌kjt≠0, we simulate𝜌d
kjtas described above.
In summary, our confidence bands measure uncertainty on the strength of the connections, not uncertainty on which connections really exist. Thus, the procedure we adopt is an approximation. The issue of estimating large covariance matrices, and of constructing the relative confidence bands, is a focus of current attention in the statisti-cal literature and it is outside the scope of this article.
3. The great financial crisis, and beyond
Results are based on a newly compiled high frequency data set on high frequency returns in the component stocks from the S&P500 index. The dataset is composed of 502 time series, from January 2, 2003 to December 30, 2011, for a total of 2262 trading days. For each firm in the network, the shocks are calculated as the unexpected daily realized volatilities, i.e. the difference between the estimated realized volatility and its expectation. Our measures of the expected realized volatilities are computed with ARFIMA models,5 while the realized volatilities are estimated simply by summing the squared intraday returns over the day.6 Our choice of realized volatilities rather than returns as the items of interest represents the generally greater interest in volatility transmission as a measure of shocks or uncertainty during periods of stress.
4For details on the Fisher transformation seeStuart and Ord (1994)volume 1. 5This choice is motivated byAndersen et al. (2001, 2003)andLuciani and Veredas (2011). They show that the ARFIMA(1,d,0) is an accurate representation of the long-memory stylized fact of realized volatility.
6The details on the intraday returns dataset and on how we compute the realized
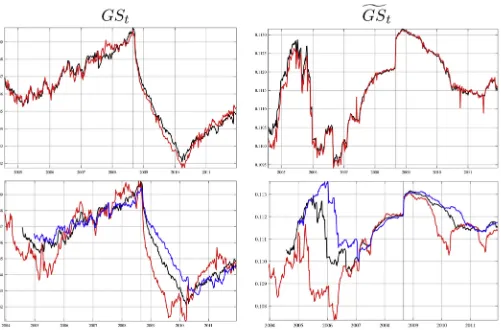
Fig. 1.Systemic risk index for the US economy.
The time-varying analysis is computed with a rolling window of 400 days (roughly 1.5 years). The first window starts in January 2003 and ends in August 2004, meaning that the results cover from August 2004 onwards. Every time the window is rolled, the shocks and the correla-tions between them are computed, and each correlation coefficient is tested against the null𝜌jkt=0. The test used exploits the approximate distribution of the Fisher transform of the correlation coefficients (see for exampleStuart and Ord, 1994). This procedure is repeated once a week on the last day of the week (meaning on Friday unless the market was closed).
Interpretation of systemic risk index movements has the advantage of being relatively straightforward. An increase in the index occurs when firms behave similarly, so an increase inGS̃tindicates when finan-cial firms are commonly experiencing increased unexpected volatility. This situation is akin to what is represented in most systemic risk indices, where focus is on the financial sector alone. However, GS̃t also takes into account how indirect linkages with non-financial firms affects these relationships. On the other hand, increases inGSindicate situations when both financial and non-financial firms are moving in the same direction. That is, shocks in volatilities move in the same way across a wide variety of sectors. This is potentially the most sys-temically threatening outcome for an economy, as it is consistent with increased uncertainty or risk taking across a wide range of industries. Key to this insight is that it does not matter whether firms are mak-ing profits or losses as the system will be exposed to increased risk when companies move in a similar direction due to a lack of diver-sification. When indices for sectors and/or companies diverge, this provides evidence of possible diversification benefits available in the market.
The plot of theGStindex (3) is shown in blue inFig. 1. The figure clearly reaches its peak on the day deemed most risky in the sample – which in this case is September 11, 2008. It shows a general increase in systemic risk evident over the pre-crisis sample, and a rapid decline thereafter.
The financial sector systemic riskGS̃tis shown in red inFig. 1, and is more complex than the overall index. Five sub-periods are clearly evident. Period I up until early 2006 presents a time of plenty - there
is a general buoyancy in the markets and good profits are common. However, in 2006, in line with the pause (and subsequent decline) in the quantity of housing market lending some banks begin to restrict credit. The economy is still experiencing good growth, but borrowing is a little more restricted - this period is evident in 2006–2007. In the period from 2007 until the advent of the crisis is the period we denote the credit risk transfer period. The banks have reduced their lending for housing, and a number of financial firms (such as the Bear-Stearns hedge fund) begin to feel the pinch. There is a collapse in the prices and issuance of Asset backed securities, evident in the ABX indices; see Dungey et al. (2013).
The crisis is associated with a peak of tensions for the whole econ-omy but less so for the financial sector itself (due to the offload-ing of the risky exposures via credit risk transfer). Ultimately the bankruptcy of Lehman Bros followed a week of growing stress in the financial system which included the Federal takeover of Fannie Mae and Freddie Mac and a period of intense speculation as to whether regulatory intervention would occur to save Lehman. This is evident in the rapid increase of the GS̃t index at the peak of the crisis in September 2008. Tensions remained very high in the period until September 23, 2008, following the bailout of AIG (September 16); this period has been pinpointed as the most risky in at least 25 years in 2011.
From September 23, 2008 our index shows that the systemic risk in the financial sector began to decline. This is Period IV in our analysis, where the fall in systemic risk is consistent with adjustment of expecta-tions concerning the ongoing effects of the crisis. At this time Congress was debating the extent of the proposed $US700 billion bailout fund-ing first mooted by US Treasury Secretary Paulson on September 19. The index for systemic riskGSfell sharply with the rescue of AIG and the announcement of TARP. However, the fall in the index focused only on financial firms,GS̃t, took longer to decline, consistent with the problems noted in the rest of the literature in the banking sec-tor – as these programs did not address the capitalisation problems in the banks. The period where both indices are declining is our Period IV.
InFig. 1we compare theGSindex with the monthlySRISKindex of Brownlees and Engle (2017). The index ofBrownlees and Engle (2017) measures risk as potential capital shortfall in the system, which is quite different from our measure of interconnectedness. However, the two measures are highly complementary. One gives information about the interconnected nature of the economy, and the other gives informa-tion about the capacity of the economy to absorb a financially trau-matic shock. Immediately after September 2008 the drop in intercon-nectedness represents the brake applied by policy interventions to the downward spiral between financial and non-financial firms, whereas the continued high level ofSRISKandGS̃tcaptures the continued prob-lems with recapitalising the banks. When bothGSandSRISKare ris-ing the danger from a systemic event is high as it is likely to both spread widely and be highly disruptive to the capitalisation of the economy.
Given that we know that the financial firms are behaving more sim-ilarly (fromGS̃t) we infer that the diversity evident fromGSoccurs because there has been a breaking of the link between financial firms and real economy firms. Although financial firms may still be under considerable stress, evident in the continued stress evident after the Lehman Bros collapse in indices such as SRISK in 2017. We infer that the diversity evident from GS occurs because there has been a breaking of the link between financial firms and real economy firms.
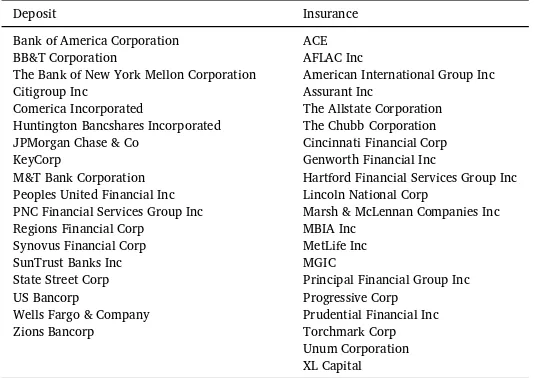
res-Table 1
Classification of financial stocks.
Deposit Insurance
Bank of America Corporation ACE BB&T Corporation AFLAC Inc
The Bank of New York Mellon Corporation American International Group Inc Citigroup Inc Assurant Inc
Comerica Incorporated The Allstate Corporation Huntington Bancshares Incorporated The Chubb Corporation JPMorgan Chase & Co Cincinnati Financial Corp KeyCorp Genworth Financial Inc
M&T Bank Corporation Hartford Financial Services Group Inc Peoples United Financial Inc Lincoln National Corp
PNC Financial Services Group Inc Marsh & McLennan Companies Inc Regions Financial Corp MBIA Inc
Synovus Financial Corp MetLife Inc SunTrust Banks Inc MGIC
State Street Corp Principal Financial Group Inc US Bancorp Progressive Corp
Wells Fargo & Company Prudential Financial Inc Zions Bancorp Torchmark Corp
Unum Corporation XL Capital
cue packages, US banks actually outperformed the general market.King (2011)interprets this as evidence for the general acceptance of stabil-ity of the system, as both banks which did and did not receive assis-tance had improved share market outcomes, although those who did not receive assistance were more strongly rewarded.
The behavior of the financial sector index and the overall index is markedly different after 2010, Period V. HereGS̃t stabilises while
GSbegins to rise again, reflecting that the financial sector firms are somewhat stable in their relationships with each other, while the dif-ferences between financial sector and real economy firms is reduc-ing (there is increased correlation). Systemic risk begins to increase again for the overall index from April 2010, consistent with increas-ing concerns over emergincreas-ing problems in European sovereign debt mar-kets, and specifically Greece. While the first signs of Greece’s problems emerged in late 2009, it was in the first quarter of 2010 that inter-national financial markets were affected. The nadir of theGSindex occurs around 15th April, which is after the EU bailout package was announced, but before the call for IMF assistance on April 23. The rise in risk seems likely to be related to realization of the severe contagion risks associated with potential escalation of the crisis and the estimated larger combined exposure of the international banking sector to Greece, Portugal and Spain (see “Still in a Spin”,The Economist, April 15, 2010).
To sum up, in assessing the policy interventions one can draw the conclusion that if the aim was to halt the spread and amplification of the crisis occurring via the interconnectedness of the financial sector and real economy, then this should be deemed to have been successful.
4. Deposit-takers and insurers
The data set contains 20 insurance companies and 18 deposit–taking institutions (all of whom were recipients of funding from TARP); see Table 1 for the classification. We do not concentrate on the separate indices for other financial firms in the data set due to the diversity of their interests, for example, dealer/brokers, real estate investment, health care investment, and funds management advice.
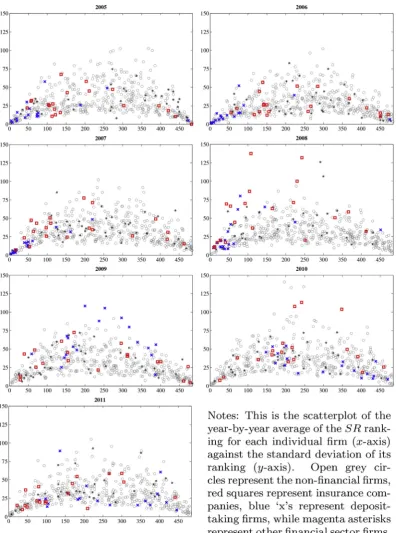
Fig. 2 provides a scatterplot of the average of theSRranking for each of the 502 firms in the system by year, for an individual firm (horizontal axis) against the standard deviation of its ranking (vertical
axis). The open circles represent the non-financial firms, blue xs are banks, red squares are insurance firms, and black asterisks are other financials.
There are two areas of the curve described by the scatterplot that are likely to be of interest to regulators. The first is the area of firms at the left end of the curve. These firms are consistently ranked amongst the most systemic – and they do not often fall out of this category. Across the years spanned by our sample closest to the origin we generally find four banks: JP Morgan, Wells Fargo, Bank of America, and Lehman Brothers. Of these, Lehman did not survive the crisis events of 2008. The three remaining banks are some of the largest by customer base and capitalisation in the US. They are also identified as Global SIBs by the Basel Committee on Banking Supervision (2011, 2013)rankings, and as systemically important by the Federal Deposit Insurance Corporation (FDIC). Thus there is strong agreement amongst different approaches that these banks pose substantial systemic risk to the economy.
The second area of potential macroprudential policy concern cor-responds to firms which have ranking somewhere near the middle of our sample, but with high standard deviation. That is, they are near the apex of the curve described by the scatterplot. These firms generally present as not particularly systemically important but their situation may change rapidly. They include firms such as the insurers AIG, and banks like Keycorp, Synovus and the financial conglomerate Regions Financial Corp. Firms at the far right hand end of the plots are unlikely to be of interest to policy makers, they are consistently not very sys-temic.
[image:5.595.165.432.76.265.2]Fig. 2.Mean versus standard deviation rankings by year.
an appearance in this category in the last two years of our sample.7 In all, these plots provide an easily digested visualisation of the sys-temically important financial institutions drawing from the dailySR
ranking computed from a system of interconnected risks amongst the real and financial sectors in the US. They summarizes the analysis of
7Loews Corporation owns 90% of CNA, a commercial and casualty insurance
com-pany that is among the largest in the US, and about 63% of the total revenues of Loews in 2011, the most important business line of the Corporation.
4.1. Insurers
The spread of regulatory attention to insurers since the rescue of AIG prompted protests from the industry, and reassurance from policy makers that insurers are recognized as less systemically risky than the banking sector. The results provide empirical evidence using a scatter plot (Fig. 2) of the average ranking of individual firms on the horizon-tal axis against the standard deviation of that ranking on the vertical axis. The𝐱show the location of the deposit-taking firms, while squares show the insurers. Other financial sector firms are given by asterisks. It is immediately apparent that not only there are a substantial number of systemically important financial firms near the origin, but that there is a distinct pattern in the location of banks and insurers that contributes immediately to the policy debate. Of the most systemically important financial firms, the deposit taking and other financial firms are nearest the origin – that is they are consistently the most systemic. This group includes JPMorgan Chase, Lehman Brothers, Bank of America, Wells Fargo, Goldman Sachs, US Bancorp, Morgan Stanley, and PNC Finan-cial Services Group.8 Insurers comprise a broad second group, con-centrated – with Principal Financial, Loews, MetLife, Prudential, and Allstate clustering together. This is entirely consistent with the existing rhetoric from both the discussion and empirical evidence of the aca-demic literature, regulators and the industry that insurance is not as systemically important as banking.
A different pattern emerges near the apex of each plot. Firms in these positions can move quite considerably. If we undertake a scatterplot for the entire sample period we find that the firms nearest the apex (and their co-ordinates) are AIG (238,201), Synovus (211,202), Unum (235,178), that is two insurers – AIG and Unum – and a community bank.
The case of Unum is cloudier than most, as it is considerably com-plicated by a significant settlement package in May 2008 around alle-gations of artificially inflating stock prices during the early part of the decade. This couples with a number of significant settlements regarding bad faith practices in insurance payouts and company rebranding from UnumProvidential to Unum in 2007 to make this a particularly difficult firm to characterize.
The path of Synovus reflects their rapid decline from a record profit year in 2006, accompanied by ambitious geographical expansion plans to a group with a goodwill impairment of $480million in 2008, badly affected by the decline in the housing market in its regional home-land in the South Eastern States and making financial losses every year from 2008 to 2011 (Synovus Annual Reports, 2006–2012). Syn-ovus had sufficiently impaired capital that it undertook a $968 million TARP contract with the US Treasury, and had a substantially longer period until repayment in July 2013 than most institutions.9 As part of its return to profitability in 2012 it has undergone a dramatic restruc-ture, consolidating its previous 30 banking charters into one organiza-tion, but attempting to carefully retain its image as a community based bank.
The AIG case has been subject to detailed analysis – Harrington (2009)provides an excellent review – particularly detailing the com-plex nature of this conglomerate of over 70 companies in 2006, their high exposure to the CDS market, mortgages, securities lending, and the extent to which their fate was interwoven with that of the banking sector.Harrington (2009)makes a convincing case that the rescue of this company was critically affected by considerations of their
counter-8American Express Company, The Goldman Sachs Group Inc, Lehman Brothers, and
Morgan Stanley are (or were) non deposit taking financial institutions, hence its classifi-cation on the asterisk group.
9Extensions of TARP liabilities beyond December 2013 attract a higher rate of return
[image:7.595.348.516.75.154.2]to the Treasury.
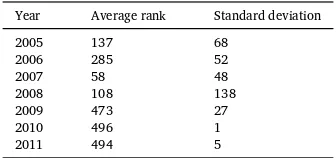
Table 2
Position of AIG in scatterplot by year.
Year Average rank Standard deviation
2005 137 68
2006 285 52
2007 58 48
2008 108 138
2009 473 27
2010 496 1
2011 494 5
party relationships. Many banking sector firms would have been seri-ously affected by failure of AIG – and this extended well beyond simple US counter-parties, the EU banking system was highly vulnerable to any potential collapse in AIG.
The details of how AIG has fared in a year by year analysis is pro-vided inTable 2. In 2005, 2006 it is apparent that it was ranked rel-atively towards the right hand end of the scatter, although still with reasonably high standard deviation, and that in 2007 it dramatically increased in systemic riskiness to be ranked 48th that year - in 2008 this receded to an average of 108th ranking but in 2009 ricocheted back to a rank of over 400, reflecting the effects of the calmer market concerns about AIG after the rescue plan was enacted.
A number of other institutions, such as Zions and Marsh and McLen-nan, have an average ranking around the middle of the horizontal axis but with lower standard deviation – although this must be placed in context that the standard deviation remains considerably above that of the majority of real sector firms. Other institutions which fluctu-ate considerably across the time span are Freddie Mac, which, along with Fannie Mae, was taken into conservatorship on September 6, 2008 before returning to government sponsored enterprise status - Fannie Mae on the other hand may be found to the right of the distribution at coordinates. The firms of no regulatory interest, that is those in the extreme right of the scatterplot, are typically not from the financial sec-tor, although one deposit taking institution, the People’s United Finan-cial is in the consistently least systematically important group.
The results support the industry and regulatory claims that insur-ance companies are less systemically important than the banking sector. However, as an industry group, the insurance companies are clustered immediately behind the banking sector in the systemic threat they pose to the economy. This comes about due to the strong interlinkages both within the financial sector, between banking and insurance, see also Schwarcz and Schwarcz (2014), but also through their strong links to the real economy – both through the insurance services they provide and their ventures into non-traditional risk taking products.
If macro-prudential regulation is designed to limit the disruptions to the real economy caused by withdrawal and contraction in credit markets, then the growing presence of insurers in this market argues strongly for their inclusion in a regulatory framework which recognises the differential nature of their underlying customer base, whereby runs on insurance policies are unlikely although catastrophic events chal-lenge capital periodically. The chalchal-lenge will be to avoid regulatory arbitrage emerging in another sector of the economy to exploit the highly profitable business of the credit risk transfer services which are highly valued by the non-financial consumer and producer sectors of the economy.
4.2. Robustness
Fig. 3.Robustness to filtering and window length choices.
of the paper.10 The left hand panel is the overall index and the right hand panel the financial sector index. It is immediately evident that the two lines (the black with ARFIMA pre-filtering and the red with ARMA pre-filtering) are substantially the same. The lower panels of Fig. 3show the overall and financial systemic risk indices produced using moving windows of 250 days (red), 400 days (black) and 500 days (blue). It is apparent, particularly for the overall index that these make little difference with the exception of the usual result of smaller moving windows being associated with greater volatility and earlier detection of change, whereas longer windows are associated with less volatility and later detection of change. The earlier detection of change
10An ARIMA pre-filter would imply non-stationary realized variance, and is hence
not considered.
and greater volatility of the smaller window is most apparent in the financial sector index, where it records a much earlier and larger drop in systemic risk in 2005 than the drop recorded in the long window index in 2006. Reassuringly, however, all three indices move simultaneously sharply upwards in September 2008, representing their ability to detect rapid dramatic changes in systemic risk.
5. Implications
such as SRISK, they do make a considerable difference to the intercon-nectedness between the financial and real economy sectors. By sepa-rating these two sectors the intervention acts to dampen the feedback effects between them. In this way the real economy is somewhat tected from lack of credit to continue operations, and subsequently pro-tects the financial sector from further loss due to bankruptcy and busi-ness failures in the real economy. Interventions to reduce connectivity clearly have a place in the policy makers arsenal if the goal is to mini-mize the overall loss of economic activity during a financial crisis. This of course, does not mean that the redistributions involved will always be considered fair by the agents in the economy.
Second, the analysis clearly identifies that deposit-taking institu-tions are routinely more systemically risky than other types of financial institutions. However, insurance companies are a readily identifiable group of firms which are consistently highly ranked for systemic risk; and are the most easily identified industry after banking. Thus our anal-ysis supports the argument that insurance companies are a good candi-date for systemic oversight, but they are also a less obvious issue than deposit-taking/credit-creating institutions. It is likely that the blurring of functions between traditional insurance products and other finan-cial innovations carried out by insurance companies are contributing to their systemic risk profile. Insurance industry firms which wish to avoid the development of further regulatory oversight would be well-advised to clearly demonstrate their points of difference from credit-creation style activities.
The lessons for investors are also clear. In times of crisis the financial sector firms are critical in whether shocks from one part of the economy are transmitted to others. There are important moral hazard problems in knowing whether the regulators will routinely intervene to dampen the connectivity between sectors during periods of stress. If, on balance, the regulators are expected to intervene in severe cases, then real econ-omy firms will not bear the full brunt of the crisis, making it attractive to have non-financial stocks in a portfolio. The performance of finan-cial sector stocks will depend on the form of intervention undertaken; supporting the financial sector may result in excess returns for capi-tal invested in that sector, but actions such as forced merging and/or resumption of ownership may result in excess loss. The origins of the crisis determine the form of response of the policy makers. Thus while it is good policy to have a number of strategies to implement reduced connectivity between the real economy and the financial sector during periods of extreme stress, it will not be easy for investors to anticipate the form that intervention may take, and hence to profit from it. With-out this uncertainty it would be difficult for the policy actions to be effective as these expectations would be priced.
6. Conclusions
In this paper we produce an overall index of systemic risk for the financial sector, and a ranking for each of the firms in the dataset. To this end, we examine the connections between shocks in risks over 500 US companies drawn from the S&P500 index for the period 2003–2011. Our approach takes into account that firms are related by a system of risks, which may be affected by shocks that are transmitted through both the financial sector and the real economy. An adaption of the
Google PageRank algorithm is used to account for the interconnections of firms in the economy, and allows a ranking of the most systemically important.
Our overall index of systemic risk shows that policy interventions such as the TARP and the rescue of AIG halted the decline in the finan-cial sector relative to the real economy firms. Thus in assessing the policy interventions one can draw the conclusion that if the aim was to impede the spread and amplification to the real economy, then this should be deemed to have been successful. However, while these policy interventions were effective in reducing systemic risk as measured by interconnections, they did not alter systemic risk measured by capital shortfall, as shown inBrownlees and Engle (2017).
Our systemic risk ranking suggests the importance of two categories of firms in assessing systemic risk. First, those which consistently rank as the most systemic throughout the sample –including banks such as Wells Fargo, Bank of America and JP Morgan. Second, those firms which may on average rank in the middle of the system, but have the capacity for rapid change, such as AIG and KeyCorp. Financial firms fea-ture prominently in both of these groups. This reinforces the regulatory emphasis placed on understanding and perhaps limiting the exposure of the economy to these institutions.
There are a number of important extensions which could be coun-tenanced to this work. The first is widening the scope of the firms included in the analysis. This includes incorporating firms which do not trade in the S&P500 and those which are not even listed, perhaps using criteria such as assets under management. It also includes exten-sions beyond the US, to incorporate cross-border financial institutions and the issue of global SIFIs.11 The second is to relate the systemic outcomes to firm characteristics, and indeed different characteristics for different sectors, or sectors in different jurisdictions. Additionally, controls for macroeconomic conditions more generally may add further information. Finally, adapting this approach to consider leading and lagging correlations may enable us to examine mechanism for shock transmission and directionality in the system, consistent with the pair-wise Granger-causality approach inBillio et al. (2012)andDiebold and Yilmaz (2014). Our methodology is flexible enough to accommodate these extensions.
Acknowledgements
This is a revised version of the papers “Ranking Systemically Impor-tant Financial Institutions” (ECARES WP 2012/37) and “The Emergence of Systemically Important Insurers” (CIFR Paper No. WP038, 2014). We are grateful for comments from the editors and referees and par-ticipants in the Economic Modelling Special Issue workshop held at Deakin University in June 2017. The authors acknowledge the support provided for this research by the Centre for International Finance and Regulation under Grant E102: Detecting Systemically Important Risk. A large part of this paper was written while Matteo Luciani was charge de recherches F.R.S.- F.N.R.S., and he gratefully acknowledges their finan-cial support. Of course, any errors are our responsibility. Disclaimer: the views expressed in this paper are those of the authors and do not nec-essarily reflect those of the Board of Governors or the Federal Reserve System.
A. Data
A.1.
Intraday returns
The raw data consist of 5 min observations downloaded from the Thomson Reuters Tick History for all RIC codes included in the S&P500 provided by SIRCA for the period January 1, 2002 to December 31, 2011. The initial download contains 935 tickers.12 The dataset used in this paper does not purport to be a full history of all stocks on the S&P500, but rather draws from the universe of S&P500 listed companies for the period 2002–2011. After this process the sample contains 557 stocks. Programs in C+ are available on request to both replicate the data and make alternative selections.
As our methodology is best applied to a balanced panel of stocks we first truncate our sample to begin in January 2003, as there are considerable numbers of stocks which did not have full data in the earlier years. We then have data of three types: stocks which are present throughout the entire sample, stocks which leave part way through the sample, and stocks which enter partway through the sample. Additionally, we drop a small number of stocks with insufficiently complete data. We then choose to force inclusion of three stocks which would not have made it through this data cleaning process: these were Lehman Brothers (who were delisted in 2008 after becoming bankrupt), Fannie Mae, and Freddie Mac. Following their placement into conservatorship on September 6, 2008, the ordinary stocks of Fannie Mae and Freddie Mac were no longer traded on the exchange. We use data from alternative markets, mainly OTC and NYSE Arca for the intervening periods between the cessation of the listed stocks and the emergence of a steady stream of OTC Bulletin Board data from after their return to government status. At the final stage there are 502 time series for stocks in the database, from January 2, 2003 to December 30, 2011, for a total of 2262 trading days. The complete list may be found in the web-appendix.
A.2.
Realized volatilities
Using the last trade in each 5 min period between 9:30am and 04:00pm each trading day we construct annualized daily realized volatilities as the sum of squared intradaily returns, with overnight returns removed. These realized volatilities form the basic dataset,xjt. More precisely, letrjti be the intraday trade return of firmjon daytat 5-min timei=1,…,N. The annualized realized volatility is
xjt=100
√
252
√ √ √ √∑N
i=1
r2
jti.
This is the simplest estimator of the integrated volatility from high frequency data, and is valid if prices follow a Brownian motion.
If prices have a jump component this will be incorporated intoxjt; see 2004. While the inclusion of jumps in a measure of integrated volatility is a disadvantage for analyses that focuses on volatility, this is an advantage in our case. Jumps are a distinguishing feature of asset pricing under stressful conditions and occur in response to information as shown inDungey et al. (2009), Lahaye et al. (2011), Andersen et al. (2007). Thus their inclusion is practically important in attempting to empirically model systemic risk. While the estimator is in principle contaminated by microstructure noise, 5-min data is the commonly used benchmark trade-off between information and noise for liquid assets; see for example 2011 and 2007.
References
Acemoglu, D., Ozddaglar, A., Tahbaz-Salehi, A., 2015. Systemic risk and stability in financial networks. Am. Econ. Rev. 105, 564–608.
Acharya, V., Pedersen, L., Philippon, T., Richardson, M., 2010. Measuring Systemic Risk Technical report. New York University.
Adrian, T., Brunnemeier, M., 2016. Covar. Am. Econ. Rev. 106, 1705–1741.
Allen, F., Babus, A., Carletti, E., 2012. Asset commonality, debt maturity and systemic risk. NBER 104, 519–534.
Andersen, T.G., Bollerslev, T., Diebold, F.X., Ebens, H., 2001. The distribution of realized stock return volatility. J. Financ. Econ. 61, 43–76.
Andersen, T.G., Bollerslev, T., Diebold, F.X., Labys, P., 2003. Modeling and forecasting realized volatility. Econometrica 71, 579–625.
Andersen, T.G., Bollerslev, T., Diebold, F.X., Vega, C., 2007. Real–time price discovery in global stock, bond and foreign exchange markets. J. Int. Econ. 73, 251–277.
Archarya, V., Engle, R., Richardson, M., 2012. Capitalshortfall: a new appraoch to ranking and regulating systemic risks. Am. Econ. Rev. 102, 59–64.
Basel Committee on Banking Supervision, 2011. Global Systemically Important Banks: Assessment Methodologyand the Additional Loss Absorbency Requirement Technical report. Basel Committee on Banking Supervision.
Basel Committee on Banking Supervision, 2013. Global Systemically Important Banks: Updated Assessment Methodology and the Higher Loss Absorbency Requirement Technical report. Basel Committee on Banking Supervision.
Benoit, S., Colletaz, G., Hurlin, C., Perignon, C., 2013. A Theoretical and Empirical Comparison of Systemic Risk Measures Technical report. University of Orleans.
Bickel, P., Levina, E., 2008. Regularized estimation of large covariance matrices. Ann. Stat. 36, 199–227.
Billio, M., Getmansky, M., Lo, A., Pelizzon, L., 2012. Econometric measures for connectedness and systemic risk in the finance and insurance sectors. J. Financ. Econ. 104, 535–559.
Bisias, D., Flood, M., Lo, A., Valavanis, S., 2012. A survey of systemic risk analytics. Annu. Rev. Financ. Econ. 4.
Borio, C., 2003. Towards a Macroprudential Framework for Financial Supervision and Regulation? Technical report. Basel Committee on Banking Supervision.
Brownlees, C., Engle, R., 2017. SRISK: a conditional captial shortfall measure of systemic risk. Rev. Financ. Stud. 30, 48–79.
Brin, S., Page, L., 1998. The anatomy of a large-scale hypertextual web search engine, In: Seventh International World-Wide Web Conference (WWW 1998) April 14-18. Brisbane, Australia
CPSS and IOSCO, 2013. Authorities’ Access to Trade Repository Data Technical report. Committee on Payment and Settlement Systems and Board of the International Organization of Securities Commissions.
Diebold, F., Yilmaz, K., 2014. On the network topology of variance decompositions: measuring the connectedness of financial firms. J. Econ. 182.
Drehmann, M., Tarashev, N., 2011. Measuring the Systemic Importance of
Interconnected Banks Technical report. Bank of International Settlements. Working paper 342.
Dungey, M., Dwyer, G., Flavin, T., 2013. Systematic and liquidity risk in subprime-mortgage backed securities. Open Econ. Rev. 24, 5–32.
12The SIRCA stocklist ‘0#.SPX’ contains many more stocks than actually trade including OTC and alternative exchanges. We retain stocks with suffixes N,K and OQ which represent
Dungey, M., Luciani, M., Matei, M., Veredas, D., 2017. Surfing through theGFC: systemic risk in Australia. Econ. Rec. 93, 1–19.
Dungey, M., MacKenzie, M., Smith, V., 2009. Empirical evidence of jumps in the term structure of the U.S. treasury market. J. Empir. Financ. 16, 430–445.
Fan, J., Liao, Y., Mincheva, M., 2013. Large covariance estimation by thresholding principal orthogonal complements. J. R. Stat. Soc. B 75, 603–680.
Gai, P., Kapadia, S., 2010. Contagion in Financial Networks Technical report. Bank of England. Working paper 383.
Giglio, S., 2011. Credit Default Swap Spreads and Systemic Risk Technical report. Harvard University.
Giratis, L., Kapetanios, G., Wetherilt, A., Zikes, F., 2016. Estimating the dynamics and persistence of financial networks, with an application to the sterling money market. J. Appl. Econ. 31, 58–84.
Harrington, S.E., 2009. The financial crisis, systemic risk, and the future of insurance regulation. J. Risk Insur. 76, 785–819.
Huang, X., Zhou, H., Zhu, H., 2009. A framework for assessing the systemic risk of major financial institutions. J. Bank. Financ. 33, 2036–2049.
Huang, X., Zhou, H., Zhu, H., 2012. Systemic risk contributions. J. Financ. Serv. Res. 42, 55–83.
Kalbaskaa, A., Gatkowskib, M., 2012. Eurozone sovereign contagion: evidence from the cds market. J. Econ. Behav. Organ. 83, 657–673.
Kapadia, S., Drehmann, M., Elliot, J., Sterne, G., 2012. Liquidity Risk, Cash–flow Constraints and Systemic Feedbacks Technical report. Bank of England. Working paper 456.
King, M., 2011. The Cross-border Contagion and Competition Effects of Bank Bailouts Announced in October 2008 Technical report. University of Western Ontario. manuscript.
Lahaye, J., Laurent, S., Neely, C.J., 2011. Jumps, cojumps and macro announcements. J. Appl. Econ. 26, 839–921.
Lam, C., Fan, J., 2009. Sparsistency and rates of convergence in large covariance matrix estimation. Ann. Stat. 37, 4254–4278.
Langfield, S., Liu, Z., Ota, T., 2013. Mapping the uk Interbank System Technical report. UK Financial Services Authority.
Luciani, M., Veredas, D., 2011. A Model for Vast Panels of Volatilities Technical report. ECARES. Working paper 28.
Markose, S., Giansante, S., Gtkowski, M., Shaghaghi, A.R., 2012. ‘Too interconnected to fail’ financial network of us cds market: topological fragility and systemic risk. J. Econ. Behav. Organ. 83, 627–647.
Moore, K., Zhou, C., 2012. Identifying Systemically Important Financial Institutions: Size and Other Determinants Technical report. Erasmus. manuscript.
Nijskens, R., Wagner, W., 2011. Credit risk transfer activities and systemic risk: how banks became less risky individually but posed greater risks to the financial system at the same time. J. Bank. Financ. 35, 1391–1398.
Schwaab, B., Lucas, A., Koopman, S.J., 2011. Systemic Risk Diagnostics Technical report, Tinbergen. manuscript.
Schwarcz, D., Schwarcz, S.L., 2014. Regulating systemic risk in insurance. Univ. Chic. Law Rev. 81.
Stuart, A., Ord, K., 1994. Kendall’s Advanced Theory of Statistics, sixth ed. Distribution Theory, vol. 1. Wiley.
Tarashev, N., Borio, C., Tsatsaronis, K., 2010. Attributing Systemic Risk to Individual Institutions Technical report. Bank of International Settlements. Working paper 308.