by
Harpreet Kaur Gill, MComp
A dissertation submitted to the
School of Computing and Information System
in partial fulfilment of the requirements for the degree of
Master of Computing
UNIVERSITY
OF
TASMANIA
I, Harpreet Kaur Gill, declare that this thesis contains no material which has been
accepted for award of any other degree or diploma in any tertiary institution, and
that, to my knowledge and belief , this thesis contains no material previously
published or written by another person except where due reference is made in the
text.
/7:44frfeel'
i'eae,4Harpreet Kaur
In recent years, there have been serious concerns about the declining stocks of wild
abalone combined with a rapidly increasing market demand and so aquaculture
researchers are continuously investing in new methods for growing and monitoring
cultured abalone. There are a number of new programs that have been planned for
farmed abalone, such as selective breeding and genetic manipulation to meet world
demand.
These methods can only be successful if abalone traits and behaviour can be
identified properly. Therefore, physical tagging of abalone shells and DNA
(Deoxyribonucleic Acid) pedigree markers have been developed to enable tracking
and tracing of individuals. Researchers are continually finding more effective
methods of physical tagging so that tags can be visualised more readily and will be
retained on the abalone shell for a longer period of time. Identifying the tag and
character information is also time and labour intensive. Therefore, automated image
analysis of abalone tags may provide a solution for tracking abalone and for
identifying abalone behaviour and pedigree information. After reviewing the broad
field of computer vision, an image processing system was developed in MATLAB
using appropriate image analysis and processing techniques, to automate the process
of extracting sub-images of physical tags attached to the abalone shells, in
preparation for input to an optical character recognition system, which would read
the tags on the shells.
The image processing system developed was able to successfully identify a number
of tags from digital images directly taken from land-based tanks on various abalone
farms; tag colour and character recognition was achieved. In addition, this research
I sincerely thank my supervisors, Dr. Ray Williams from UTAS, and Dr. Sharon
Appleyard from CSIRO MAR. Dr. Ray Williams provided great support throughout
the project, and I greatly appreciate his encouragement during the early difficulties
with this project, and his accessibility and thoroughness in all aspects of work.
I thank, Dr. Sharon Appleyard for provided the image data and other information
and also giving me the opportunity to visit an abalone farm during my project. I also
really appreciate Dr. Sharon Appleyard efforts in providing valuable advice on the
literature review on abalone aquaculture.
Special thanks go to Mrs. Jacky Hartnett, honours unit coordinator for provided
valuable information from the beginning to the end of the research.
Finally, I thank those who are not directly connected to my work, and my family
members, and my friends Ming, Saung, Linda for their excellent support during my
years studying at UTAS.
I. INTRODUCTION 1
2. LITERATURE REVIEW 5
2.1 Abalone Aquaculture 5
2.1.2 Methods 6
2.1.2.1 Factors in Cultured Abalone Growth 6
2.1.2.2 Selective breeding 7
2.1.2.3 Physical Tagging 9
2.1.2.4 Effectiveness of Physical Tags and Tagging Issues 10
2.1.2.5 Alternative Methods 10
2.2 Image Analysis 11
2.2.1 The MATLAB Image Processing Toolbox 12
2.2.2 Related work 12
2.2.3 Image Analysis Procedures 12
2.2.3.1 Image Enhancement 12
2.2.3.2 Colour models 13
2.2.3.3The Segmentation Process 15
2.2.4 The Feature Extraction Process 17
2.2.4.2 Feature extraction for medical imaging analysis 18
3. METHODOLOGY 21
3.1. Requirements and Work 21
3.1.2 Development Platform 22
3.1.3 Input Data 22
3.3 Pre-Processing for Tagged Abalone Images 23
3.3.1 Size classification 23
3.3.2 Colour Classification 23
3.3.3 Noise Removal and Background Detection 26
3.3.4 Tag Segmentation 26
3.4 Analysis 28
3.4.1 Area Estimation 28
3.4.2 Rectangle Fitting and Rotation 29
3.4.3 Extracting Tag Sub-images 30
3.5 Optical Character Recognition 30
3.6. Evaluation 30
4. RESULTS AND DISCUSSION 32
4. 1 Image Analysis Process 32
4.3.1 System Evaluation 42
4.5 Optical Character Recognition 43
5. CONCLUSION AND FUTURE DEVELOPMENT 48
6. REFERENCES 51
7. APPENDIX 56
Figure 1: Tagged abalone 9
Figure 2: Enhancement in underwater image 13
Figure 3: RGB to HSI image process 15
Figure 4 a) Original image of bank cheque b) Two threshold values c) The output
result 16
Figure 5 : a) Before segmentation b) After segmentation 16 Figure 6 a): Original image b): Resulted Image 17 Figure 7 • Segmentation on tire image with line operator (Kang et al. 1992) 18 Figure 8: Original Image Figure 9: Vertical edge detection 19 Figure 10: Extracted text area and Binary image 20
Figure 11: Test result of proposed System 20
Figure 12: Hue values from HSI model Image 24
Figure 13: HSI Colour Space 25
Figure 14: Original Image 25
Figure 15: Results of identifying Yellow tags 26
Figure 16: Image after Colour Segmentation 27
Figure 17: Image after Morphological Processing 28 Figure 18: Rectangle fitting and rotation for extracting the tags 29
Figure 19: Single Tagged Abalone Image 35
Figure 20: Single Tagged Abalone Image 35
Figure 21: Triple Tagged Abalone Image 36
Figure 22: Single Tagged Abalone Image 36
Figure 23: Single Tagged Image Tags Extraction Results 41 Figure 24: Triple Tagged image Tag Extraction Results 41
Figure 25: Single Tagged Binary Sub-images 44
Figure 26: Double Tagged Binary Sub-images 45
Table 1: Three categories of images 23
Table 2: Time taken to process each Image 33
Table 3: Colours and Hue Angle values Pi = 1800 33 Table 4: Final Result of the Tag Segmentation Process 35
Table 5: Results on Object attributes 37
Table 6: Results on Object attributes 38
Table 7: Results on Object attributes 39
Table 8: Results on Object attributes 40
Table 9 : OCR system an Image Analysis System Results 47
Chapter 1
Introduction
Abalone is an important single-shell shell-fish species found in Asia, Australia,
United States, Mexico, New Zealand, Canada and South Africa (Selvamani et al.
2001, p.478). Australia is one of the major sources of the world's abalone. Tasmania
supplies nearly 50% of Australian wild abalone and approximate 25% of abalone
globally, to which the cultured abalone contributes only 2%, at approximately 500 —
600 tonnes (Elliot et al. 2004).
Cultured abalone farming is undertaken with appropriate planning and management
to maximise the quality of the abalone for commercial purposes and for selective
breeding purposes. Improving performance traits such as growth rates of cultured
abalone will lead to significant cost savings in the abalone aquaculture industry. To
obtain the desired results, researchers have suggested two genetic methods that could
help to increase traits in farmed abalone (Li et al. 2008, p.15; Hulata 2001) —
selective breeding and chromosome manipulation. In addition, non-genetic methods
such as improved husbandry and nutrition can also be crucial in improving traits such
as abalone growth.
To meet world demand for abalone, it is necessary to work on effective selective
breeding techniques for farming cultured abalone. As part of successful breeding
programs, tools are required that can identify individuals, groups or families of
abalone. Currently this is achieved through physical tagging, DNA
(Deoxyribonucleic Acid) marking and growing abalone families in different tanks.
These are the most common techniques used in selective breeding programs.
However, growing abalone families in separate tanks is not the most efficient method
maintenance and tank effects can also limit the genetic gain.
Therefore, tagging and DNA markers provide effective avenues for individual
identification in selective breeding programs, but on the other hand, molecular
markers are not as cost effective as physical tags because amplifying the DNA
markers in thousands of individuals can be very expensive (Appleyard et al. 2008).
Physical tags are also still required for a visible method of identification — DNA
markers can not be seen by eye (Appleyard et al. 2008).
However, physical tagging methods in abalone are also very labour and
time-intensive, and there are a number of issues related to tag durability, including tag loss
by dislodgment, fouling, and grazing. Therefore, some method is required to monitor
growth and behaviour using individual tags that can enable researchers to find the
same individual repeatedly throughout an animal's lifetime. However, manually
monitoring abalone movement and behaviour in order to get the survival and
heritability information is complex and time consuming. Therefore, this research
focuses on the development of image analysis algorithms that can assist abalone
farmers and researchers to track and trace individuals within a tank and monitor
abalone behaviour more easily. The visualisation of the tags on animal surfaces is
important for automatic tag recognition through image analysis. Automated image
analysis is particularly important when the manual process is slow and expensive, as
is the case for tracking of abalone with attached tags in image sequences.
Analysing tags on abalone shells using images can be an effective way to identify
abalone pedigree information. The image analysis can be of benefit, not just in
selective breeding programs, but also in the analysis and identification of the best
characteristics of the abalone both for selection and commercial purposes. Currently,
CSIRO and the Tasmanian abalone farms use Labview software to collect the images
and then NI Vision to estimate abalone lengths. In addition, a Victorian farm uses
digital callipers to obtain length data for various abalone species.
However, although it may be easy for humans to analyse the tags in images, again
this process is a very time consuming process if it needs to be undertaken on a large
set of images. On other hand, an automated system must have knowledge of the
colour and shape of each tag in order to extract it from the image background.
Therefore, this project involves the use of the Image Processing Toolbox from
MATLAB, which is very suitable for work with colour images. It provides a
comprehensive set of algorithms and graphical tools for processing digital images.
This project involves the development of suitable image processing techniques to
identify tags and other parameters such as position, orientation and colour
information of tags. The extraction of tag ID (identification) is important to derive
the pedigree information of each abalone. The development of the application
provided an initial confirmation of the hypothesis that image analysis is suitable for
identifying and extracting the tags from abalone images. However, it is important to
recognise that the success of image processing techniques can be affected by a
number of factors such as image quality, how far away from the tank the images are
taken and image size. Any input images presented to the current image analysis
system need to be clearly human readable before the system is likely to produce
acceptable results.
The system development process is divided into three main categories, which include
pre-processing, shape comparison and extraction processes on abalone images and
lastly preparation of characters from each tag for optical character recognition.
In this research, tagged abalone images were obtained from Victorian and Tasmanian
farms. These farms use land-based tanks to grow abalone and the images were taken
directly from these tanks. The images were in JPEG format and were approximately
2000 * 3000 pixels in size. Image quality and image size can make a major
difference to the success of the image analysis system. The process for analysing the
tags can suffer if the images are of poor quality, if the images are very large in size,
positioned with respect to the tank.
Once sub-images containing the tags had been extracted from the images, they were
presented to an optical character recognition system, to enable the system to
understand the characters on each tag. Currently, the system uses a
template-matching algorithm to recognise the characters on binary sub-images of each tag,
extracted from the surrounding image. In this process, the characters are passed
through number of pre-processing steps before the optical character recognition
process applied.
At last, the system accuracy is checked using two approaches. Firstly a comparison
between manual evaluations and system-produced results for the position, width,
height and orientation of each tag was carried out. Secondly, a manual analysis was
used to determine the accuracy of the automated system when identifying tag colours
and counting the number of tags as well as determining the number of times the
system recognises an object as a tag when it is not a tag.
Chapter 2
Literature Review
The aim of this chapter is to briefly discuss the abalone aquaculture industry, and to
explain how tagging techniques can be used to assist in the selection of the best traits
in farmed abalone using selective breeding programes. In addition, some image
analysis and automated recognition systems are discussed for identification and
extraction of tags for further processing.
2.1 Abalone Aquaculture
Abalone is an important single-shell shell-fish species found in Asia, Australia,
United States, Mexico, New Zealand, Canada and South Africa. Abalone species are
marine gastropod mollusks, belonging to the family of Haliotidae and the genus
Halitosis (Selvamani et al. 2001, p.478). Abalone are usually found in temperate
locations worldwide, and are recognised as a highly prized animal in the consumer
seafood industry (Elliot 2000). In recent years, abalone stocks have been declining
due to a number of factors including overfishing, illegal harvesting and habitat
destruction (Lee et al. 2007; Dixon et al 2006; Wilding 2007).
2.1.1 Production
The farming of abalone has rapidly risen in importance between 1992 and 2007 and
now produces approximately 26000 tonnes globally, on an annual basis. In
contrast, the wild harvest has declined to 9500 tonnes annually due to overfishing,
illegal harvesting, habitat destruction, and diseases within the population (Lee et al.
2007; Dixon et al 2006; Wilding 2007). Therefore, cultured abalones are in high
demand, with a wide diversity of abalone species available to offer to world
markets and the industry can produce a more consistent supply of high quality
A major component of the world's abalone fishery comes from Tasmania. Tasmania
supplies nearly 50% of Australian wild abalone and approximate 25% globally
(Elliot et al. 2004) with wild abalone taken directly from the sea. In contrast,
cultured abalone farming is done inside land based tanks enabling proper planning
and management to be undertaken to maximise the quality of the abalone for
commercial purposes and selection purposes.
Australia currently farms two pure abalone species: Haliotis rubra, the blacklip
abalone and H. laevigata, the greenlip abalone and their interspecies hybrid (Elliott
2000). The hybrid combines the market quality traits of the greenlip with the
endurance and growth rates of the blacklip ablone (Appleyard 2008). Australia
makes a profit of $A246 million each year exporting abalone to major markets in
Hong Kong, China and Japan (Appleyard 2008).
2.1.2 Methods
2.1.2.1 Factors in Cultured Abalone Growth
To protect abalone species and to meet world demand for abalone, it is necessary to
work on effective selective breeding techniques for farming cultured abalone.
Abalone are generally slow growing gastropod mollusks with a five stage life
cycle-embryo, larvae, postlarvae, juvenile and adult (Grubert 2005, p.8). The grow-out
time to market size for cultured adult abalone in temperate Australian regions is
approximately three to four years; it starts with one year of juvenile development.
Given this, improvement in growth (i.e. faster growth or production of larger abalone
in a four year time frame) is a very important trait for the abalone industry. For
example, greenlip abalone have been shown to grow faster than blacklip abalone and
so provide better returns on investment for farmers (Weston et al. 2001). The
considerable time for growth to market size contributes to the high operating costs
associated with culturing abalone (Appleyard 2008; Li et al. 2008). Consequently,
improving growth rates of cultured abalone will lead to significant cost savings in the
To obtain the desired results, researchers have suggested two genetic methods that
could help to increase the growth rates in farmed abalone (Li et al. 2008, p.15;
Hulata 2001) — selective breeding and chromosome manipulation. Other non-genetic
methods such as improved husbandry and nutrition can also play a major role in
improving abalone growth.
Selective breeding uses targeted mating to produce a large number of abalone
families and individuals with desirable commercial traits. Aquaculturists commonly
use different types of breeding methods for intraspecific genetic improvement (Li et
al. 2008, p.15; Hulata 2001) including mass selection, within and among family
selection and multiple trait selection using selective indexes. For example, genetic
variation in the red abalone (H.rufescens) can lead to a 50% to 100% increase in
growth rate (Elliot 2000).
In all selective breeding programs, farmers need to select their broodstock from
either farms or wild abalone stocks. Selecting individuals from the wild, farmers
usually target abalone that are in reproductive condition. Farmers bring the ripe
broodstock back to the farm, where the broodstock are induced to spawn. However,
this approach is not suitable for all farmers because collecting the brood stock from
the sea at different sites poses different problems such as the total absence of
appropriate animals in some years and unreliable supply of abalone during the
spawning season almost every year (Fleming 2001). In addition to selective breeding
programs, ploidy or chromosome manipulations are the second type of genetic
modification which can help improve abalone traits although this technique
requires direct genetic modification of the abalone genome. Chromosome
manipulations are best undertaken within a selective breeding program using
known sires and dams and monitoring of performance on the farm alongside
diploid controls (Appleyard 2008).
2.1.2.2 Selective breeding
One of the key research challenges for the Australian abalone aquaculture industry is
the development of selective breeding programs to improve the productivity of the
genetic variation in commercial traits and estimate a standard measure of the
proportion of genetic variation in a population. A number of industry-based selective
breeding programs currently concentrate on a number of commerical characteristics,
including growth rate, foot meat, and disease resistance in pure abalone species and
in hybrids (Kube et al. 2007).
An issue which needs to be considered in selective breeding is the high
environmental variation that is introduced in the early stages of abalone development
and which heavily impacts on the attainable genetic improvement. The age at which
selections are made also needs to be considered carefully (Kube et al 2007, p.823).
On other hand, the process of crossing from the best parents of each generation and
explains that it was possible to achieve a gain of approximately 5% in total weight
using this process. However, their research faced some limitations, such as frequent
loss of tags, and significant environmental variation at in the early stages of the
abalone life cycle, even for families that were raised in different tanks. The research
project only recovered 17 families, out of a total of 21, due to poor durability of tags
(Kube et al. 2007).
Alongside managing high environmental variation, success in breeding programs
will rely on individually identifiable pedigreed abalone (Appleyard et al. 2006). To
maintain the familial or pedigree information in abalone, farmers often grow the
abalone in separate tanks so they can select appropriate family members for
breeding. However, rearing families in separate tanks is not the most efficient
method of culture for a breeding program due to the expense, labour and time
required for maintaining multiple tanks. Tank effects can cause growth related
differences due to different tank environments, and they can also limit the genetic
gain made within a breeding program (Appleyard et al. 2008).
Controlling environmental variation by growing families within the same tank
environment will help to increase the gains made in selective breeding programs for
abalone. However, when different families are gown within the same tank
environment, farmers and researchers must have the tools to be able to identify,
monitor and track individuals and families at all stages of their life cycle from the
across an individual's life-time are required - accurate trait data from both
individuals and families will help to increase genetic gain and hence profit for the
farmer. Therefore, a major challenge in selective breeding is to grow out a large
number of families in a communal environment where families and individuals can
be uniquely identified. However, overstocking/density of abalone in tanks may also
affect on the abalone growth directly because competition of shelter space and
indirectly because of degradation of water quality in tanks (Huchette et al. 2003;
Weston et al 2001).
In cultured systems which use a communal grow-out environment, marking and
tagging is regarded as the most effective way to acquire valuable information about
abalone, from the larvae to the adult growth stage, and to obtain pedigree
information. Using this approach, a researcher can also obtain other information on
growth and mortality, as well as on movement and foraging behaviour. CSIRO is
currently using several specific types of physical tags and DNA markers to provide
pedigree information on abalone when they are grown in the same tanks (Appleyard
et al. 2008).
2.1.2.3 Physical Tagging
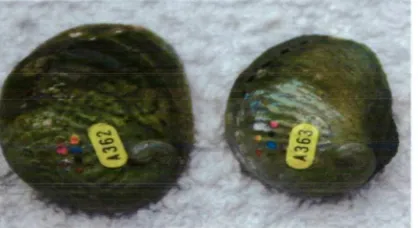
Physical tagging enables researchers and farmers to repeatedly measure, track and
trace the same individual over its life-time. A number of different types of tags have
been used in cultured abalone breeding programs including nail polish, paint pens,
small coloured beads, PIT tags, spring tags, and Hallprint shellfish tags (Appleyard
[image:18.558.184.393.585.699.2]et. al 2008) (see Figure 1).
Prince (1991) also explained the different ways of tagging abalone, including the use
of tags affixed to the abalone shell with adhesive and tagging using a wire or split
pin. All of these techniques, however, increase the stress on the abalone because of
the handling required and may cause mortality of some abalone.
Prince (1991) proposed a technique that uses central laminated numbered discs with
a hole inside and nylon rivets, with the tags assembled prior to insertion into the
abalone shell. This technique serves to minimise the stress associated with tagging.
McShane et al. 1988 explained that attaching tags with adhesive produces more
stress than attaching tags with stainless steel. This study shows that laminated
numbers can be easily applied under the water without bringing the abalone to the
surface, while the adhesive tags were difficult to apply under water.
2.1.2.4 Effectiveness of Physical Tags and Tagging Issues
There are a number of issues related to tag durability, including tag loss by
dislodgment, fouling, and grazing. In one experiment on greenlip abalone families,
the tag recovery rate after eight months of monitoring varied from 21 to 100%. The
experiment was affected by crushed shells, visualisation problems and tag fouling
(Appleyard et al. 2008). Various kinds of tags have been used in an attempt to solve
to these problems, but no one has yet found the perfect solution for tagging.
Tagging is also very labour and time-intensive. Therefore, some method is required
to monitor growth and behaviour using individual tags that can enable researchers to
find the same individual repeatedly throughout an animal's life time. Similarly, the
ability to visualise the tags and to retain the tag on the abalone shell is important for
automatic tag recognition through image analysis.
2.1.2.5 Alternative Methods
Researchers are currently searching for better methods of identifying individual
abalone to provide solutions to some of these physical tagging difficulties. One
alternative is the molecular marker which is a fragment of DNA which is inherited
broodstock relatedness and identification of pedigree information relating to the
abalone (Carr et al. 2008). The molecular marker is amplified from an individual's
DNA using the PCR (Polymerase Chain Reaction) technique (Semagn et al. 2006).
The main advantage of molecular tagging is that it is determined at birth, the marker
stays with the abalone for its entire life and can be amplified in young juveniles (as
PCR techniques require only a small amount of tissue) (Appleyard et al. 2008).
Importantly, if implemented correctly, molecular markers can be used to identify
individual family members from a communal tank. Markers are amplified in the
offspring and 'putative' broodstock. Using genetic software, offspring can then be
assigned to their correct sires and dams; hence family information is retrieved.
However, molecular markers are not as cost effective as physical tags because
amplifying the DNA markers in thousands of individuals can be very expensive
(Appleyard et al. 2008). Physical tags are also still required for a visible method of
identification — DNA markers can not be seen by eye (Appleyard et al. 2008).
However, using stable oxygen isotopes is one of safest method to determining the
age and growth of abalone, in contrast, to tagging methods which can create adverse
effects on the abalone shell surface (Gumery et al. 2005).
As highlighted above, the key challenge for the abalone aquaculture industry is to
increase the growth rate (and other commercially important traits) in abalone species
to reduce the cost of maintenance/grow-out and to increase profit for the industry.
This challenge can only be addressed by thorough planning in the appropriate
selection of abalone for broodstock, accurate trait monitoring and by using
appropriate techniques for identification of abalone families. However, manually
monitoring abalone movement and behaviour in order to get the survival information
is complex and time consuming. Therefore, this research focuses on the development
of image analysis algorithms that can assist abalone farmers and researchers to track
and trace individuals within a tank and monitor abalone behaviour more easily.
2.2 Image Analysis
Image analysis is a field of the computer vision to give a meaningful description to
a broad discipline. Therefore, it is important to focus on the actual requirements for
image analysis techniques in this research. The main focus of the research is to
develop image analysis techniques to automatically analyse abalone images to detect
the tags attached to the abalone and to derive significant attributes relating to the
tags, such as tag ID number (used for heritability information) and colour, as well as
the position of the tag.
2.2.1 The MATLAB Image Processing Toolbox
The Image Processing Toolbox from MATLAB is very suitable for work with colour
images. It provides a comprehensive set of algorithms and graphical tools for
processing digital images. MATLAB also provides an analyser which can be used to
inspect algorithms and to create source code. A user can restore noisy or degraded
images, enhance images for improved intelligibility, extract features, and analyse
shapes and textures.
2.2.2 Related work
Image processing work has been carried out for chromosome analysis on the Pacific
red abalone (Kober et al. 2004) using rank order and digital morphologic filters to
determine the total length of chromosomes and relative arm lengths in digitally
enhanced images. These digital filters are very efficient in removing additive and
impulsive noise, as well as enhancing and restoring the microscope images. The
reason for their success in image processing is that they can suppress noise without
destroying important image details, such as edges and fines lines (Kober et al. 2004).
2.2.3 Image Analysis Procedures
2.2.3.1 Image EnhancementThe first step in analysis involves attempting to improve the quality of underwater
images. One of the fundamental steps in the design of image processing techniques is
to make sure that a given image is optimized for enhanced quality (Trussell 2005).
Images can be degraded by two main factors, light absorption and scattering. The
OP.. H ROB 6.9•111e.
Uncle, w
Illoole Eldwincor
[ Image Minnow Bit
reflected light is partly polarised horizontally and partly vertically. An important
characteristic of the vertical polarisation is that it makes the object less shiny and
therefore helps to capture deep colours which may not be possible to capture
otherwise (Iqbal et al. 2007).
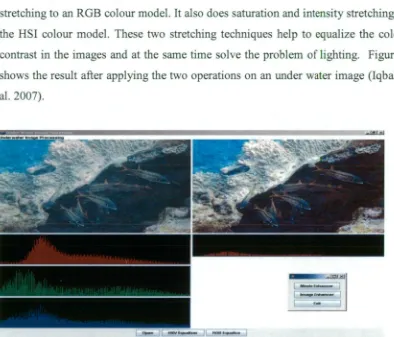
Some techniques, such as ACE (Automatic Colour Equalisation) enhance the image
without supervision and reduce the loss of contrast in an image by applying contrast
stretching to an RGB colour model. It also does saturation and intensity stretching on
the HSI colour model. These two stretching techniques help to equalize the colour
contrast in the images and at the same time solve the problem of lighting. Figure 2
shows the result after applying the two operations on an under water image (Iqbal et
[image:22.562.105.499.205.542.2]al. 2007).
Figure 2 Enhancement in underwater image Octal et al. 2007)
2.2.3.2 Colour models
The second step relates to the use of colour models such as HSI and CIE. This step
converts the RGB images provided by the camera into an appropriate HSI or CIE
colour space for colour analysis. Numerous methods for working with images are
provided, including histogram methods, smoothing and sharpening operations,
segmentation operations, and edge detection. These methods are designed
Exocution Tim • vs Num bor of Rogions
1 000
900
•
800
700
v 600 HSI
SOO C IEL*a*
400 ROB
300
200
100
0
39 49 59 69 79
Number of regions
common model used for the display of colour images but the
red,green and blue
components within this model are highly correlated and so
itis not the most
appropriate model to use for processing colour images (Luijten 2005).
On the other hand the HSI and CIE colour spaces are appropriate for most work
undertaken with colour images. Rasras, Emary and Skopin (2007) reported on a
study in which they showed that the CIE model produced better results than the RGB
and the HSI models when calculating the distance colour, a method applied between
two colours, but the drawback of the CIE is that it is not as computationally efficient
as RGB or HSI. This means that execution times in the CIE colour model are higher
than in other colour models for producing the output result on each selected region
(see Graph 1).
Graph 1:
A comparison between colour Models
(Bueno et al. 2008)Therefore, the HSI model is generally used for controlling the various elements of a
colour image individually. The Hue (H) determines the perceived colour of the image
(for example blue) while the Saturation (S) determines the depth
ofthe colour (from
a pale blue to deep blue) and the Intensity (I) is the brightness
ofthe colour (from
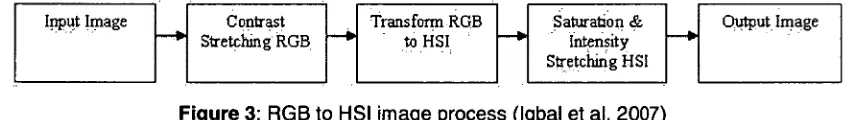
Input Image Contrast Stretching ROB
^-70.
Literature Review
image. The process can be carried out by using a histogram of the digital values for
an image, and redistributing the stretching value over the image to get the maximum
possible values of colour variation ( Figure 3) (Iqbal et al. 2007).
Transform ROB to HSI --110
Saturation & Intensity Stretching HSI
[image:24.557.94.518.158.218.2]Output Image
Figure 3: RGB to HSI image process (Iqbal et al. 2007)
In this research, it is the Hue value that enables an application to determine the
colour of the tags; categorised as red, yellow, green, pink or white. According to the
International Commission on Illumination (CIE), "hue is the attribute of a visual
sensation according to which an area appears to be similar to one of the perceived
colours, red, yellow, green and blue, or a combination of two of them" (Finlayson &
Schaefer 2000)..
The calculation for the Hue, in terms of the R, G and B values of an RUB image is given by:
H = cos-1 0.5[(R — (R-B)] (R-G)(R-G)+(R-B) (G-B)
2.2.3.3The Segmentation Process
The third important step in image analysis is related to the separation of objects from
the image background. Segmentation is the process of splitting an image into regions
such that each region is characterised by having relatively uniform properties, such
as grey level, hue or brightness. Segmentation methods can be broadly classified as
grey level or texture-based and can make use of histogram features or edges
identified in the image using an edge detector (such as a Sobel or Canny edge
detector). Normally, medical image processing is based on grey-level segmentation
methods, which sometimes do not produce very clear or relevant results. On the other
hand texture-based analysis is still a complex and challenging problem for image
.1111111•1~
Tar
MI —
- A gel,jogi
...MM At Jail'
- • ,
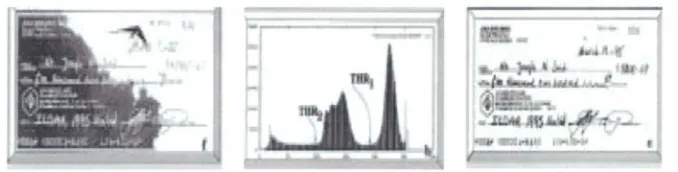
Cheriet, Said and Suen (1998), proposed using Ostu's algorithm, which uses a
threshold value, to segment an image. This algorithm is used for computer vision and
image processing. It uses the image histogram to predict the optimum threshold value
for separating the two classes within an image and so is capable of separating a
foreground from a background. At each recursion, the object with the lowest
intensity is segmented from the given image. The recursive process continues until
only the darkest element is left in the image. This method was trained on 220
real-life bank cheques and tested on another 505 cheques to eliminate their background to
[image:25.560.139.478.269.355.2]facilitate the processing of cheques (see Figure 4).
Figure 4 a) Original image of bank cheque b) Two threshold values c) The output result (Cheriet, Said & Suen 1998)
Similarly, a novel algorithm is reported for analyzing tongue images for improving
the effectiveness of tongue inspection. This algorithm used the HSI color model, as
discussed in section 2.1, for converting the RGB color values into hue, saturation and
intensity values and using its red hue to segment the tongue from the image
background. Later, morphological operations were performed to fill small holes in
the tongue area. Finally, the new generated image was combined with the original
image to produce a successfully separated tongue image (see Figure 5). As result
of this experiment, they segmented the tongue images correctly, but further research
is required for cases where it is necessary to identify a white coating on tongue
(Jian-qiang 2008).
[image:25.560.206.383.628.711.2]II
2.2.4 The Feature Extraction ProcessThis step is also very important for extracting tag-shaped objects from abalone RGB
images. Feature extraction is a process for identifying an essential object in an
image. This process is utilised in a number of fields such as robotics, computer
technology and medical image analysis.
2.2.4.1 Feature extraction in the robotics industry
Guzman and Parra (2007) described the importance of feature extraction in the
robotics and computer vision fields. With the help of feature extraction, it is possible
to reduce unnecessary computation and speed up the process of analyzing images to
detect selected objects from an image.
Guzman and Pan-a (2007) suggested that the robotics community could provide a mechanical automated solution for many problems if robots could clearly visualise
path information. Their study explored different ways for analysing path information
to assist in robot understanding. They analysed the path information from a selected
region, calculating the centroid of the region, along with the direction of the path, to
give useful information to the robot to find the path and guide the control system to
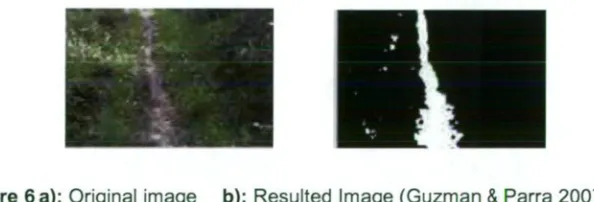
plan and undertake autonomous navigation (Figure 6a and Figure 6b).
Figure 6a): Original image b): Resulted Image (Guzman & Parra 2007)
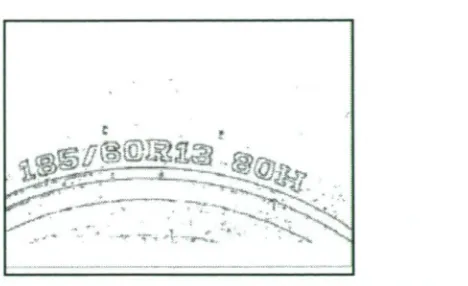
A similar study (Kang et al. 1992) developed a technique for industrial robots that
can recognize and classify industrial objects such as numbers on tires. From this
study, they described the extraction of arcs which form parts of the digits, using a
Hough transformation method, and subsequent use of these for recognition purposes
[image:26.558.171.468.504.605.2]Figure 7 ' Segmentation on tire image with line operator (Kang et al. 1992)
2.2.4.2 Feature extraction for medical imaging analysis
Feature extraction has also been used to identify the hemorrhaged region of a
patient's brain, enabling doctors to determine the position, shape and size of that
region. The best method for identifying parts of the brain is by determining the
position, size and shape of each part of the brain. Therefore, they developed an
automatic image classification system to identify different syndrome types (head
trauma types). Using this tool, doctors can now study different syndrome types and
can educate other medical professionals in this field (Gong et al. 2007). In
conclusion, the feature extraction process is based on extracting geometric features
of each segment within the image, and so this process has potential for determining
the position and orientation of abalone tags based on their centroid coordinates and
their major and minor axes.
2.2.5 Optical Character Recognition
In this project, optical character recognition is an important step in enabling the
machine to analyze the characters that appear on the tags attached to the abalone
shells. This project aimed to extract the tag characters from the image in preparation
for input into an OCR (optical character recognition) system.
There are three main types of methods used for optical character recognition.
Template matching methods match characters from a reference character set with
each of the input characters. Statistical methods perform the character recognition
Literature Review
dimensional vectors. The prototype character whose N-dimensional vector is most
similar to that of the input character is matched to the character. Structural methods
recognise the character on the basis of structural relationships between primitives
(such as individual strokes) of the character (Kang et al. 1992).
A statistical method is used to match input characters to prototypes in Kang's system
for recognising raised characters for rubber tire classification. In their studies, they
proposed a recognition algorithm using sequentially designed rule-based methods.
The characters were divided into groups on the basis of partial width (the ratio of
black pixels to the character width is used). Subsequently, these character groups
were sub-divided using the cross-point and partial projections. Finally the distance
feature (distance from enclosed rectangular window to black points of the character
at several positions) was used to recognise the character among several candidates
(Kang et al. 1992).
Optical character recognition can also be useful in analysing text and then
synthesizing it into speech. This research is useful in enabling humans with impaired
vision to read road signs by recognising the sign and providing a voice output
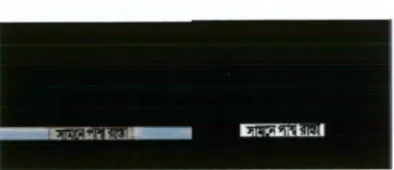
alerting the driver (Hague et al. 2007). The automatic sign translation system used a
digital camera to capture images of road signs, and then employed an adaptive
threshold method to binarise the text block. The text recognition was done using a
neural- network-based OCR. Finally, identified text was converted into a synthesized
voice output. This study reported a success rate of 84.7%, which was considered
reasonable. The 15.3% failure rate of the system resulted from complex backgrounds
behind the text in some of the signs, low intensity signs and multiple sign boards
appearing in the same image frame.
3irszRotiw
i
I
Figure 10: Extracted text area and Binary image (Hague et al. 2007)
Modules Correct Error Text Detection 84.7% 15.3% Segmentation 93.9% 6.1% Character
Recognition 95.7% 4.3%
Whole system 91.4% 8.6%
Figure 11: Test result of proposed System (Hague et al. 2007
In summary, the classification and recognition of objects in images represents a
broad sub-field within robotics and computer vision. Automated image analysis is
particularly important when the manual process is slow and expensive, as in the case
Chapter 3
Methodology
This chapter discuss the methodology for implementing the work undertaken in this
project. The discussion is divided into four sections. Firstly, the platform, tools and
the other requirements needed to develop the application are discussed. The second
section discusses the pre-processing stage of the implementation work. The methods
explained in this section are very important in ensuring the overall success of the
application. The third of these discusses the development of image analysis
techniques which extract individual tags from the image and present them to an
optical character recognition. The final part discusses how the evaluations of the
image analysis techniques are carried out.
3.1. Requirements and Work
The main aim of this research is to develop image-processing techniques for
analysing underwater images to identify tags affixed to abalone shells. The
techniques would enable abalone researchers to identify individual animals and to
track their movement over time. The underwater images of tagged abalone are
collected from Victorian and Tasmanian farms. These farms use land-based tanks to
grow abalone and the images are taken directly from these tanks. The images are in
JPEG format and are about 2000 * 3000 pixels in size, creating difficulties in
handling because of their size. Therefore, the images are reduced in resolution before
other pre-processing functions are carried out on them.
Currently, CSIRO and the Tasmanian abalone farms use Labview software to collect
the images and then NI Vision to estimate abalone lengths. The Victorian farm work
uses digital callipers to obtain length data. This software just gives size information
and, for this process, they need to take each abalone out of its tank to be
the growth and mortality rates in the abalone. Therefore, this image analysis
application development is important because it will enable the images to be
obtained directly from the tanks and then processed in order to monitor abalone
behaviour. The techniques developed in this project could also be incorporated, in
future, with other software to obtain the size of the abalone as well as the value
(heritability information) of the tag attached to its shell.
The main aim of this research is to develop techniques for enhancing the images and
detecting the tags; then determining the colour of each tag and segmenting it from
the background. After the tags have been segmented from the background the
techniques calculate the location of the centroid, and the orientation of each tag,
enabling the tag information to be extracted for further processing.
3.1.2 Development Platform
The MATLAB Image Processing Toolbox is a suitable package for this application.
It offers image-processing tools, which include a wide range of standard algorithms
and graphical tools for image processing and visualisation. It is easy to get access to
these standard algorithms in MATLAB, and it also provides a multi-platform
capability to run programs on any operating system, including Windows or Mac OS
X, that is supported by MATLAB.
3.1.3 Input Data
The input images used for this research are ROB images stored in JPEG format.
There are three categories of images; images with rounded-rectangle tags in a wide
variety of colours, images of abalone with pairs of tags all yellow in colour, and
images with rounded-rectangle tags and round tags in a variety of colours. Each of
these categories of images has tags with different size dimensions and other
3.3 Pre-Processing for Tagged Abalone Images 3.3.1 Size classification
The dimensions of the input images are calculated using the size 0 function and this
can be used to classify the images into each of the three categories described above.
The size 0 function gives the value of XY dimension of images. The second value of
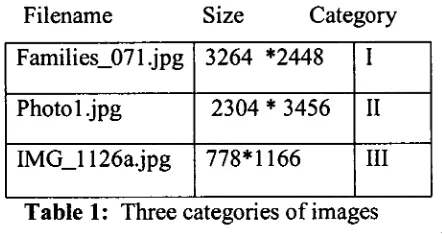
size (file, 2) function is used in this process. As described in Table 1 , the images are categorised according to their sizes.
Filename Size Category
Families071.jpg 3264 *2448 I
Photol.jpg 2304* 3456 II
[image:32.558.196.417.262.379.2]IMG_1126a.jpg 778*1166 III
Table 1: Three categories of images
The next challenge is handling these large files. The main concern is the time it
takes to process these very large images. Therefore, an analysis was done to
determine ways of reducing the size of the images. Category I images could be
handled easily with no significant reduction in quality by using the imresize 0 function to resize the image, reducing it to a manageable level by reducing the
resolution. However, the imresize function was found not only to be suitable for category II images, so these images were cropped into three equal sizes using the imerop 0 function before further processing was carried out. For category III images, there was no requirement to resize or crop the image, because they were
small enough to be processed easily.
3.3.2 Colour Classification
As described in chapter 2, section 2.2.3.2, the colour values in an image can easily be
calculated using the HSI colour space where the Hue value is important as an
intuitive cue to identifying the tags' colours. Basically, the objective is to select tags
of particular colours from the input image. Each tag colour is identified separately.
0.1 0.2 0.3 0.4 0.5 0.6 0.7 0.8 0.9 3500 -
3000
2500
2000
1500
1000
500
implementation, the HSI (Hue, Saturation, and Intensity) colour space was used for
colour segmentation.
The first step involves identifying which colours in the image are associated with
which Hue values in the histogram after converting the image from RGB to the HSI
colour space. This process involves manually observing the values from the
histogram. For example, the colour yellow is found between hsilmage (:,:, 1)>0.17
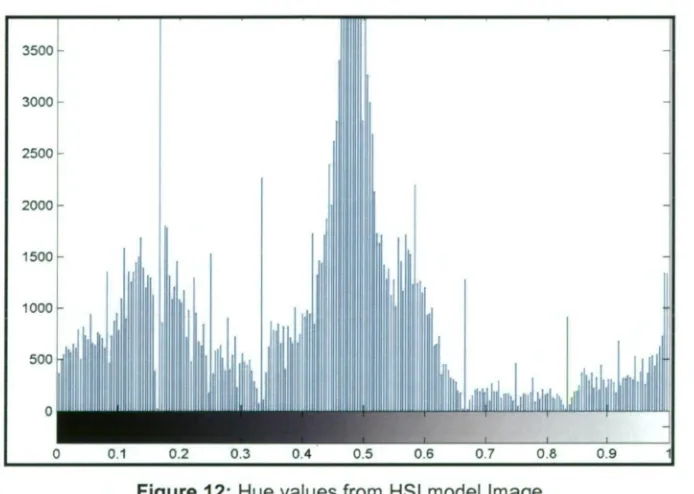
&& hsilmage (:,:, 1)<0.2. The histogram produced from a category I type image is
[image:33.558.136.483.272.519.2]shown in Figure 12.
Figure 12: Hue values from HSI model Image
However, manually observing the colours associated with particular values of a
single histogram are not suitable for all images. Therefore, selection on the basis of
"angle of hue" provides more reliable results than analysing colour values via the
histogram of hue values. Hue can be calculated from the RGB image using the
following formula.
H = cos' 0.5[(R — G) + (R-B)]
N
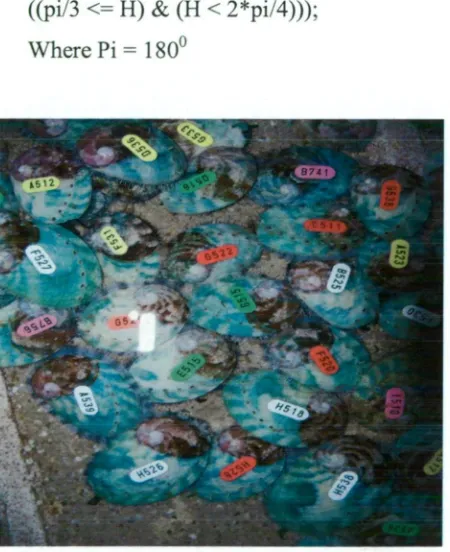
(R-G)(R-G)+(R-B) (G-B)Colour at 0, yellow at 60, green at 120, cyan at 180, blue at 240 and magenta at 300
[image:34.558.147.469.120.336.2](see Figure 13).
Figure 13 HSI Colour Space (Hengl 2003)
Therefore, it is possible to calculate threshold values that can operate on a
combination of hue, saturation, and intensity by using different colour angles. For
example, to identify yellow coloured tags in HSI images (see Figure 15), one would
calculate the hue angle value H using the formula above and then extract all pixels
for which:
((pi/3 <= H) & (H < 2*pi/4)));
Where Pi= 180°
[image:34.558.195.420.464.740.2]Figure 15: Results of identifying Yellow tags
3.3.3 Noise Removal and Background Detection
After identifying pixels with a particular colour within the image, the next task is to
remove all pixels that don't belong to a tag of that specified colour. The background
in this image is tank concrete and that surface can produce yellow-coloured pixels
that could be recognised as belonging to a yellow tag. To remove the pixels, the
following method can be used.
This first step is completed using the im2bw 0 function, which produces an output image in which all pixels in the input image with luminance greater than a specified
threshold level are given the value 1 (white) and all other pixels are given the value 0
(black). The threshold level used here can be calculated using Ostu's Algorithm
(Cheriet et al. 1998) as discussed in chapter 2.
3.3.4 Tag Segmentation
This processing task involves segmentation of the tags from the surface of the
•
Reconstruct he Image Colour Segmented input image
Intensity Threshold
• Morphologica opening
I=irci2bw (colsegfile, 0.8)
se=strel crectang1e',[4AD, Il=imopen (I, se),
reImage = =reconstruct (min (IL
Output Image
obtain more accurate and smoother images. The structuring element used for the
dilation and erosion is a 4* 4 pixel rectangle. Flow chart 1, illustrates how this
morphological processing is carried out for each image (Figurel6 and 17).
[image:36.558.150.481.83.773.2]Flow Chart 1: Image segmentation using morphological operators
0"
il•
[image:37.556.159.466.67.337.2]0
Figure 17: Image after Morphological Processing
The next step in this segmentation process involves labelling each separate object
within the image. This process labels all groups of connected pixels in a binary
image (with the option of setting the connectedness level to 4- connected or 8-
connected). This process produces an image in which each pixel
has
a value that is the label of the group (or object) to which it belongs. It also gives the number oflabelled objects in the image.
The final step in this process involves calculating the regional descriptors of each
labelled object in the image. The information obtained from the region descriptor
includes the area of the object region, the centroid, which provides the position of
centre of mass of the object, the length of the major and minor axes of the region,
and finally the orientation of the region.
3.4 Analysis
3.4.1 Area Estimation
Even after performing the segmentation process there are some objects in the images
any objects which fall outside this area range (either smaller or larger) are rejected as
not being tags.
3.4.2 Rectangle Fitting and Rotation
The next step involves plotting a rectangle around each object that has been
identified as a tag. The centroid location, the major axis and minor axis lengths and
the object orientation can be used to do this, using the following equations:
x = Centroid (1) — MajorAxisLength/2
y = Centroid (1) — MinorAxisLength/2
Width = MajorAxisLength
Height = MinorAxisLength
xpointslx x+Width x+Width x x]
ypoints=[y y y+Height y+Height y]
plot(xpoints, ypoints).
[image:38.558.108.501.444.780.2]The rectangle is rotated through the angle represented by the object orientation,
3.4.3 Extracting Tag Sub-images
This next step in the image analysis process is to extract a sub-image for each tag in
the original image and prepare it for presentation to an optical character recognition
system. The characters on extracted tag images are aligned in a horizontal direction.
The orientation value can be obtained using the region descriptor function
(regionprops).
As described in section 2.2.1, category III images include round tags and, in this
case, it is not possible to compute the orientation from the outline of the tag.
Therefore, these category images will require a different process to determine the
orientation of the tag.
3.5 Optical Character Recognition
This is the final step in the image analysis process. Currently a template matching
method is used to recognise the character from extracted tags. There are certain steps
that need to be considered before applying a template matching operation to the
characters. These are:
- removing the unwanted pixels around the border.
- creating a skeleton of the character
- performing an erosion operation to separate characters
- re-filling holes in the characters that are produced by the erosion operation.
- applying the template matching optical character recognition function to read the
characters on the tag.
3.6. Evaluation
For the evaluation process, five images were selected for training and six for testing.
The evaluation was carried out as follows:
Firstly, the positions and colours of all the tags in these images were observed
Secondly each tag was outlined manually using the region of interest tool in
MATLAB. This produces a binary image of the manually selected region and with
the selected region it is easy to identify the orientation, major axis and minor axis of
each tag. These results can also be subsequently compared with results produced
automatically by the image analysis system.
The methodology chapter described the tasks undertaken by the image analysis
system and how the system was evaluated. The system produced some useful results.
However, the results obtained vary significantly with the nature of the input data.
For example, images obtained from dark areas or taken from too far away in the tank
produce poorer results. In conclusion, any input images presented to the image
analysis system need to be clearly human readable before the system is likely to
Chapter 4
Results and Discussion
This chapter presents the evaluation of the final application. The discussions are
divided into three main sections. In the first section, the image classification and
analysis results are discussed. The second section discusses the system accuracy and
presents the tag extraction image output results, including a comparison of the
accuracy of the system with manual analysis of the abalone images. The final section
discusses the optical character recognition system.
4. 1 Image Analysis Process
The image analysis system was developed using five images, containing
approximately 18-20 tags each, and four images, also with about the same number of
tags in each, were set aside for testing. To achieve the desired results, the system
uses a set of operations for identifying the colour values, segmenting the tags from
the background, and finding the tag colour after extraction of each tag. Finally, the
extracted tags are prepared for optical character recognition.
As described in Chapter 3, the images were divided into three categories according to
size. After being classified, the images were either cropped or resized to contain
approximately 500* 500 pixels. The third category of images can easily be processed
without resizing. The reason for resizing images is to increase the speed of
processing to get the final output. Table2 shows the times taken to process the three
Filename Size Category Total Time (sec) Families_072.jpg 3264 * 2448 I 18
Photo4.jpg 2304 * 3456 II 20
[image:42.558.139.480.110.220.2]IMG_1126a.jpg 778*1166 III 20
Table 2: Time taken to process each Image
As described in Chapter 3, the colour values from an image can easily be identified
within the HSI colour space. For this process, colour values were identified as
described in Table3. The value of H (the Hue) was computed as hsiImage (:, :, 1). Similarly, the Saturation was computed as hsiImage (:, :, 2), and the Intensity as hsiImage (:, :, 3). The first step is to identify the colour values. Hue values were considered most appropriate for colour thresholding, not Saturation or Intensity,
since these just provide the depth of the colour or the brightness of the object.
Colours Hue Colour Values
Yellow pi/4 <= H & H < p1/2
Green 2*pi/3 <= H & H < 3*pi/4
White pi <= H & H < 1.2*pi
Blue
3•45*pi/3 <= H 3•7*pi/3
& H <
Pinlc 5*pi/3 < H) 5•5*pi/3) & (H <=
Red 5.5 * pi/3 < H
Pi) •
& H <2 *
Total Accuracy in Colours
estimation
99%
[image:42.558.130.473.432.682.2]4.2 Tag Segmentation
The segmentation process was carried out in three steps in order to get a better output
result from the system. The first step involves the segmentation of the foreground
object from background noise. This step was completed with the im2bw() function.
This function replaces all pixels in the input image, with luminance greater than a
selected level, with the value 1 (white) and all other pixels with the value 0 (black).
The next step was to label each region and to create a region descriptor for those
regions. In addition, the width and height of an object was estimated using the minor
and major axis lengths of each region, and then the area of each labelled object was
calculated.
Table 3 describes the results from the segmentation. There were 50 objects in the
test images that were identified manually as tags. Of these 50 tags, those that were
successfully identified automatically by the system as tags are called "true positives".
Those that were not identified as tags are called "false negatives" and objects that
were identified as tags by the system but were not real tags in the image are called
"false positives". The Overall Accuracy is defined as the number of true positives
divided by the total number of tags (identified manually) while the False Positive
Rate is defined as the number of false positives divided by the total number of tags
(identified manually). The aim is to maximise the Overall Accuracy of the system,
whilst still maintaining an acceptably low False Positive Rate. The images used for
testing the system are shown in Figures 19, 20, 21 and 22.
As indicated in Table 4, the system identified 78% of the tags from the four images
Fi gure 2 0 : Si ngle Tagged Abalone I mage (provided by CMAR) Fi gure 1 9 : Si ngle Tagged Abalone I m age (provided by CMAR)
Tabl e 4 : Fi nal Result of the Tag Segm entation Process False positive rate (false positives/total tags)
Overall Accuracy (true positives/total tags)
sa npiso d aged jo ncitu nN sanua 'au asp d Jo loci tunN sangiso d arui jo nquinN Jo nqu iriN iri oi
C:7'
■
,1■■ .■■■ <A.4 '..0
Figure 21: Triple Tagged Abalone Image (provided by CMAR)
Figure 22: Single Tagged Abalone Image (provided by CMAR)
4.3 Extraction of Tag Sub-images
This process involves the extraction of a rectangular sub-image, containing each tag,
from the original RGB image. The reason for using the original image was because
the quality of characters is low on the binary image after the dilation and erosion
operations have been performed on it. The values retrieved from the binary image
such as tag position, width and height, and orientation assist in extracting the tag
object from the original image (Table 5, Table6, Table 7 and Table 8). The resulting
extracted tag image is always oriented in a horizontal direction so it can be presented
to the optical character recognition system in standard way. The centroid positions,
heights, widths and orientations for all objects detected as tags in the four test images
are presented in following tables.
Objectes geometric attributed identfied as Tags in image Manual object identification
Tags Width Height X Y Orientation
1 44 23 31 64 26.934 Tag
2 41 23 57 327 45.392 Tag
3 45 17 69 417 1.7153 Tag
4 49 22 105 100 12.8637 Tag
5 45 27 121 173 62.1772 Tag
Tag
6 45 27 131 281 33.6307
Tag
7 41 27 219 172 61.7583 Tag
8 50 22 272 116 11.7271 Tag
9 37 25 269 402 88.1213 Tag
10 35 28 323 360 71.1314 Tag
11 51 24 337 149 3.5596 Tag "
12 39 23 356 80 55.7356 Tag
13 41 23 395 196 17.2988 Tag
[image:46.559.85.513.320.774.2]14 44 26 448 413 64.4005
Objectes geometric attributed identfied as Tags in image Manual object
identification
Tags
Width
Height
X
Y Orientation
•
1
98
48
198
119 4.2652
TagTag
2
78
. 32
418
15 3.8476
Tag .3
88
43
455 428 5.6566
Tags
Width
Height
X
Y Orientation
Tag1
80
44
125 180 0.8872
Tag.2
102
46
293 341 4.4763
Tags
Width
Height
X
Y Orientation
Tag1
77
42
167 176 4.444
Tag2
112
40
441 388 4.4061
Tag [image:47.559.68.500.162.559.2]3
71 •
44
472 84 9.4398
Objectes geometric attributed identfied as Tags in image Manual object identification
Tags
Width
Height
X
Y Orientation
1
56
30
17
363 56.2126
Tag2
61
31
107 280 61.8033
notTag
3
113
57
151
173 12.4856
Tag4
67
30
141 49 32.5311
Tag5
59
35
160 353 49.1255
Tag6
75
30
173 444 14.5722
Tag7
68
33
184 240 29.7932
Tag8
78
28
253 111 3.9939
Tag9
65
34
273 312 32.2869
Tag10
69
36
304 67 26.3671
Tag11
63
34
289 404 89.4371
Tag12
58
33
352 253 82.5532
Tag13
64
57
376 132 23.8396
Tag14
54
35
373 472 46.5481
Tag
[image:48.559.89.497.98.569.2]15
65
28
456 66 28.4658
Tag
Objectes geometric attributed image
identfied as Tags in Manual object identification
Tags
Width
Height
X
Y Orientation
1
32
20
42
343 18.5382
Tag2
64
55
202
295 36.7512
Tag3
58
40
214 86 89.3833
not Tag
not Tag
4
44
21
324
215 5.175
not
Tag
5
68
45
344
364 60.6919
Tag6
31
24
359
292 1.3348
not Tag
7
34
27
402
161 30.8086
not Tag
8
79
33
434
317 76.5475
Table 8: Results on Object attributes (Figure 22)
[image:49.559.45.506.54.815.2]