promoting access to White Rose research papers
White Rose Research Online [email protected]
Universities of Leeds, Sheffield and York
http://eprints.whiterose.ac.uk/
This is an author produced version of a paper published in Wear.
White Rose Research Online URL for this paper:
Published paper
Gonzalez-Valadez, M., Baltazar, A., Dwyer-Joyce, R.S. (2010) Study of
interfacial stiffness ratio of a rough surface in contact using a spring model, Wear, 268 (3-4), pp. 373-379
Study of Interfacial Stiffness Ratio of a Rough
1Surface in Contact Using a Spring Model
23
M. Gonzalez-Valadez 1,2
, R.S. Dwyer-Joyce 2
, A. Baltazar 3 4
1
CIATEQ, A.C., Av. Manantiales 23-A, Parque Industrial Bernardo Quintana, Querétaro, México.
5
C.P. 76246.
6
Tel. number: +52 (442)1961500 Ext. 4225; Fax number: +52 (442) 1961500 Ext. 4231. Email
7
address: [email protected]
8 2
The University of Sheffield, Department of Mechanical Engineering, Mapping St., Sheffield, 9
S1 3JD, UK. 10
11 3
CINVESTAV- Unidad Saltillo, Robotics and Advanced Manufacturing Program, Carr. 12
Saltillo-Monterrey km 13.5, Ramoz Arizpe, Coahuila, México. 13
14
Abstract
15
This study proposes the use of a simple spring model that relates the interfacial stiffness with 16
the complex reflection coefficient of ultrasound in a rough contact. The spring model cannot 17
be directly related to the real area of contact as this depends on the amount, shape and 18
distribution of contacting asperities. However, it is clear that the model provides a non 19
destructive tool to easily evaluate both longitudinal and shear interfacial stiffnesses and their 20
ratio. Experimental findings indicate that the interfacial stiffness ratio Kτ/Kσ determined 21
during loading/unloading cycles is sensitive to the roughness level and load hysteresis. The 22
results deviate from the theoretical available micromechanical models, indicating that actual 23
contacting phenomenon is more complex and other variables needed are not accounted for by 24
the models. 25
26
27
30
Introduction
31
The problem of mechanical contact of two elastic bodies has been of great interest to the 32
scientific community. This has been mainly triggered by the need to predict contact area 33
relevant in engineering to mechanical, electrical and heating conduction analysis. For two 34
nonconforming surfaces the properties of the interface depends on the random contact of the 35
surfaces. In a contact between rough surfaces only very few asperities go into contact. 36
Therefore, high local stresses take place at the individual asperity tips causing an immediate 37
plastic deformation and forming cold-welded junctions between the metal surfaces. 38
Additionally, with the application of normal loading-unloading cycles, hysteresis 39
phenomenon due to elastic and plastic deformation has been reported in the literature (i.e. [1], 40
[2], [3]). 41
The development of experimental tools to investigate rough contact has been a slow 42
ongoing process. Methods based on electrical and thermal conduction, measurement of fluid 43
flow through the contact and the neutron-graphic method are useful to calculate real contact 44
area but cannot provide an estimation of interfacial stiffness [4]. Kendall & Tabor [5] have 45
found different drawbacks with the methods based on electrical and thermal conduction as 46
well as with optical methods when used in real engineering contacts. When two nominally flat 47
specimens are pressed together by normal force, the deformation of asperities can be recorded 48
by means of an electric micrometer or by the stylus of a profilometer. However, in practical 49
applications, the results need to be refined by eliminating the effect of surface deformation in 50
the test machine. Krolikowski & Szczepek [4] indicated that using the method based on direct 51
measurements of compliance, the measurable limit of interfacial stiffness of a rough contact is 52
From the original independent investigations carried out by Kendall & Tabor [5] and 54
Tattersal [6], it was clear that the reflection coefficient of ultrasound can be related to the 55
interfacial stiffness of a rough contact by means of a spring model; however, it is not directly 56
related to the actual contact area as it was hypothesized in their study. Therefore, the results 57
show serious disadvantages of the method, but it can be a powerful tool when the stiffness is 58
the main parameter to assess. In fact, in this paper the ratio of tangential to normal stiffness is 59
evaluated utilizing the spring model of Kendall & Tabor [5]. 60
Several theoretical approaches have been developed that can be applied to the contact 61
between two nominally flat surfaces, one smooth undeformable against a rough deformable 62
with isotropic statistical properties of roughness [7, 8, 9, 10]. Although the models work for 63
idealized shape of asperities and non-interacting assumption, an estimation of the real area of 64
contact and nominal pressure can be obtained. 65
Studies on normal stiffness have been reported more often than on shear interfacial 66
stiffness. However, the use of both normal and shear stiffness expressed as a ratio can be used 67
to determine the nature of contact [11]. The shear stiffness can be obtained from a pre-68
stressed condition in which a normal load to the interface is followed by a small shear force. 69
This is a special case which requires only the application of a small elastic dynamic shear load 70
(pre-stressed interface). Ultrasonic shear waves applied in this way deform the interface only 71
elastically because of the small-scale loading-unloading cycle, centered on the static stress 72
[3]. Therefore, no additional plastic deformation at the asperities occurs independently of the 73
state of the deformation of asperities produced by the normal load. Berthoud and Baumberger 74
[12] reported direct measurements of shear stiffness versus displacement on a pre-stressed 75
rough interface. The experiments have provided evidence that indicates that a multi-contact 76
interface subjected to the small shear deformations has an elastic response. Ultrasonic studies 77
The ratio of interfacial stiffness ratios has been anticipated as an important parameter to 79
characterize an imperfect interface. Nagy [11] presented a comprehensive review to show 80
how this can potentially be used to distinguish perfect contact from kissing, slip, or partial 81
contact. For rough surfaces, the possibility of distinguishing welded condition has been of 82
interest. Recently, several works on the interfacial stiffness ratio from a rough interface have 83
been published [12, 15, 16] where loading and unloading cycles on the interface were applied. 84
The analysis carried out by Krolikowski & Szczepek [16] which combines the contact 85
model of Greenwood & Williamson [8] with the equation of Johnson [17] for small 86
tangential displacement, revealed that the ratio of tangential to longitudinal stiffness is solely 87
dependent on the Poisson ratio of the contacting rough surfaces. Similarly, by using the 88
equation of Hisakado & Tsukizoe [18] for small tangential displacements of contacting 89
asperities, Sherif & Kossa [15] also concluded that the ratio of stiffnesses can be calculated 90
only from the Poisson ratio of both surfaces in contact. 91
Recently, Baltazar et al. [14] described a theoretical model, similar to the previously 92
obtained by Krolikowski & Szczepek [16] and Mindlin [19], but which includes a correction 93
factor accounting for the angle of misalignment. Predictions of the model are very close to 94
those made through the Sherif & Kossa approach [15]. Additionally, a slight increase in the 95
ratio of stiffnesses observed on increasing nominal pressure was attributed to misalignment at 96
a single asperity contact. The model is again non dependent on the distribution of contact 97
asperities. 98
Yoshioka & Sholtz [20] provide a comprehensive model of elastic contact that allows for the 99
oblique contact in both the normal and shear directions. Nagy [11] worked with the original 100
approach of the model of Yoshioka & Sholtz [20] for a chi squared distribution of asperities. 101
It was found that the ratio of tangential to longitudinal stiffness is exclusively dependent on 102
This work has three objectives: first, to develop a phenomenological understanding of the 104
correlation between interfacial stiffness ultrasonically determined and the state of deformation 105
of a rough surface; second, to determine interfacial stiffness ratio Kτ/Kσ for different 106
roughness levels; and third, to investigate the hysteretic behavior of Kτ/Kσ and its relationship 107
to the deformation of asperities at the interfaces. 108
109
Micromechanical Description
110
Krolikowsky and Szczepec [16] provide a mathematical formulation that incorporates the 111
Hertz-Mindilin theory [19] and the contact model of Greenwood and Williamson [8]. The 112
method models the complex contact between rough surfaces as a normally distributed set of 113
elastic spheres contacting against an elastic plane of the same material loaded with a normal 114
force f and a tangential force s [19, 21, 22]. Both mean contact pressure P, and mean 115
tangential stress τ, are as follow 116
R x t x dx v
E D P
t
s ( ) ( )
) 1 ( 3
2 1/2 3/2 3/2
2 σ ∫ − φ
−
= ∞ , (1) 117
R x t x dx v
v E sD
t
s ( ) ( )
) )( (
/ /
/ σ φ
τ 12 1 2 1 2
1 2
2 ∞∫
− +
−
= , (2)
118
where Ds is the summit density per unit area, R is the radius of curvature of the elastic sphere, 119
E is Young’s modulus, v is the Poisson’s ratio, σ is the variance of summit height distribution, 120
x is the normalised height of summits, t is the normalised separation and φ(x) is the 121
normalised height distribution function of the summits. 122
∫
∞ − − = − = t / / /s R (x t) (x)dx
E D dt dP
K σ φ
ν σ
σ 2 1 2 1 2 1 2
1 1
, (3) 124
∫
∞ − + − = = ts R x t x dx
v v E D ds d
K ( ) ( )
) 1 )( 2 (
2 1/2σ1/2 1/2φ τ
τ . (4)
125
Combining Equations (3) and (4) yields the tangential to the normal contact stiffness ratio 126 ) ( ) ( A K K ν ν σ τ − − = 2
1 , (5)
127
with A=2, which is also identical with that for the elementary contact previously formulated 128
by Mindlin [19] and more recently by Johnson [7] for two spherical bodies in contact. The 129
form of equation (5) has been corroborated in several studies which differ basically in the 130
values of the coefficient A. For instance Sherif & Kossa [15] found a theoretical value 131
forA=π /2. For the model of Yoshioka & Sholtz [20], Nagy [11]obtained an approximated 132
value forA≈0.71. In the model presented by Baltazar et al. [14], A has a changing value 133 expressed as 134 ψ ξ 2 =
A , (6) 135
where ξ andψ are correction factors accounting for the geometrical misalignments in respect 136
to shear and longitudinal directions, respectively [23]. The factor ψ takes values of about 1 137
for angles below 50° assuming non-slip condition at the asperities. The factor ξ typically was 138
found to vary between 0.6 and 0.8. 139
140
Ultrasonic Response of a Rough Surface Contact
141
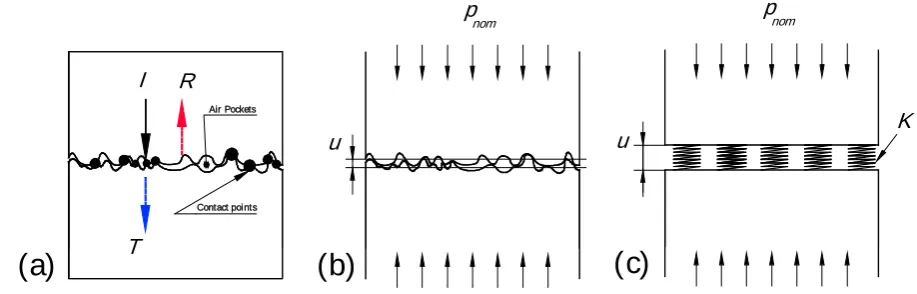
Figure 1a schematically shows the reflection of a sound wave from a rough surface 142
interface. At the contact region sound waves would pass through while at an air gap it would 143
known as the reflection coefficient, R. Conversely, the amplitude of the incident wave 145
transmitted trough the contact spots is the transmission coefficient, T (see figure 1). 146
Thus for two like materials, the reflection coefficient varies from R=0 for complete contact 147
to R=1 for no contact (i.e. a solid air interface). If the nominal pressure across the interface is 148
increased, asperity tip deformations cause both the interface to close slightly and the real area 149
of contact to increase. Kendall and Tabor [5] showed that when the wavelength of the 150
ultrasonic wave is large compared with the size of the asperity contacts, the reflection is a 151
function of the interface stiffness, K. As a consequence of the simple quasi-static spring 152
model, the reflection coefficient can be found as (shown schematically in figures 1b and 1c) 153
2 2 1
1
+ =
z K R
ω
, (7) 154
where z is the acoustic impedance of the material on either side of the interface and ω is the 155
angular frequency of the ultrasonic wave. This relationship holds for both longitudinal and 156
shear wave reflections (the longitudinal and shear wave speeds are used, respectively). A 157
similar expression exists for two dissimilar materials pressed together [24]. This model has 158
been used extensively to study the reflection and transmission of sound across incomplete 159
interfaces [2, 4, 11, 13]. 160
Drinkwater et al. [25] demonstrated that the stiffness of a range of contacts of varying 161
roughness is well represented by equation (7). They studied the reflection as a function of the 162
frequency of the ultrasonic wave. The reflection coefficient was found to be dependent on 163
Air Pockets
Contact points
I R
T
p nom
u
nom p
u K
(a)
(b)
(c)
[image:9.595.80.539.69.216.2]165
Figure 1. Scheme showing a representation of the ultrasonic response of rough surface contact, a)
166
reflection, b) loading and deflection, and c) the spring model representation.
167
168
Experimental Set-up
169
Figure 2 shows the loading frame and the arrangement of the ultrasonic equipment used in 170
the tests. Two ultrasonic pulser-receivers were arranged to make it possible for the 171
longitudinal and shear signals to simultaneously be processed. The specimens were subjected 172
to loading-unloading cycles of compressive pressure in a hydraulic frame operating in load 173
control mode. The upper specimen had a disk of piezoelectric material glued to the back face 174
with a temperature stable contact adhesive. The transducer was of the wrap around electrode 175
type so both wires could be soldered directly to the top face of the ≈5MHz shear wave 176
transducer. The lower specimen was interrogated by means of a 5MHz longitudinal wave 177
planar contact transducer. The upper specimen was loaded against the lower specimen, 178
through an annulus with a hemispherical cap. The hemispherical end piece allowed the upper 179
specimen to align against the lower in order to obtain a more distributed and conformed 180
contact. 181
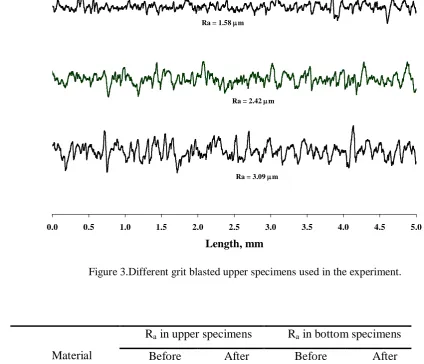
The contacting interfaces were made from steel specimens. The contacting face of the bottom 182
specimens were ground and polished, while those of the upper specimens were grit-blasted 183
(see Figure 3). All surfaces were measured using a surface profilometer before and after the 184
Loading Rig
UPR 2
Ultrasonic Pulser ReceiverPC and driver software Digital Oscilloscope
5MHz Longitudinal wave planar contact transducer
Contact interface
Contact area = 95 mm2
Ultrasonic Pulser Receiver
UPR 1
Piezoelectric Crystal
5MHz Shear Wave Contact
186
Figure 2. Schematic diagram showing loading rig, specimens and ultrasonic measuring apparatus.
187
188
189
Two ultrasonic pulser-receivers (UPR) were used to generate simultaneously voltage 190
pulses to actuate the transducers. Both shear and longitudinal transducers had a central 191
frequency of 5 MHz. The reflected pulses were received by the digital oscilloscope, 192
amplified, and passed to the PC for signal processing. 193
Before both specimens are pressed together, a reference signal of ultrasound is taken. This 194
signal is taken at the point where no contact exists. In these cases the entire incident waves, 195
shear and longitudinal, at the interface are reflected completely (and virtually none is 196
transmitted at the metal-air interface). The assumption that the incident wave fully reflects in 197
an interface of solid-air, is backed by the fact that air poses very low acoustic impedance (400 198
Ns/m3), as opposed to steel (47x106 Ns/m3). This is the reason why air is considered a pure 199
reflector or mirror to ultrasound. These signals are therefore equivalent to the incident signals, 200
0 20 40 60 80 100 120
0.0 0.5 1.0 1.5 2.0 2.5 3.0 3.5 4.0 4.5 5.0
Length, mm
Ra = 1.58 µm
Ra = 3.09 µm Ra = 2.42 µm
[image:11.595.59.484.98.462.2]202
Figure 3.Different grit blasted upper specimens used in the experiment.
203
204
205
Material
Ra in upper specimens Ra in bottom specimens
Before
Loading
After
Loading
Before
Loading
After
Loading
Grit-blasted steel 1 1.58 1.18 0.03 0.07
Grit-blasted steel 2 2.42 1.52 0.04 0.16
[image:11.595.66.472.424.566.2]Grit-blasted steel 3 3.09 1.82 0.04 0.13
Table 1. Roughness before and after test (sample length 5 mm, each result is an average of three
206
profiles). Both specimens are made up of steel.
207
208
The test specimens are then loaded together and subsequent reflected pulses are recorded. 209
The load is applied gradually by steps until reaching a maximum nominal pressure of 210
400MPa. The loading steps consist basically of applying the load from zero to the maximum 211
with a tension-compression machine. In the same way, the unloading process is executed by 212
interface not be downloaded completely as this would involve a different set of asperities to 214
come into contact in the next loading-unloading cycle. 215
A Fourier transform is performed on both the reflected and reference signals; dividing one 216
by the other gives the reflection coefficient spectrum. For a rough surface interface this 217
reflection coefficient depends on the frequency. Equation for the reflection coefficient 218
(Equation (7)) is then used to obtain the interfacial stiffness which should be independent of 219
frequency. In practice, there is little statistical variation due to noise in the signal, and a mean 220
stiffness is determined for all frequencies within the transducer´s bandwidth. More details of 221
this method for determining interface stiffness ultrasonically can be found in Dwyer-Joyce et 222
al. [2]. 223
224
Results
225
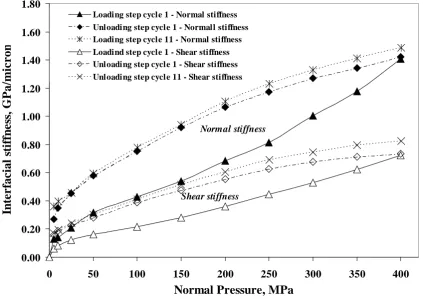
Figures 4, 5 and 6 show the experimental results of interfacial stiffness versus normal 226
pressure. Both interfacial stiffnesses, shear and longitudinal, were calculated with equation 227
(7). Acoustical impedance z, for shear and longitudinal waves were calculated uisng typical 228
values of speed of sound for steel: 5900 m/s and 3100 m/s, respectively [26]. It can be 229
observed that the normal stiffness during the loading step of the first cycle in terms of normal 230
pressure follows an approximate linear relationship [27, 28]. This behaviour has previously 231
provided a simple calibration route for maps of contact stiffness and other studies [29]. It is 232
clear that to predict the normal pressure from stiffness measurement in a contacting joint, their 233
roughness has to be reproduced in laboratory specimens and the predictions would only be 234
useful for the first loading. 235
The curve of the unloading process in all cases follows a different path than that of the 236
loading on the contact interface always surpasses the elasticity of asperities and therefore 239
occurs in elasto-plastic conditions [3]. The ultrasound is not strongly affected by the plasticity 240
of the contact, and it depends basically on the increase of contact area with load. 241
After the first loading-unloading cycle, and to ensure that remaining plasticity is fully 242
removed and the contact is occurring in elastic conditions, 10 more complete cycles were 243
applied. Under these conditions, the normal and shear deformations are caused by the passage 244
of a very small displacement wave, which causes only elastic deformation. The results also 245
show that there is a small increase in interfacial stiffness possibly due to plastic deformation 246
being added at the end of each loading cycle. The reason for this phenomenon is not fully 247
understood. However, in a recent study, Gonzalez & Dwyer-Joyce [30] found that two things 248
can be producing such an effect: stress relaxation and creep which happens when a stress is 249
sustained for a period of time. 250
0.00 0.20 0.40 0.60 0.80 1.00 1.20 1.40 1.60 1.80
0 50 100 150 200 250 300 350 400
Normal Pressure, MPa
In
te
r
fac
ial
s
ti
ffn
e
ss
, G
P
a/
mi
c
r
on
Loading step cycle 1 - Normal stiffness Unloading step cycle 1 - Normall stiffness Loading step cycle 11 - Normal stiffness Loadind step cycle 1 - Shear stiffness Unloading step cycle 1 - Shear stiffness Unloading step cycle 11 - Shear stiffness
Shear stiffness Normal stiffness
[image:13.595.91.515.411.710.2]251
Figure 4. Normal pressure vs. interfacial stiffness for a steel-steel interface. The upper specimen had a
252
roughness value Ra=1.58 µm before test.
0.00 0.20 0.40 0.60 0.80 1.00 1.20 1.40 1.60 1.80
0 50 100 150 200 250 300 350 400
Normal Pressure, MPa
In te r fac ial s ti ffn e ss , G P a/ mi c r on
Loading step cycle 1 - Normal stiffness Unloading step cycle 1 - Normal stiffness Loading step cycle 11 - Normal stiffness Loading step cycle 1 - Shear stiffness Unloading step cycle 1 - Shear stiffness Loading step cycle 11 - Shear stiffness
Normal stiffness
Shear stiffness
[image:14.595.106.503.71.363.2]254
Figure 5. Normal pressure vs. interfacial stiffness for a steel-steel interface. The upper specimen had a
255
roughness value Ra=2.42 µm before test.
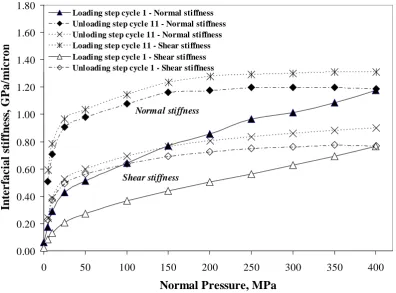
256 257 0.00 0.20 0.40 0.60 0.80 1.00 1.20 1.40 1.60 1.80
0 50 100 150 200 250 300 350 400
Normal Pressure, MPa
In te r fac ial s ti ffn e ss , G P a/ mi c r on
Loading step cycle 1 - Normal stiffness Unloading step cycle 11 - Normal stiffness Unloding step cycle 11 - Normal stiffness Loading step cycle 11 - Shear stiffness Loading step cycle 1 - Shear stiffness Unloading step cycle 1 - Shear stiffness
Normal stiffness
Shear stiffness
258
Figure 6. Normal pressure vs. interfacial stiffness for a steel-steel interface. The upper specimen had a
[image:14.595.106.503.432.725.2]To simplify the plots, in figures 4, 5 and 6 only the curves of the loading step of cycle 11 are 261
shown. It is important to notice that one could use either the loading curve or unloading curve 262
as the values are basically the same. The values of stiffness are higher for the contact interface 263
with the least roughness. In the three different samples, the shear stiffness produces similar 264
curves to those of normal stiffness. 265
266
Analysis and Discussion
267
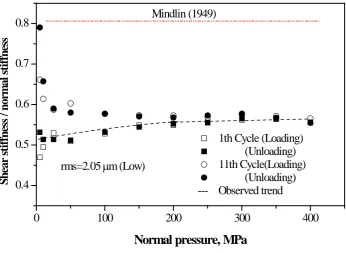
Figures 7- 9 show plots of longitudinal stiffness ratio as function of normal pressure. In 268
addition, the theoretical predictions found in previous literature are compared to the 269
experimental results (Figure 10). Data from the 1st and 11th loading-unloading cycles were 270
used for comparison. This makes it possible to see what happens in an elasto-plastic contact 271
(first loading-unloading cycle) and in a pure elastic contact (eleventh loading-unloading 272
cycle). Equation (5) with a Poisson ratio ν=0.3 was used to estimate the theoretical 273
predictions. Our experimental results show a dependence of Kτ/Kσ ratio on load and rms 274
roughness. For higher values of roughness, Kτ/Kσ has a larger mean value. Also, it can be seen 275
that for high values of roughness there is an increment in the variation rate of Kτ/Kσ. Clear 276
hysteresis is observed for mild and high rms roughness (Figures 7 and 8), and almost none 277
detected for smooth surface. In the last case, a region of constant load independent ratio is 278
observed. The results indicate an apparent sensibility to plastic deformation during the first 279
cycles and almost none existent for additional loading cycles. 280
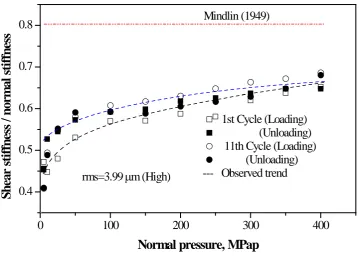
In the cases studied, the results deviate from the theoretical values predicted by Mindlin 281
[19]. It can be seen that only for high pressure (Figures 8 and 9) the values approach 282
theoretical ones in Eq. (5) with A=2. It is interesting to note that the lower ratio values are 283
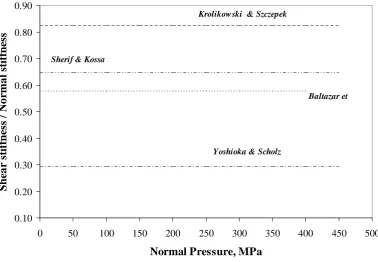
The results for smooth surface shows some agreement with theoretical predictions of 285
Sherif & Kossa [15] and Baltazar et al. [14]; this last is estimated assuming an average value 286
of the correction factor ξ =0.7. Only for this case, it can be suggested that the stiffness ratio is 287
solely dependent on Poisson´s ratio, and virtually constant for both elasto-plastic contact and 288
pure elastic. The reason for the behavior which in principle could indicate a fixed relationship 289
(i.e. load independent ratio) between normal and shear stiffness at some pressure value needs 290
further investigation. Even though some theories agree with experimental results, it is also 291
observed that the equation in Krolikowski & Szczepek [16] over predicts the experimental 292
findings of our study ((Kτ/Kσ=0.82). In contrast, the model of Yoshioka & Scholz [20] 293
predicts values significantly lower than experimental data (Kτ/Kσ≈0.29) (see Fig. 10). 294
0 100 200 300 400
0.4 0.5 0.6 0.7 0.8
rms=2.05 µm (Low)
1th Cycle (Loading) (Unloading) 11th Cycle(Loading) (Unloading) --- Observed trend
S
h
ea
r s
ti
ffn
es
s /
n
o
rm
a
l s
ti
ffn
es
s
Normal pressure, MPa
Mindlin (1949)
[image:16.595.124.471.359.612.2]295
Figure 7. Experimental results of interfacial stiffness ratio as function of loading cycles for smooth
296
sample 1 (Ra=1.58 µm). Points indicate experimental data and the dashed line is the
297
observed trend.
298
0 100 200 300 400 0.4
0.5 0.6 0.7 0.8
rms=3.10 µm (Medium)
1st Cycle (Loading) (Unloading) 11th Cycle (Loading) (Unloading) --- Observed trend
S
h
ea
r s
ti
ffn
es
s /
n
or
m
al
s
ti
ffn
es
s
Normal pressure, MPa
Mindlin (1949)
[image:17.595.135.470.73.313.2]300
Figure 8. Experimental results of Kτ/Kσ versus normal pressure for rough sample 2 (Ra=2.42 µm).
301
0 100 200 300 400
0.4 0.5 0.6 0.7 0.8
1st Cycle (Loading) (Unloading) 11th Cycle (Loading) (Unloading) --- Observed trend
S
h
ea
r s
ti
ffn
es
s /
n
or
m
al
s
ti
ffn
es
s
Normal pressure, MPap rms=3.99 µm (High)
Mindlin (1949)
302
Figure 9. Experimental results of Kτ/Kσ versus normal pressure for rough sample 3 (Ra=3.09 µm). 303
[image:17.595.117.477.353.610.2]0.10 0.20 0.30 0.40 0.50 0.60 0.70 0.80 0.90
0 50 100 150 200 250 300 350 400 450 500
Normal Pressure, MPa
S
h
ea
r s
ti
ffn
es
s /
N
o
rm
a
l s
ti
ffn
es
s
Yoshioka & Scholz Krolikowski & Szczepek
Sherif & Kossa
Baltazar et
[image:18.595.111.490.72.334.2]305
Figure 10. Theoretical predictions of shear to normal stiffness ratio.
306
307
On the other hand, ultrasonic waves are sensitive to the surface roughness but only for high 308
frequencies when the wavelength is comparable with the height h of the interface. When this 309
condition is not reached, QSA model can be used to describe the deformation of the interface 310
Yalda-Mooshabad et al. [31]. In our case, the wavelength in steel for longitudinal wave and a 311
frequency of 5MHz is about 1.18 mm. This value is much larger than the rms roughness of 312
the interface. 313
From our experimental results, it is possible that an additional mechanism of wave 314
interaction with the interface can be observed by measuring the stiffness ratio as function of 315
pressure. In principle, two conditions could be affecting the ultrasonic reflection signature, the 316
contact at the roughness asperities and the space (voids) left in between the asperities. It is 317
clear that by bringing the rough surface together, the aspect ratio will change up to a point 318
observed variation of aspect ratio during loading is controlled by the contact area, it is 321
possible that the effect of voids is masked by the contact behavior and it is only unveiled 322
when the ratio Kτ/Kσ versus pressure is estimated. 323
A review of the effect of non-interacting voids on the ultrasonic signature was given by 324
Nagy [11]. According to the study, the interfacial stiffness ratio was found to be sensitive to 325
the aspect ratioξ =a b/ of spheroidal voids, where a is the out-of-plane and b the in-plane 326
dimension. It was shown that the ratio Kτ/Kσ of two similar solids (v=0.3) in contact varies 327
monotonically from 0.45 for spherical void (ξ →1) to 0.88 for flat cracks (ξ →0 ). 328
Following a different approach, calculations of interfacial ratio using boundary element 329
method (BEM) and Independent Scattering Approach (ISA) were estimated by Yalda-330
Mooshbad et al. [31]. In their calculation for an interface with a fraction area of voids of 2.5% 331
in a matrix with properties cl =6.0 Km/sec and ct=3.0 Km/sec, the ratio was found to vary 332
monotonically from 0.36 for spherical void (ξ =1) to 0.76 for flat cracks (ξ =0.05 ). 333
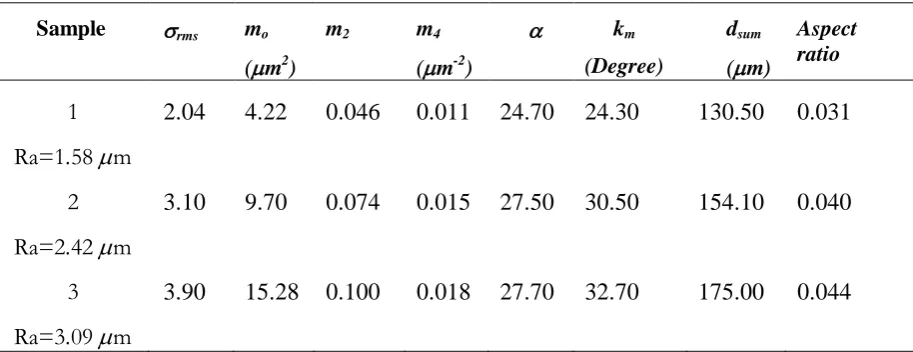
To estimate the mean aspect ratio in our tested surface, an approximation based on the 334
statistical parameters of the samples (Table 2) was carried out following the analysis of Nayak 335
[33]. It was found that the determined mean aspect ratio in the fresh surfaces does not change 336
considerably for samples 2 and 3, with only a decrement of about 25% for the smoothest 337
sample (Ra=1.58µm). These values of aspect ratio give a Kτ/Kσ of about 0.78 from Nagy [11] 338
and about 0.76 from Yalda-Mooshbad et al. [31]. The values are higher than our experimental 339
findings, but it should be noted that the statistical results of samples 2 and 3 show a positive 340
correlation between experimental Kτ/Kσ and estimated aspect ratio. However, the smooth 341
sample 1 has a lower than expected value of Kτ/Kσ as one would predict based on its aspect 342
ratio. 343
Another relevant parameter for our study is the mean curvature which is shown 344
have larger mean curvature [32]. For fresh surfaces, the aspect ratio is a random variable, 346
which could be correlated with the distribution of asperities and curvatures [33]. If we relate 347
the values of curvature with the misalignment of contact proposed by Baltazar et al. [14], the 348
correction factor would be between 0.9-0.8 resulting in a Kτ/Kσ value of about 0.65 for 349
samples 2 and 3 and a bit larger for sample 1 with a smooth surface. The result for the smooth 350
surface is in the opposite direction to the expected direction of correlation between interfacial 351
ratio and the mean curvature. 352
354
Sample σrms mo (µm2)
m2 m4 (µm-2)
α km (Degree)
dsum (µm)
Aspect ratio
1 Ra=1.58 µm
2.04 4.22 0.046 0.011 24.70 24.30 130.50 0.031
2 Ra=2.42 µm
3.10 9.70 0.074 0.015 27.50 30.50 154.10 0.040
3 Ra=3.09 µm
[image:21.595.67.524.91.267.2]3.90 15.28 0.100 0.018 27.70 32.70 175.00 0.044
Table 2. Additional experimental statistical parameters for the samples studied. σrms is the 355
rms roughness, m0, m2, m4 are the spectral moments of the surface, α is a parameter related 356
with the width of spectrum, km is the mean curvature, and dsum is the mean distance between 357
summits. 358
359
From the above discussion, there is no clear evidence to indicate if any of the two proposed 360
parameters: radius of curvature or aspect ratio is solely controlling the observed stiffness ratio 361
variation during the loading cycles. 362
It is also possible that if the stiffness ratio is truly constant at the asperities contact, then 363
the ratio variations are related to change in the shape of the voids. However, the shape of the 364
voids is controlled by the contact of asperities. Therefore, any change in the contact area at 365
the asperities will control the variations of the voids. This empirical analysis could explain the 366
observed hysteresis, which is expected for large plastic deformation and correlated with the 367
larger roughness. 368
The problem is far from being resolved, and the experimental results show that the 369
micromechanics of shear contact may be more complex than expected, with that said, 370
mechanics such as slip and/or ellipsoidal contact just to mention a few, could be affecting the 371
interfacial ratio [34, 35]. 372
374
Conclusions
375
An ultrasonic approach has been used to determine the normal and shear stiffness for three 376
different grit-blasted contacting surfaces. Experimental data of stiffness ratio was found to be 377
sensitive to both roughness level and plastic deformation. Degree of hysteresis for the 378
loading/unloading cycles was found to be a function of the roughness level. The assumption 379
of ultrasonic wave sensitivity to other roughness parameters such as aspect ratio of voids and 380
radius of curvature did not completely follow our experimental findings. A non-constant 381
stiffness ratio suggests that additional parameters other than those that describe the Hertzian 382
contact are being unveiled by the interfacial stiffness ratio. 383
384
References
385
1. D. Tabor, The Hardness of Metals, Oxford University Press, USA, 2000, p.192.
386
2. R.S. Dwyer-Joyce, B.W. Drinkwater, A.M. Quinn, The use of ultrasound in the investigation of
387
rough surface interfaces, ASME Journal of Tribology 123 (2001) 8-16.
388
3. J.Y. Kim, A. Baltazar, S.I. Rokhlin, Ultrasonic assessment of rough surface contact between
389
solids from elastoplastic loading-unloading hysteresis cycle, Journal of the Mechanics and
390
Physics of Solids 52 (2004) 1911-1934.
391
4. J. Krolikowski, J. Szczepek, Prediction of contact parameters using ultrasonic method, Wear
392
148 (1991) 181-195.
393
5. K. Kendall, D. Tabor, An ultrasonic study of the area of contact between stationary and sliding
394
surfaces, Proceedings of the Royal Society of London: Series A 323 (1971) 321-340.
395
6. H.G. Tattersall, The ultrasonic pulse-echo technique as applied to adhesion testing, Journal of
396
Applied Physics: Part D 6 (1973) 819-832.
397
7. A.W. Bush, R.D. Gibson, T.R. Thomas, The elastic contact of a rough surface, Wear 35 (1975)
398
87-113.
399
8. J.A. Greenwood, J.B.P. Williamson, 1966. Contact of nominally flat surfaces, Proceedings of
400
the Royal Society of London: Series A 295 (1966) 300-319.
9. D.J. Whitehouse, J.F. Archard, The properties of random surfaces of significance in their
402
contact, Proceedings of the Royal Society of London: Series A 316 (1970) 97-121.
403
10. R.A. Onions, J.F. Archard, The contact of surfaces having a random structure, Journal of
404
physics, D: Applied Physics 6 (1973), 289-304.
405
11. P.B. Nagy, Ultrasonic classification of imperfect interfaces, Journal of Nondestructive
406
Evaluation 11 (1992) 127-139.
407
12. P. Berthoud, T. Baumberger, Shear stiffness of a solid-solid multicontact interfase, Proceedings
408
of the Royal Society: Series A 454(1998) 1615-1634.
409
13. R. S. Dwyer-Joyce, B. W. Drinkwater, A. M. Quinn, The Use of Ultrasound in the
410
Investigation of Rough Surface Interfaces, Journal of Tribology, 123 (2001) 8-17.
411
14. A.Baltazar, S.I. Rokhlin, C. Pecorari, On the relationship between ultrasonic and
412
micromechanical properties of contacting rough surfaces. Journal of the Mechanics and
413
Physics of Solids 50, (2002) 1397-1416.
414
15. H.A. Sherif, S.S. Kossa, Relationship between normal and tangential contact stiffness of
415
nominally flat surfaces, Wear 151 (1991) 49-62.
416
16. J. Krolikowski, J. Szczepek, Assessment of tangential and normal stiffness of contact between
417
rough surfaces using ultrasonic method, Wear 160 (1993) 253-258.
418
17. K.L. Johnson, Contact Mechanics, Cambridge University Pres, New York, 1987, p.464.
419
18. T. Hisakado, T. Tsukizoe, Effects of distribution of surface slopes and flow pressures of
420
contact asperities on contact between solid surfaces, Wear 30 (1974) 213-227.
421
19. R.D. Mindlin, Compliance of elastic bodies in contact, Journal of Applied Mechanics 71
422
(1949) 259-268.
423
20. N. Yoshioka, C.H. Scholz, Elastic properties of contacting surfaces under normal and shear
424
loads: Part 1 – Theory, Journal of Geophysics Research 94 (1989) 17681-17690.
425
21. J.J. O´Connor, K.L. Johnson, The role of surface asperities in transmitting tangential forces
426
between metals, Wear 6 (1963) 118-139.
427
22. M. Raoof, R.E. Hobbs, Tangential compliance of rough elastic bodies in contact, ASME
428
Journal of Tribology 111 (1989) 726-729
429
23. K.Yamada, N. Takeda, J Kagami, T. Naoi, Mechanisms of elastic contact and friction between
430
rough surfaces, Wear 48 (1978) 15-34.
431
24. M. Schoenberg, Elastic wave behavior across linear slip interfaces, Journal of the Acoustical
432
Society of America 68 (1980) 1516-1521.
433
25. B.W. Drinkwater, R.S. Dwyer-Joyce, P. Cawley, A study of the interaction between ultrasound
434
and a partially contacting solid-solid interface, Proceedings of the Royal Society: Series A 452
(1996) 2613-2628.
436
26. J. Krautkramer, H. Krautkramer, Ultrasonic Testing of Materials, Springer-Verlag, Fourth
437
Edition, 1990, p.677.
438
27. T. Arakawa, A study of the transmission and reflection of an ultrasonic beam at machined
439
surfaces pressed against each other, Materials Evaluation 41 (1983) 714-719.
440
28. K. Hodgson, The Use of Ultrasound to Investigate Engineering, Doctoral Thesis, The
441
University of Sheffield, UK, 2002.
442
29. M.B. Marshall, R. Lewis, B.W. Drinkwater, R.S. Dwyer-Joyce, An approach for contact stress
443
mapping in joints and concentrated contacts, Journal of Strain Analysis 39 (2004) 339-350.
444
30. M. Gonzalez-Valadez, R.S. Dwyer-Joyce, Asperity creep measured by the reflection of
445
ultrasound at rough surface contact, ASME Journal of Tribology 131 (2009)
446
DOI:10.1115/1.3089217. 447
31. I. Yalda-Mooshabad, F.J.Margetan, T.A. Gray, R.B.Thompson, Reflection of ultrasonic waves
448
from imperfect interfaces: A combined boundary element method and independent scattering
449
model approach. Journal of Nondestructive Evaluation 11( 3/4) (1992) 141-149.
450
32. McCool, J.I. Relating profile instrument measurements to the functional performance of rough
451
surfaces, Transactions of the ASME: Journal of Tribology, 109 (1987) 264-270.
452
33. Nayak, P. Random process model of rough surface, Transactions of the ASME: Journal 453
of Lubrication Technology, 93 (1971) 398-407. 454
34. I. Sevostianov, M. Kachanov, Normal and tangential compliances of interfase of rough
455
surfaces with contacts of elliptic shape, International Journal of Solids and Structures 45 (2008)
456
2723-2736.
457
35. I. Sevostianov, M. Kachanov, Contact of rough surfaces: A simple model for elasticity,
458
conductivity and cross-property connections, Journal of the Mechanics and Physics of Solids
459
56 (2008) 1380-1400.