promoting access to White Rose research papers
White Rose Research Online
[email protected]
Universities of Leeds, Sheffield and York
http://eprints.whiterose.ac.uk/
This is an author produced version of a paper published in
Nature Climate
Change.
White Rose Research Online URL for this paper:
http://eprints.whiterose.ac.uk/76548/
Paper:
Steinberger, JK, Roberts, JT, Peters, GP and Baiocchi, G (2012) Pathways of
human development and carbon emissions embodied in trade. Nature Climate
Change, 2 (2). 81 - 85.
National pathways of emissions and human development:
correcting for carbon embodied in trade
Julia K. Steinberger (1,2,*), J. Timmons Roberts (3), and Glen Peters (4)
1. Sustainability Research Institute, School of Earth and Environment, University of Leeds, Maths/Earth and Environment Building, LS2 9JT, United Kingdom
2. Institute of Social Ecology Vienna, Alpen-Adria University, 29 Schottenfeldgasse, A-1070 Austria
3. Center for Environmental Studies, Box 1943, 135 Angell Street, Providence, RI 02912, USA
4. Center for International Climate and Environmental Research—Oslo (CICERO), PB 1129 Blindern, 0318 Oslo, Norway
(*) Corresponding author. Address: Sustainability Research Institute, School of Earth and Environment, University of Leeds, Maths/Earth and Environment Building, LS2 9JT, United Kingdom. PHONE: T +44 (0)113 343 1631/FAX +44 (0)113 343 6716. Email: [email protected]
Keywords: climate change, emissions embodied in trade, life expectancy, development trajectories
Summary [max 150 words]
It has long been assumed that energy use is necessary for economic growth, and that economic growth is the prerequisite for human development. Without radical technological improvement, energy use leads to carbon emissions. In this article, we connect new findings to clarify the links between carbon and human development. We analyse the change in trends and correlations between human development indicators and carbon, adjusting carbon emissions for internationally traded goods and services, and examine the diversity in national development trajectories. Adjusting for the transfer of emissions through trade explains many outliers, with socioeconomic benefits accruing to importing rather than carbon-exporting countries. Currently, high life expectancy is compatible with low carbon emissions, but high incomes are not. Despite strong international trends, there is no deterministic
industrial development trajectory.
Introduction
from 0.6 to 0.2 tC/capita 2,3. What quality of life is possible on such dramatically lower levels of carbon emissions?
There has long been a focus on the close correlation between overall economic activity, energy use and resulting carbon emissions, as well as between economic activity and human development indicators, such as life expectancy. The assumption of a double
carbon-economy and carbon-economy-human development linkage is at the core of international
disagreements over addressing climate change. Rapidly-developing countries such as Brazil, India and China have resisted binding limits on their emissions during the first commitment periods of the Kyoto Protocol, arguing that they would be condemned to perpetual
underdevelopment. Among some wealthier countries, such as the US, there is resistance to ratify any protocol that would limit US emissions and “result in serious harm to the economy” 4. If this commonly-held double assumption holds true, then strong economic
growth is necessary to improve human development, and consequently greenhouse gas emissions can only be reduced through radical technological improvements not yet readily and affordably available.
The links between resource use, especially abundant technical energy from fossil fuels, and economic and human progress have long been studied 5-9, most often assuming constant or only slowly shifting relationships between them (for instance through the increasing energy efficiency of modern economies). International studies have demonstrated, however, that economic activity and life expectancy are not perfectly, or permanently, correlated, with high life expectancies attainable at ever declining levels of income 10. The latest UNDP Human Development Report questions the development-growth correlation 11. In recent work 12, we observed that human development has been steadily decoupling from energy and carbon emissions over the past thirty years. Although most countries whose economies are growing also experienced significant growth in carbon emissions, a number of countries have
developed socioeconomically without requiring large increases in carbon emissions. To look at global averages and correlations misses the important differences not just of outlier nations, but the fact that there are qualitatively different development pathways nations have taken. Focusing on the relationship between emissions and human development in the past decades provides potential insights into future development pathways combining
environmental sustainability and human well-being.
In this article, we first characterize the extent to which high life expectancy and income require high carbon emissions. We improve on past analyses by testing the impact of adjusting these correlations for the carbon embodied in internationally traded goods and services. Next, we analyze the implications of simultaneously considering life expectancy, income and carbon emissions. Finally, we follow the development pathways of these three variables for several key nations from 1990 to 2005, the period where the data sets overlap.
Carbon transfers through international trade
More recently, the relative decarbonisation of wealthy nations’ economies has been questioned, because these countries could be benefiting not only from the carbon emitted within their national territory (which are the emissions recorded in national and international statistics), but also from the carbon emissions embodied in the goods and services they import
13-18. This is important both analytically and practically: mitigation commitments are easily
those that have binding commitments (specifically, the 43 countries in Annex B of the Kyoto Protocol).
Several pioneering studies based on Environmentally-Extended Input-Output methodologies have recently provided the first robust estimates of international trade-corrected
consumption-based carbon 15,17 and other greenhouse gas emissions 16. Conventional carbon accounting covers emissions occurring in the country’s territory. These are the basis of the Kyoto Protocol agreements. Consumption-based accounting corrects territorial emissions by adding emissions generated to produce imported goods and services, and subtracting those generated to produce exports. This method has now been extended to estimate consumption-based emissions for a large set of countries in the time span 1990-2008 18.
Human development and carbon emissions
Conventional analysis, such as the Kaya identity 19, conceptualizes socioeconomic parameters as drivers of carbon emissions; in contrast, in this work, we are pursuing the reverse analysis, investigating human development as an outcome of the physical processes which result in carbon emissions. According to our hypothesis, consumption-based emissions, which include the carbon embodied in all goods and services consumed in a country, should reflect the socioeconomic benefits accruing from these emission processes far better than conventional territorial emissions. This can be seen in terms of carbon emissions per unit GDP, which tend to converge in a consumption perspective 20. In the most extreme example, a country which
burns fossil fuels purely for exported products would not have any left over for its
population’s benefit; thus, territorial emissions would reflect the population’s consumption and human development very poorly.
To examine the dependency of socioeconomic progress on carbon-fuelled processes, we characterize the relationship between human development and carbon emissions. Life expectancy and income are chosen as two main (but by no means exclusive) indicators of human development, and both territorial and consumption-based carbon emissions are considered, in order to explore the role of international trade in these relationships.
The countries and regions in Fig 1 are displayed as horizontal arrows, moving from territorial to consumption-based carbon emissions. The start of the arrow thus corresponds to
conventional national accounting (such as was used in the Kyoto Protocol), whereas the head of the arrow takes into account the emissions embodied in trade. Carbon-exporting countries move from right to left (gray arrows, solid lines), and carbon-importing countries move from left to right (red arrows, dashed lines). Countries whose emissions are mostly unaffected by trade are shown as blue circles. The area of the points is proportional to population.
<Figure 1 close to here>
These different behaviors can be seen in Fig 1: life expectancy has a sharp turning point absent for income (the income-carbon plot is linear in log-log space). The correction from territorial to consumption-based emissions draws the countries closer to the curves. The impact of adjusting for the embodied carbon in imports and exports through the consumption-based emissions is significant, improving the goodness-of-fit R2. Consumption-based
indicators of national emissions explain 91% of the variation in national GDP per capita and 72% of life expectancy rates, 9% and 7% more than conventional territorial emissions, respectively.
The countries and regions above and to the left of the regression curves in Fig. 1 are doing better than the global average in terms of the life expectancy and income they achieve at their level of carbon emissions. The countries below and to the right are doing worse. The patterns in Fig. 1 explain large categories of outliers: countries far from the global trends. The curves strikingly separate the carbon importers from the exporters: even when the carbon embodied in their exports is subtracted, most carbon exporting countries remain below and to the right of the curve. In contrast, the vast majority of the carbon importers are above and to the left of the curve: they disproportionately benefit in income and length of life from the global
division of labor, even with the addition of carbon embodied in their imports.
Simultaneous analysis and trade-offs
Consumption-based emissions are consequently the most appropriate for comparison with human development. The three-dimensional plot (Fig. 2) enables the simultaneous
visualization of life expectancy (vertical axis), consumption-based emissions (horizontal axis) and income (color scale), and thus summarizes the important trends and variation of the global system in the year 2004. A life expectancy between 75 and 80 years of age was achieved by countries with carbon emissions ranging from a modest 0.5 tC/capita for Costa Rica to the largest, 6.2 tC/capita, for the United States, a more than twelve-fold difference. The income range for these countries was also extreme, from 4’500 (Albania) to 36,000 USD/capita (United States again). If we zoom in on the countries with lifespan of over 70 years (or “three score and ten,” Psalm 90:10) and less than one ton of carbon emitted per person in 2004, we see a large range in possible incomes, from 2’500 to 12’000 USD/capita. This we have dubbed the “Goldemberg Corner;” after former Environment Minister of Brazil Jose Goldemberg, who argued we could achieve “basic needs and much more” for 1 ton of carbon per capita or less 12. The countries in this area are mostly Latin American, but there are also a few Asian, Eastern European, and North African nations.
<Figure 2 close to here>
The large range in carbon emissions and incomes at the highest life expectancies could be seen as good news. However, there is a clear pattern within these ranges: the countries at the lowest carbon ranges of their life expectancy cohort are also the ones at the lowest incomes. This confirms the pattern seen in Fig. 1: high life expectancies and low carbon emissions are compatible with each other, but this combination is incompatible with higher incomes, given the evidence provided by existing societies.
The final objective of this article is to move beyond global trends to find examples of
countries with more sustainable pathways of economic and social development, and to assess whether their relative sustainability holds up even when their emissions from the import of goods and services are taken into account.
We address this question by observing the development trajectories of 13 key countries and regions from 1990 to 2005, in terms of our three variables: life expectancy, income, and per capita carbon emissions (both territorial and consumption-based), and comparing these trajectories to the global trend lines. The countries in Fig. 3 were selected for regional representation, size and interest, and they represent over half of the world’s population and carbon emissions. Although the typical trajectory is one of growth in all three dimensions of carbon, income, and life expectancy, the Russian Federation and many African countries suffered decreases in life expectancy over the period, due to political and economic collapse and the AIDS epidemic respectively. As a consequence, the trajectories in Fig 3 are upwards, except when indicated otherwise with arrows. The UK experienced a significant decrease in its territorial emissions per capita, although emissions grew when embodied emissions in trade were considered 21-23. For some countries, the trajectories show the consequences of
political upheaval (Russian Federation) and economic crises (Chile, Japan).
<Figure 3 close to here>
The countries with the highest life expectancy in Fig. 3(a) tend to be net importers of carbon through trade, or neutral overall when imports and exports are considered, like Chile. As seen in Fig. 2, the highest life expectancies are attainable at vastly varying carbon emission levels: from Costa Rica and Chile below 1tC/capita to the US closer to 6 tC/capita. In contrast, the richest countries in Fig. 3(b), Japan, the UK and the US, with incomes above 20’000 USD/capita, all have carbon emissions well above 2tC/capita. The richest countries in Fig. 3(b) are also net importers of carbon through trade of goods and services, whereas the intermediate income countries are a mixture: Costa Rica is a net importer, but South Africa, the Russian Federation and China are net exporters of embodied carbon, and Chile, Brazil and Iran are closer to neutral overall. Among the poorest, India and Nigeria are net exporters, but Bangladesh is an importer. As we know from Fig. 1, most of the poorest countries are in fact net carbon importers.
Overall, the development trajectories in Fig. 3 are consistent with the trends seen in Figs. 1 and 2 but provide important details suggesting a richer story. Overall, high life expectancy is attainable at a large range of carbon emissions, whereas income is much more linked with carbon. However, and perhaps surprisingly, several countries do not follow the global trends (shown for 1990 and 2005, consumption-based emissions): in general, the growth in
socioeconomic benefits is larger than the growth in carbon emissions could account for, if the trend curves were followed. This explains why the global trend curves are steadily moving upwards, as we have previously shown 12. This is evidence of relative, but not absolute,
decoupling of socioeconomic gains from carbon-intensive processes. Moreover, the diversity of development pathways shown in Fig. 3 is evidence that there is no deterministic single development trajectory, despite the fact that all the countries shown are linked by global trade and rely to a large extent on similar technologies.
Several major implications can be drawn from these results. Most importantly, a
consumption view of carbon emissions based on emissions embodied in trade reflects the socioeconomic benefits more closely than the territorial accounting used in previous studies (Fig. 1). Second, carbon emissions are much more strongly linked to income than to life expectancy; and the monetary wealth achieved by most OECD countries corresponds to consumption-based carbon emissions significantly above the territorial emissions taken into account by the Kyoto Protocol.
Most of the carbon-exporting countries and regions are grouped at intermediate life expectancy (between 63 and 75 years) and income (between 2’000 and 12’0000 USD/capita). They perform worse than the global trend in terms of socioeconomic
achievement given their level of carbon emissions. Even when their emissions are corrected for the embodied carbon in international trade, most of them are still below the global trend. This surprising result indicates that there is a systematic disadvantage, in terms of
socioeconomic benefits, for carbon exporting economies. Besides China and India, which are relatively close to the global trend, these countries are mainly from the former Soviet Union, Eastern Europe, Middle East, and South Africa. They are the fossil-exporting and raw material-exporting economies. This suggests the double negative of specializing in natural resource extraction and earlier stages of processing and manufacturing 24,25, and can be interpreted as evidence for the environmentally-unequal exchange theory first described by Bunker 26.
The carbon importing countries, in contrast, are an extremely diverse group. They are comprised of high socioeconomic status OECD countries (life expectancies above 75 years and national average income above 12’000 USD/capita), some intermediate countries from Asia and Latin America, and most of the countries with low socioeconomic status (life expectancies below 63 years, income below 2’000 USD/capita), which are overwhelmingly African. The membership of the carbon-importing club is thus comprised of two extremes: the most socio-economically well-off, and the poorest of the poor. The plight of development is particularly acute for these poor countries, which are constrained to import not just energy itself, but also carbon-intensive goods and services from the global market, sometimes relying on large amounts of foreign assistance for this purpose 27. These countries are thus doubly vulnerable to price increases in fossil fuels.
Interestingly, the consumption-based regression curves lie above the territorial ones at higher emissions, and below at lower emissions (although this difference is not visible in Fig. 1), and this difference is particularly significant for income. This indicates that lower income levels require higher carbon emissions than previously thought, when trade is taken into
consideration. At higher incomes, this effect merely corrects for the apparent “Environmental Kuznets Curve,” due to the larger territorial emissions of middle-income carbon exporting economies, and lower territorial emissions of high income countries. This supports the finding that the Environmental Kuznets Curve for carbon per capita does not exist after correcting for embedded carbon emissions of imports 15,28-31, see also 32.
Implications of findings and future research
Ideally, nations could achieve all three of the objectives required for sustainable
development: low carbon emissions, high life expectancy, and high income. However, the evidence from our analysis demonstrates that it is indeed possible to achieve simultaneous environmental and social sustainability (in the form of lower carbon emissions and high life expectancy), but only at levels of income below 12’000 USD/capita (Fig. 2). Indeed, the coupling between economic activity and carbon emissions (Fig 1b) is stronger than the correlation between life expectancy and carbon emissions (Fig 1a), or between life
expectancy and income. This enables certain combinations of desirable outcomes, but not all: high life expectancies and income are compatible, so are high life expectancies and low carbon emissions, but economic and environmental goals appear to be at odds with each other, at least at the highest levels of GDP per capita.
In other words, a moderate income is currently a necessary (but not sufficient) requirement for environmental sustainability: “necessary” because no high income country has carbon emissions below 1tC/capita; “not sufficient” because moderate incomes do not guarantee either high life expectancy or low carbon emissions. This finding has clear implications for developing scenarios of sustainable futures, with higher priority accorded to low emissions and high social well-being, and less emphasis placed on the size of the economic output.
This study suggests crucial avenues for further research. The causal factors underlying development pathways may be explored, in order to explore viable low carbon transitions going forward. These causal factors certainly comprise resource endowment, industrial structure, colonial links, and a country’s role in the global division of labor (e.g. trade based on extraction, manufacture, finance, tourism, aid-dependence, or debt-fueled consumption). This work could tie emissions to economic geography and political economy within
economics, sociology, and history. A better understanding of the obvious regional
differences in the national trajectories seen in Fig 3 is of clear interest: What has been the role of national and provincial government decisions in development planning? Were nations cast into path dependency, or were national and local planners and politicians effective in re-directing national “green (or not-green) pathways”? Reflection is necessary on alternatives to policies and governments which prioritize economic growth at the expense of climate
stability and human equity.
There is much further work to do on scenarios, projecting current trends of nations and groups of nations that are moving in a measurable direction. What will the structure of global pathways look like if these countries continue in the directions they are heading? Can this approach better inform socioeconomic elements of global climate models? The implications of these findings are substantial, then, both for climate modelers and for development planners. For planners and decision-makers, the findings provide hope that national choices and pathways matter, and that alternatives are available to policies that prioritize economic growth at the expense of climate stability and a long life for our citizens.
Methods summary
2000 USD from the World Bank 34; territorial carbon emissions from the Carbon Dioxide Information and Analysis Center 1; consumption-based carbon emissions from Peters et al 2011 18. These data sources were combined to match the GTAP country/regions used in 18 by estimating regional values, utilizing the full 2004 MRIO for the data shown in Figs. 1 & 2 and the TSTRD approximation for the trajectories in Fig. 3.
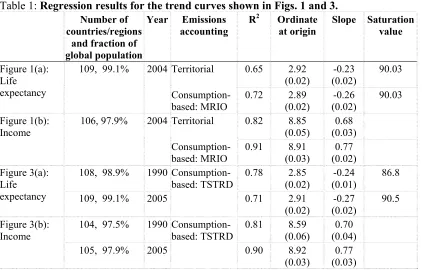
Table 1: Regression results for the trend curves shown in Figs. 1 and 3.
Number of countries/regions
and fraction of global population
Year Emissions
accounting
R2 Ordinate
at origin
Slope Saturation
value
Figure 1(a): Life expectancy
109, 99.1% 2004 Territorial 0.65 2.92
(0.02) -0.23 (0.02) 90.03 Consumption-based: MRIO 0.72 2.89 (0.02) -0.26 (0.02) 90.03 Figure 1(b): Income
106, 97.9% 2004 Territorial 0.82 8.85
(0.05) 0.68 (0.03) Consumption-based: MRIO 0.91 8.91 (0.03) 0.77 (0.02) Figure 3(a): Life expectancy
108, 98.9% 1990
Consumption-based: TSTRD 0.78 2.85 (0.02) -0.24 (0.01) 86.8
109, 99.1% 2005 0.71 2.91
(0.02) -0.27 (0.02) 90.5 Figure 3(b): Income
104, 97.5% 1990
Consumption-based: TSTRD
0.81 8.59
(0.06)
0.70 (0.04)
105, 97.9% 2005 0.90 8.92
(0.03)
0.77 (0.03)
Acknowledgements
J.T.R.’s start-up research fund from Brown University was critical in the completion of this work.
Author Contributions
J.K.S. and J.T.R. designed the research; J.K.S. conducted the analysis; G.P. provided the consumption-based carbon data and feedback on its analysis; J.K.S., J.T.R. and G.P. wrote the article.
Reprints and permissions information is available at www.nature.com/reprints.
Correspondence and requests for materials should be addressed to [email protected].
Figure legends
Fig. 1: Human development and carbon emissions. Each arrow shows the movement of a country/region from territorial to consumption-based carbon emissions for one
country/region, with respect to (a) life expectancy and (b) income, in 2004. The arrowhead size represents national population. Carbon importers are red; exporters, gray; net neutral countries are blue circles. The arrows move towards the regression curves, leading to better goodness-of-fit for consumption-based emissions: consumption-based accounting is thus a substantially better predictor of human development.
Fig 2: Life expectancy, income and carbon in 3D. Three-dimensional representation of life expectancy (vertical axis), consumption-based emissions (horizontal axis) and income (color scale) in 2004. The expanded area includes the “Goldemberg Corner,” with life expectancy over 70 and less than 1 ton of carbon emissions per capita. The highest life expectancy levels are attained at a wide range of carbon emissions and incomes.
References
1 Boden, T. A., Marland, G. & Andres, R. J. Global, Regional, and National Fossil-Fuel CO2 Emissions. (Carbon Dioxide Information Analysis Center (CDIAC), Oak Ridge National Laboratory, U.S. Department of Energy, Oak Ridge, Tenn., U.S.A., 2009). 2 GCI. GCI Briefing on Contradiction and Convergence. (Global Commons, UK,
2003).
3 Baer, P., Athanasiou, T. & Kartha, S. The Right to Development in a Climate Constrained World: The Greenhouse Development Rights Framework. 1-95 (2007). 4 USA. (United States Senate, 1997).
5 Cottrell, F. Energy and Society. The Relation between Energy, Social Change, and Economic Development. (McGraw-Hill Book Company, 1955).
6 Mazur, A. & Rosa, E. Energy and Life-Style. Science186, 607-610 (1974).
7 UNDP. Energy As An Instrument for Socio-Economic Development. (United Nations Development Programme, 1995).
8 Goldemberg, J. & Johansson, T. B. World Energy Assessment. Overview 2004 Update. 1-85 (2004).
9 Wilkinson, P., Smith, K. R., Joffe, M. & Haines, A. A global perspective on energy: health effects and injustices. The Lancet370, 965-978 (2007).
10 Preston, S. H. The changing relation between mortality and level of economic development. International Journal of Epidemiology36, 484-490 (2007).
11 UNDP. Human Development Report 2010. The Real Wealth of Nations: Pathways to Human Development. (United Nations Development Programme, New York, 2010). 12 Steinberger, J. K. & Roberts, J. T. From constraint to sufficiency: the decoupling of
energy and carbon from human needs, 1975-2005. Ecological Economics70, 425-433, doi:10.1016/j.ecolecon.2010.09.014 (2010).
13 Peters, G. P. From production-based to consumption-based national emission inventories. Ecological Economics65, 13-23 (2008).
14 Munksgaard, J. & Pedersen, K. A. CO2 accounts for open economies: producer or consumer responsibility? Energy Policy29, 327-334 (2001).
15 Peters, G. P. & Hertwich, E. G. CO2 Embodied in International Trade with Implications for Global Climate Policy. Environmental Science & Technology42, 1401-1407 (2008).
16 Hertwich, E. G. & Peters, G. P. Carbon Footprint of Nations: A Global, Trade-Linked Analysis. Environmental Science & Technology43, 6414-6420 (2009).
17 Davis, S. J. & Caldeira, K. Consumption-based accounting of CO2 emissions.
Proceedings of the National Academy of Sciences107, 5687-5692 (2010).
18 Peters, G. P., Minx, J. C., Weber, C. L. & Edenhofer, O. Growth in emission transfers via international trade from 1990 to 2008. Proceedings of the National Academy of Sciences, doi:doi: 10.1073/pnas.1006388108 (2011).
19 Kaya, Y. Impact of Carbon Dioxide Emission Control on GNP Growth: Interpretation of Proposed Scenarios. (IPCC Energy and Industry Subgroup, Response Strategies Working Group., Paris, 1990).
www.pnas.org/cgi/doi/10.1073/pnas.1106517108,
doi:www.pnas.org/cgi/doi/10.1073/pnas.1106517108 (2011).
21 Wiedmann, T. et al. Development of an Embedded Carbon Emissions Indicator - Producing a Time Series of Input-Output Tables and Embedded Carbon Dioxide Emissions for the UK by Using a MRIO Data Optimisation System. (Defra, London, UK, 2008).
22 Wiedmann, T. et al. A carbon footprint time series of the UK - results from a Multi-Region Input-Output model. Economic Systems Research22, 19 - 42 (2010). 23 Baiocchi, G. & Minx, J. C. Understanding Changes in the UK’s CO2 Emissions: A
Global Perspective. Environmental Science & Technology44, 1177-1184, doi:10.1021/es902662h (2010).
24 Roberts, J. T. & Parks, B. C. A Climate of Injustice. Global Inequality, North-South Politics, and Climate Policy. (MIT Press, 2007).
25 Dicken, P. Global Shift: Mapping the Changing Contours of the World Economy Sixth Edition. (Sage, 2010).
26 Bunker, S. G. Modes of Extraction, Unequal Exchange, and the Progressive Underdevelopment of an Extreme Periphery: The Brazilian Amazon, 1600-1980.
American Journal of Sociology89, 1017-1064 (1984).
27 Unruh, G. C. & Carrillo-Hermosilla, J. Globalizing carbon lock-in. Energy Policy34, 1185-1197 (2006).
28 Rothman, D. S. Environmental Kuznets Curves - Real Progress or Passing the Buck? A Case for Consumption-Based Approaches. Ecological Economics25, 177-194 (1998).
29 Suri, V. & Chapman, D. Economic growth, trade and energy: implications for the environmental Kuznets curve. Ecological Economics25, 195-208 (1998).
30 Aldy, J. E. An Environmental Kuznets Curve Analysis of U.S. State-Level Carbon Dioxide Emissions. Journal of Environment and Development14, 48-72 (2005). 31 Aldy, J. E. Divergence in State-Level Per Capita Carbon Dioxide Emissions. Land
Economics83, 353-369 (2007).
32 Roberts, J. T. & Grimes, P. E. Carbon Intensity and Economic Development 1962-1991: A Brief Exploration of the Environmental Kuznets Curve. World Development, 191-198 (1997).
33 UN. World Urbanization Prospects: The 2007 Revision. (United Nations, Department of Economic and Social Affairs, Population Division, New York, 2008).