Performance - A Secondary
Analysis of COL Evaluation Data
Analysis Report
A Secondary Analysis of COL
Evaluation Data
Sarah Butt and Andreas Cebulla
Prepared for the British Educational Communications and
Technology Agency (BECTA)
May 2006
Contents
EXECUTIVE SUMMARY ... 1
E-maturity Levels and Changes between 2002 and 2005 ... 1
E-maturity and School Performance ... 2
1 INTRODUCTION ... 3
1.1 Aims of the Study ... 3
1.2 The Data ... 4
COL Survey Data ... 4
School Characteristics Data ... 5
Pupil Attainment Statistics ... 5
1.3 A Measure of E-maturity ... 6
PART I ... 8
2 E-MATURITY IN SCHOOLS ... 8
2.1 The Level of E-maturity in Schools ... 8
2.2 Changes in E-maturity 2002 - 2005 ... 10
2.3 The Path to E-maturity ... 12
3 E-MATURITY AND SCHOOL CHARACTERISTICS ... 16
3.1 The Profile of E-mature Schools ... 16
3.2 School Characteristics and Progress on E-maturity ... 18
Comparing Upward Movers vs. Downward Movers ... 20
PART 2 ... 24
4 E-MATURITY AND THE PERFORMANCE OF SCHOOLS AND THEIR PUPILS ... 24
4.1 Some Caveats ... 24
4.2 Findings - Primary Schools ... 26
4.3 Findings – Secondary Schools ... 28
4.4 Additional Analysis of Waves 1 and 2 ... 31
5 SUMMARY AND CONCLUSIONS ... 34
5.1 E-maturity and E-maturity Change between 2002 and 2005 ... 34
5.2 E-maturity and School Performance ... 35
BIBLIOGRAPHY ... 36
APPENDIX A E-MATURITY INDICATORS ... 37
APPENDIX B CORRELATIONS BETWEEN PERFORMANCE INDICATORS…………...…………41
List of Tables and Figures
Table 1.1 Final Sample Sizes: Primary Schools ... 4
Table 1.2 Final Sample Sizes: Secondary Schools ... 4
Table 1.3 Summary of Survey Data used in Analysis ... 5
Table 1.4 School Characteristics used in Analysis ... 5
Table 1.5 Summary of Available Data by School Year ... 6
Table 1.6 Indicators of E-maturity ... 7
Table 2.1 Summary of E-maturity Scores in Primary Schools ... 9
Table 2.2 Summary of E-maturity Scores in Secondary Schools ... 9
Figure 2.1 Change in Primary Schools’ E-maturity Score 2002-2005 ... 10
Figure 2.2 Change in Secondary Schools’ E-maturity Score 2002-2005 ... 11
Figure 2.3 Scatterplot of 2002 and 2002 E-maturity Scores: Primary Schools ... 11
Figure 2.4 Scatterplot of 2002 and 2005 E-maturity Scores: Secondary Schools ... 12
Figure 2.5 Primary Schools' E-maturity Scores, by Dimension and Total Score Level (2005) ... 13
Figure 2.6 Secondary Schools' E-maturity Scores, by Dimension and Total Score Level (2005) ... 13
Figure 2.7 Change in Primary Schools' E-maturity Scores 2002-2005, by Dimension and Total Score Level in 2005 ... 13
Figure 2.8 Change in Secondary Schools' E-maturity Scores 2002-2005, by Dimension and Total Score Level in 2005 ... 14
Table 2.3 Association between Aggregate Ematurity in 2005 and Ematurity Dimensions in 2002 -Regression Results for Primary and Secondary Schools ... 15
Table 3.1 Characteristics of Primary Schools by 2005 E-maturity Score ... 17
Table 3.2 Characteristics of Secondary Schools by 2005 E-maturity Score ... 18
Table 3.3 Association between School Characteristics and E-maturity 2005 – Regression Results for Primary Schools ... 19
Table 3.4 Association between School Characteristics and E-maturity 2005 – Regression Results for Secondary Schools ... 20
Table 3.5 Association between school characteristics and progress on E-maturity - logistic regression results for primary schools ... 22
Table 3.6 Association between school characteristics and progress on E-maturity - logistic regression results for secondary schools ... 23
Table 4.1 School Performance Data Background Statistics ... 26
Table 4.2 Association Between Performance Indicator in Year 2002 and E-maturity at Wave 1 (2002) - Multivariate Regression Results for Primary Schools ... 27
Table 4.3 Association Between Performance Indicator in Year 2005 and E-maturity at Wave 3 (2005) - Multivariate Regression Results for Primary Schools ... 27
Table 4.4 Association between Performance Indicators and Change in Ematurity 2002 to 2005 -Multivariate Regression Results for Primary Schools ... 28
Table 4.5 Association Between Performance Indicator in Year 2002 and E-maturity at Wave 1 (2002) - Multivariate Regression Results for Secondary Schools ... 29
Table 4.6 Association Between Performance Indicator in Year 2005 and E-maturity at Wave 3 (2005) - Multivariate Regression Results for Secondary Schools ... 29
Table 4.7 Association between Performance Indicators and Change in Ematurity 2002 to 2005 -Multivariate Regression Results for Secondary Schools ... 30
Table 4.8 Association between Performance Indicator in Various Years and Change in E-maturity between 2002 and 2003 - Multivariate Regression Results for Primary Schools ... 32
Table 4.9 Association between Performance Indicator in Various Years and Change in E-maturity between 2002 and 2003 - Multivariate Regression Results for Secondary Schools ... 33
Apdx Table A.1 E-maturity: Dimensions and Survey Questions ... 38
Apdx Table A.2 E-maturity: Dimensions and Survey Questions (cont.) ... 39
Apdx Table A.3 E-maturity: Dimensions and Survey Questions (cont.) ... 40
Apdx Table A.4 Correlations of Performance Indicators - Primary schools ... 41
Apdx Table A.5 Correlations of Performance Indicators - Secondary schools ... 41
Apdx Table A.6 Association between Performance Indicator and Position in Ematurity Distribution -Logistic Regression Results for Primary Schools ... 42
EXECUTIVE SUMMARY
The British Educational Computing and Technology Agency (BECTA) commissioned the National Centre for Social Research to conduct a secondary analysis of school- and teacher-level data obtained from the evaluation of the Curriculum Online programme. The aims of the secondary analysis were to investigate changes in the use of and attitudes towards ICT in schools over time and so map stages of “E-maturity”, and to explore the relationship between these indicators of ICT and school performance. "E-maturity" indicates the extent to which schools and their teachers make the use of ICT integral to their teaching and planning of teaching activities and provide students access to ICT inside and outside the classroom. The index was composed of three so-called dimensions, measuring ICT infrastructure and resources, organisational co-ordination of ICT resources, and "engagement with learners", that is, the extent to classroom and out-of-lesson use of ICT resources in a school.
For each school an E-maturity score was calculated based on these dimensions, which were summed to form the E-maturity score. Change in these scores between 2002 and 2005 were studied and associations with school performance indicators analysed.
E-maturity Levels and Changes between 2002 and 2005
Levels of E-maturity were found to have increased significantly between 2002 and 2005 in primary and secondary schools. At current point levels of 24.8 and 24.9 respectively, primary schools and secondary schools have, on average, reached approximately 70 percent of the total maximum score on the E-maturity scale.
The largest changes in E-maturity scores were recorded for primary schools, which, on average, had lagged behind secondary schools in terms of E-maturity in 2002, but by 2005 had achieved almost identical levels of E-maturity to those of secondary schools.
Improvements in aggregate E-maturity benefited from higher initial scores on the resource dimension (primary and secondary schools) and higher scores on the learning engagement dimension (secondary schools only). Primary schools particularly increased their scores on the organisational co-ordination dimension, whereas secondary schools, on average, improved their E-maturity similarly across all three dimensions. Although primary schools' overall E-maturity scores was similar to that of secondary schools, they continued to lag behind in terms of their ICT infrastructure and resources. However, they led secondary schools in terms of their organisational co-ordination of ICT resources.
E-maturity and School Performance
There was no evidence of a positive association between performance measures and increased E-maturity in primary schools. E-maturity increases in primary schools between 2002 and 2005 were associated with a lower proportion of authorised absences during the first year of the observation period, but not with absences in the final year. As a result, total change in authorised absences over this period was also not statistically associated with E-maturity improvements.
1 INTRODUCTION
1.1 Aims of the Study
The British Educational Communications and Technology Agency (BECTA) commissioned NatCen to carry out secondary analysis of data from the evaluation of Curriculum Online (COL). COL is an online service funded by the Department for Education and Skills (DfES) and managed by BECTA to enable teachers and schools to obtain information about and to procure multimedia resources for use in lessons.
There were two main aims to the secondary analysis. First, to investigate changes in the use of and attitudes towards ICT in schools over time and so map stages of “E-maturity”. By "E-maturity", we mean the extent to which schools and their teachers make the use of ICT integral to their teaching and planning of teaching activities and provide students access to ICT inside and outside the classroom.
The second aim was to investigate the relationship between these indicators of ICT and school performance.
Specifically, the objectives of the study were to:
• Construct a measure of schools’ level of “E-maturity” based on COL data.
• Map changes in this measure of E-maturity over the course of the COL study (2002-2005) and compare the characteristics of schools that have improved their relative position on E-maturity with other schools in order to build up a picture of the path to E-maturity.
• Explore the association between E-maturity and a range of school performance data over the period 2002-2005.
BECTA aims to “increase the number of educational organisations making strategic and effective use of ICT in order to improve educational outcomes” (BECTA Self-Review Framework 2006) by creating models of E-maturity and providing a framework against which schools can benchmark themselves, draw up action plans and review their progress. The longitudinal nature of the COL survey and the fact that the same schools were interviewed in 2002, 2003 and 2005 provided a unique opportunity to explore changes in schools’ situation over this period and to study schools' progression towards greater E-maturity.
Recent studies have produced contradictory evidence of the effect of ICT on learning (e.g. EPPI, 2003; OECD, 2006) and there remains as yet little robust evidence to suggest a direct link between ICT and schools’ performance. The second research stage of this project was designed to contribute to the current evidence base using a nationally representative sample of primary and secondary schools in England.
We begin our report by providing details on the data used and explaining of how we decided on the measure of E-maturity to be used.
1.2 The Data
The report combines a measure of schools’ E-maturity based on survey data with data on schools’ background characteristics and performance collected by DfES.
COL Survey Data
E-maturity was measured using data obtained from the Curriculum Online survey of schools 2002, 2003 and 2005, based on a series of survey responses and attitude statements concerned with the availability and use of ICT in schools. E-maturity scores, about which we will say more in section 1.3 below, were calculated for each of the three survey years based on all the schools that provided data on the different indicators of E-maturity for that year. Sample sizes for the three years are given in Tables 1.1 and 1.2. Subsequent analysis looking at the process of change in E-maturity used a panel of 143 primary and 135 secondary schools present in the first (2002) and third (2005) COL surveys. When examining the link between changes in E-maturity and school performance the size of the panel was reduced to the 121 primary and 131 secondary schools for which attainment data was available. A second panel comprising 120 primary schools and 119 secondary schools present in the first (2002) and second (2003) surveys, and for which attainment data was available for every year between 2002 and 2005, was also used to examine the link between E-maturity and school performance. This allows us to test whether there was a lagged effect of E-maturity on school attainment using performance data from after 2003. A summary of the survey data used for each stage of the analysis is shown in Table 1.3.
Table 1.1 Final Sample Sizes: Primary Schools
Total Sample E-maturity Scores
Available
Attainment Data Available
2002 359 271 N/A
2003 261 197 N/A
2005 236 182 N/A
2002 + 2003 panel 261 143 120
2002 + 2005 panel 236 143 121
Note: N/A = not applicable
Table 1.2 Final Sample Sizes: Secondary Schools
Total Sample E-maturity Scores
Available
Attainment Data Available
2002 331 260 N/A
2003 247 185 N/A
2005 195 154 N/A
2002 + 2003 panel 247 162 119
2002 + 2005 panel 195 135 131
Table 1.3 Summary of Survey Data used in Analysis
Analysis COL Data Used
E-maturity scores 2002, 2003, 2005 Process of Changing E-maturity 2002 + 2005 panel
E-maturity and attainment 2002 + 2005 panel, 2002 + 2003 panel
School Characteristics Data
Data on the demographic and administrative characteristics of the schools in the sample were taken from Edubase, the DfES’ database of all educational establishments across England and Wales. The data describe schools' circumstances as they were in March 2006, when the data were obtained. It may well be that circumstances were different at the time of the COL surveys, although major changes are unlikely. A list of the school characteristics used in the analysis is given below (Table 1.4). Other contextual variables were available (e.g. gender of pupils, school admissions policy) but were excluded from the analysis because there was not sufficient variation across schools in the sample. Some of the variables have been regrouped into a smaller number of categories than were available in the original Edubase data to ensure that there are sufficient numbers of cases available for analysis.
Table 1.4 School Characteristics used in Analysis
Main Characteristic Categories of Main Characteristics
Number of pupils on school roll % pupils receiving free school meals % minority ethnic pupils
% pupils with special educational needs (SEN)
Type of school Community/voluntary controlled, foundation/voluntary aided
Religion Christian, none
Region South, Midlands, North
Specialism (secondary schools only) None, science/technology, other specialism Excellence in Cities participant
Pupil Attainment Statistics
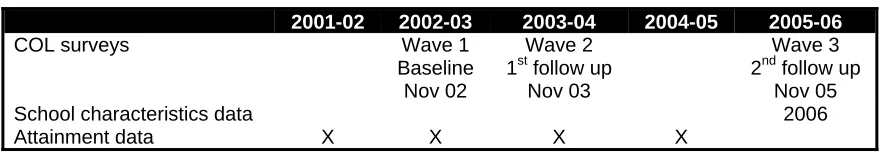
School-level attainment data were obtained from the DfES’ School and College Achievement and Attainment Tables. The attainment data used relates to performance in the school years 2001-02, 2002-03, 2003-04 and 2004-05. Unfortunately data for 2005-2006, i.e. the school year in which the last COL survey was conducted are not yet available. A number of different measures of school performance were used.
For primary schools, attainment was measured in terms of:
• Average points score at Key Stage 2 (KS2) (i.e. average score obtained by pupils across Maths, English and Science KS2 tests);
• Aggregate percentage of pupils achieving Level 4+ in KS2 tests (sum of % pupils across Maths, Science and English);
• Value added KS1 to KS2 (base=100); and
For secondary schools, attainment was measured in terms of:
• Average points score at Key Stage 3 (KS3) (i.e. average score obtained by pupils across Maths, English and Science KS3 tests);
• Aggregate percentage of pupils achieving Level 5+ in KS3 tests (sum of % pupils across Maths, Science and English);
• Value added KS2 to KS3 (base=100);
• Percentage of pupils achieving Level 1 at Key Stage 4 (KS4) (i.e. 5 or more A*-G grade GCSEs or equivalent);
• Percentage of pupils achieving Level 2 at Key Stage 4 (KS4) (i.e. 5 or more A*-C grade GCSEs or equivalent);
• Value added KS3 to KS4 (base=1000); and
• Percentage of ½ day authorised absences.
Unlike KS2 and KS3, it was not possible to use average points scores at KS4 because the way this measure is calculated changed between 2002 and 2005, that is, during the period of the COL evaluation.
Value-added scores measure the progress that individual pupils have made between tests at the end of one Key Stage and tests at the end of the next Key Stage. By controlling for pupils’ prior achievements and abilities they provide a more accurate reflection of schools’ effectiveness than raw performance scores. The value-added scores are centred on 100, which represents the national average. Scores above the base figure indicate pupils at these schools, on average, made greater progress in terms of attainment than was typically the case across England. Measures below the base figure indicate that progress in attainment between Key Stages was below the national average.
[image:10.595.83.524.470.547.2]The school performance indicator "percentage of ½ day authorised absences" was included as a measure that might capture pupil motivation, which, along with attainment, may be influenced by the use of ICT in schools.
Table 1.5 Summary of Available Data by School Year
2001-02 2002-03 2003-04 2004-05 2005-06
COL surveys Wave 1
Baseline Nov 02
Wave 2 1st follow up
Nov 03
Wave 3 2nd follow up
Nov 05
School characteristics data 2006
Attainment data X X X X
1.3 A Measure of E-maturity
A final choice of indicators was made from this initial selection. In making the final choice of indicators the following were taken into consideration. All indicators had to be available for both primary and secondary schools and across all three years of the survey to allow comparisons to be made. Each indicator should appear on only one of the dimensions of E-maturity to ensure that each dimension remained distinct. Indicators were chosen from both the school-level and teacher-level COL questionnaires. However, where the same question was asked in both the school and teacher questionnaires, the school-level indicator was given preference, as there were fewer problems with missing data. Indicators that were highly correlated with other indicators were excluded, as were indicators on which there was little or no variation across schools (e.g. questions asking about the presence of broadband, or attitudes towards the benefits of ICT). All questions were 'closed', that is, offered response options to participants, which the latter were asked to select (by ticking boxes).
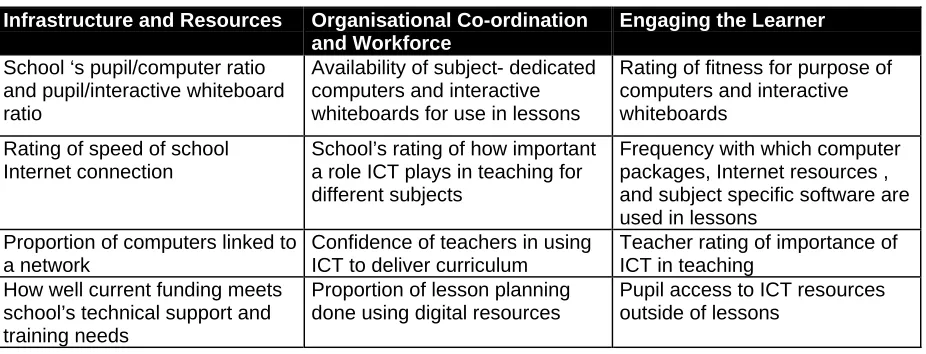
[image:11.595.89.552.508.685.2]The chosen indicators were re-grouped from the original six into three dimensions, taking account of the overlap and similarities: (1) infrastructure and resources, (2) organisational co-ordination and workforce, and (3) engaging the learner, with four indicators on each dimension. A summary of the indicators used on the different dimensions is given below (Table 1.6). Full details on question wording and how scores were assigned for each indicator can be found in Appendix A. Each indicator was given a score from 1 to 3, 3 being the most “E-mature” response. The workshop and subsequent enquiries determined the sequence of least to most E-mature responses, where this was not already apparent from the questions' response options. Scoring questions between1 and 3 ensured that each question was given the same weight in the construction of the E-maturity index. In some instances, this required re-coding response options, typically by merging graded responses. For instance, 'strongly agree' and 'agree' would be re-coded into a single variable indicating agreement, as would be the disagreement statement 'strongly disagree' and 'disagree', leaving 'neither agree nor disagree.
Since each of the three dimensions incorporated four indicators, schools were given a score from 1 to 12 on each dimension. Summing over the three dimensions, schools received an overall maturity score of between 1 and 36, with higher scores representing greater E-maturity.
Table 1.6 Indicators of E-maturity
Infrastructure and Resources Organisational Co-ordination
and Workforce
Engaging the Learner
School ‘s pupil/computer ratio and pupil/interactive whiteboard ratio
Availability of subject- dedicated computers and interactive whiteboards for use in lessons
Rating of fitness for purpose of computers and interactive whiteboards
Rating of speed of school Internet connection
School’s rating of how important a role ICT plays in teaching for different subjects
Frequency with which computer packages, Internet resources , and subject specific software are used in lessons
Proportion of computers linked to a network
Confidence of teachers in using ICT to deliver curriculum
Teacher rating of importance of ICT in teaching
How well current funding meets school’s technical support and training needs
Proportion of lesson planning done using digital resources
PART I
2 E-MATURITY IN SCHOOLS
Part 1 of the report provides an overview of the level of E-maturity in schools in 2005 and of the changes in E-maturity that took place in the three years leading up to 2005. It compares E-maturity scores at wave 3 of the COL survey (2005) with scores at wave 1 (2002) and wave 2 (2003). Overall E-maturity scores are considered alongside scores on the three core dimensions of E-maturity: infrastructure and resources, organisational co-ordination and workforce, and engaging the learner. Using a panel of schools that participated in wave 1 as well as wave 3 of the COL evaluation, we compare patterns of change in E-maturity between and within schools from 2002 to 2005, and explore the association between school characteristics and E-maturity. Separate analyses are presented for primary and secondary schools.
2.1 The Level of E-maturity in Schools
In 2005, the average E-maturity score in primary schools was 24.8 points compared to 24.9 points in secondary schools, rising from 20.4 and 22.3 points respectively in 2002 (Tables 2.1 and 2.2). Although the nominal increases in the mean score to 2005 were for both types of schools fairly modest (4.4 points for primary schools; 2. 7 points for secondary schools), they represent a statistically significant improvement on E-maturity in 2002 (and also 2003). As these figures indicate, whereas in 2002, primary schools' average E-maturity lagged visibly behind that of secondary schools (20.4 versus 22.3 points), by 2005, primary schools had caught up with secondary schools and E-maturity scores were about the same for both types of schools.
Table 2.1 Summary of E-maturity Scores in Primary Schools
2002 2003 2005 Change 2002-05
E-maturity
Mean 20.4 22.1 24.8 4.4 * S.D 2.5 2.7 2.9
Min 13.3 16.6 15.6 Max 27.7 30.2 31.6
Infrastructure
Mean 7.2 7.9 8.4 1.2 *
S.D 1.3 1.4 1.4 Min 4.0 4.5 5.0 Max 11.0 11.0 11.5
Organisation/Co-ordination
Mean 6.4 7.1 8.2 1.8 *
S.D 1.1 1.1 1.4 Min 4.2 4.3 4.5 Max 9.8 10.7 11.8
Engaging the learner
Mean 6.7 7.2 8.1 1.4 *
S.D. 1.1 1.0 1.1 Min 4.4 5.2 4.7 Max 10.2 10.2 10.8
Base N 271 202 182
Note: * statistically significant difference 2002-2005 at 5% level
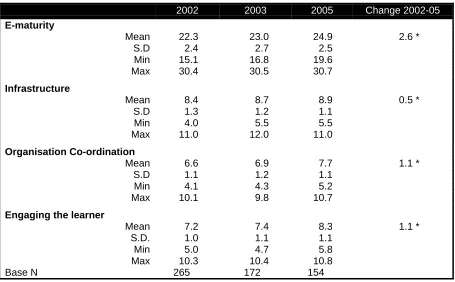
Table 2.2 Summary of E-maturity Scores in Secondary Schools
2002 2003 2005 Change 2002-05
E-maturity
Mean 22.3 23.0 24.9 2.6 *
S.D 2.4 2.7 2.5
Min 15.1 16.8 19.6
Max 30.4 30.5 30.7
Infrastructure
Mean 8.4 8.7 8.9 0.5 *
S.D 1.3 1.2 1.1
Min 4.0 5.5 5.5
Max 11.0 12.0 11.0
Organisation Co-ordination
Mean 6.6 6.9 7.7 1.1 *
S.D 1.1 1.2 1.1
Min 4.1 4.3 5.2
Max 10.1 9.8 10.7
Engaging the learner
Mean 7.2 7.4 8.3 1.1 *
S.D. 1.0 1.1 1.1
Min 5.0 4.7 5.8
Max 10.3 10.4 10.8
Base N 265 172 154
[image:13.595.85.540.427.709.2]Despite the significant improvements in E-maturity in both primary and secondary schools between 2002 and 2005, there appears to be scope for further improvement since the average score on overall E-maturity was only around 70% of the maximum possible (36). The maximum score in primary schools was 31.6 out of a possible 36, whilst the minimum was 15.6. The corresponding figures for secondary schools were 30.7 and 19.6.
2.2 Changes in E-maturity 2002 - 2005
[image:14.595.92.431.367.748.2]The average increase between 2002 and 2005 in overall E-maturity score in primary schools was 4.5 points. The average increase in E-maturity in secondary schools was smaller at 2.7 points, which, in part, reflected the stronger starting position of secondary schools in 2002. Primary schools significantly increased their scores on all three dimensions with the biggest average change (1.9 points) occurring on the organisational co-ordination dimension. Among secondary schools, there was a small, though still statistically significant change of 0.5 points in scores on the infrastructure dimension. Larger changes occurred on the other two dimensions, organisational co-ordination and engaging the learner, on which scores in 2002 had been lower. The average increase on these two dimensions was 1.1 points.
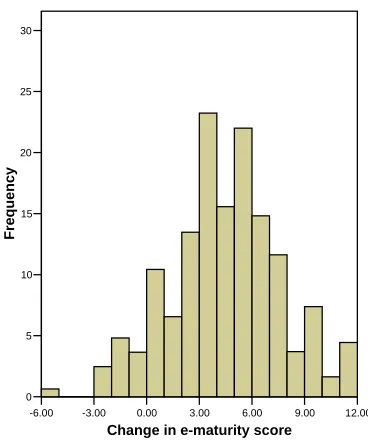
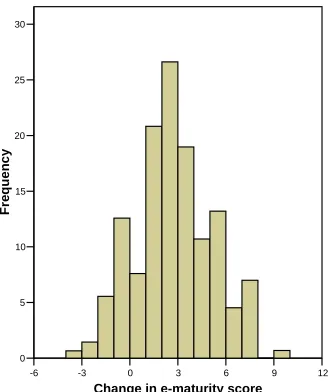
Figures 2.1 and 2.2 show the distribution of the change in schools’ E-maturity scores between 2002 and 2005. A comparison reveals that more primary schools than secondary schools increased their scores by comparatively high values of 9 points or more. Whereas the majority of primary and secondary schools increased their E-maturity scores during the period1, in eight percent of primary schools and 15 percent of secondary schools E-maturity scores declined over this period.
Figure 2.1 Change in Primary Schools’ E-maturity Score 2002-2005
1
Their change value was greater than 0, that is, to the right of the value on the horizontal scale.
-6.00 -3.00 0.00 3.00 6.00 9.00 12.00 Change in e-maturity score
0 5 10 15 20 25 30
[image:14.595.171.355.406.627.2]Figure 2.2 Change in Secondary Schools’ E-maturity Score 2002-2005
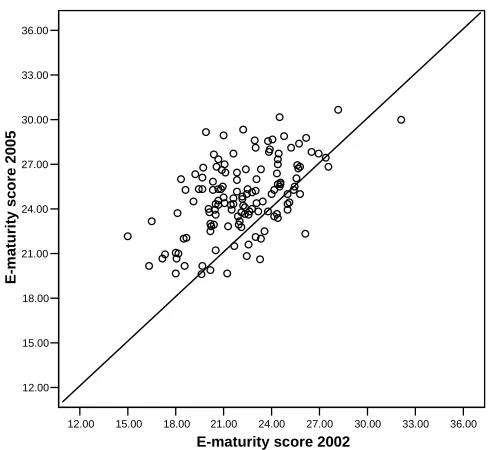
[image:15.595.181.408.450.664.2]Figures 2.3 and 2.4 provide a further, yet more detailed illustration of changes in E-maturity scores between 2002 and 2005, plotting individual schools' scores in each year. The diagonal line drawn in both plots divides schools with improved scores (top half) and schools with reduced scores (bottom half) in 2005. The greater scattering of points on the graph for primary schools reflects the fact that primary schools saw greater increases in E-maturity scores between 2002 and 2003 than did secondary schools.
Figure 2.3 Scatterplot of 2002 and 2002 E-maturity Scores: Primary Schools
12.00 15.00 18.00 21.00 24.00 27.00 30.00 33.00 36.00 E-maturity score 2002
12.00 15.00 18.00 21.00 24.00 27.00 30.00 33.00 36.00
E-mat
u
rity sc
o
re 2005
-6 -3 0 3 6 9 12
Change in e-maturity score
0 5 10 15 20 25 30
Fre
q
uen
c
Figure 2.4 Scatterplot of 2002 and 2005 E-maturity Scores: Secondary Schools
2.3 The Path to E-maturity
To gain a better understanding of how schools progressed towards greater E-maturity, we compared changes over time in each of the three dimensions of the E-maturity index. The schools themselves were divided into three categories of 'high', 'medium' and 'low' achievers of E-maturity. This distinction was based on the size of the difference of a school's aggregate E-maturity score and the grand mean of the E-maturity score for all primary or secondary schools. Schools falling more than one half of a standard deviation below the grand mean were classed as 'low' achievers while those achieving more than one half of a standard deviation about the grand mean were classed as 'high' achievers. Those within one half of a standard deviation of the mean were labelled 'medium' performers. Drawing the line at one-half of a standard deviation ensured sufficient difference between the three groups of schools and their E-maturity scores to expect distinct school features and characteristics to affect the scores, while assigning to each group a sufficient number of cases that would be required for this analysis. In the subsequent comparisons, we examined (1) how the different dimensions of E-maturity combined to determine a school’s overall performance and (2) how the final position that schools obtained on E-maturity by 2005 was influenced by their starting position in 2002.
Figure 2.5 and 2.6 show the results of the comparison of high, medium and low performing schools' E-maturity scores obtained on the three dimensions of E-maturity at wave 3 (2005). The comparison reveals that, on aggregate, the most E-mature schools outperformed the less E-mature schools on all three dimensions. This was true for both, primary and secondary schools. Furthermore, nominal differences in the component scores were similar across the three dimensions, although highly E-mature primary schools performed particularly well on the organisational co-ordination dimension when compared to other primary schools with lower total scores.
12.00 15.00 18.00 21.00 24.00 27.00 30.00 33.00 36.00
E-maturity score 2002 12.00
15.00 18.00 21.00 24.00 27.00 30.00 33.00 36.00
E
-ma
tu
rit
y
sc
o
re 20
Figure 2.5 Primary Schools' E-maturity Scores, by Dimension and Total Score Level (2005)
6.9 6.8 8.49.2 8.1 8.1
9.6 9.1 7.2 0 2 4 6 8 10 12
[image:17.595.135.481.303.437.2]Infrastructure Org co-ordination Engaging learner Mean score Low Medium High
Figure 2.6 Secondary Schools' E-maturity Scores, by Dimension and Total Score Level (2005)
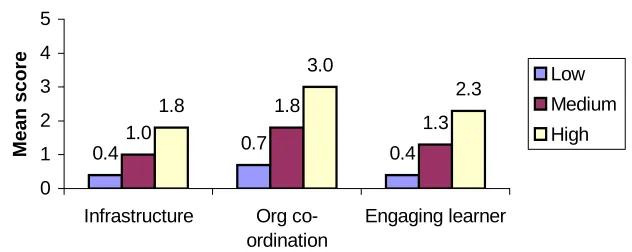
Figures 2.7 and 2.8 illustrate the changes in scores for the three E-maturity dimensions between 2002 and 2005 for the three categories of low, medium and high scoring primary and secondary schools. For primary schools, Figure 1.7 reveals a particularly strong increase in scores for organisational co-ordination across all three categories of schools. By comparison, changes among secondary schools were more similar between the three dimensions. For both, primary and secondary schools, the charts illustrate that schools with higher levels of E-maturity in 2005 also experience the proportionately greater change in individual E-maturity dimensions since 2002.
Figure 2.7 Change in Primary Schools' E-maturity Scores 2002-2005, by Dimension and Total Score Level in 2005
6.7 7.2 8.8 7.8 8.2 9.8 8.7 9.2 7.9 0 2 4 6 8 10 12
Inf ras truc ture Org Co-ordination Engaging Learner Mean score Low Medium High 0.7 0.4 1.0 1.8 1.3 1.8 3.0 2.3 0.4 0 1 2 3 4 5
[image:17.595.160.476.598.724.2]Figure 2.8 Change in Secondary Schools' E-maturity Scores 2002-2005, by Dimension and Total Score Level in 2005
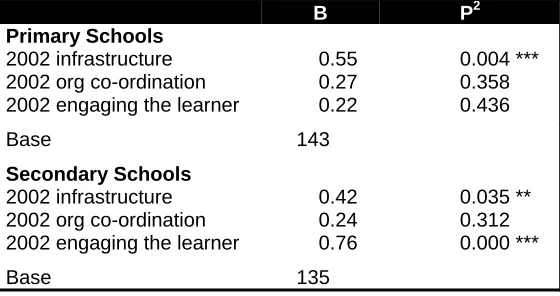
The relatively greater increases in E-maturity scores in the three years to 2005 appeared to have been facilitated by more advantageous conditions that the faster maturing schools had experienced in the base year of 2002. This was the result of regression analysis that compared the relative strength of the relationship between schools’ scores on the three E-maturity dimensions in 2002 and their overall E-E-maturity score in 2005 (Table 2.3).
Among primary schools, E-maturity in 2005 was statistically significantly associated with the schools' performance on infrastructure in 2002. No other E-maturity dimension score for 2002 was independently associated to the aggregate E-maturity score in 2005. In contrast, secondary schools' aggregate E-maturity score for 2005 was strongly statistically associated with their 2002 score on the “engaging the learner” dimension as well as the 2002 infrastructure dimension.
The level of organisation co-ordination of IT issues in 2002 was statistically associated with E-maturity in neither primary nor secondary schools. However, as illustrated earlier (Figures 2.7 and 2.8), primary schools made greatest improvements in their organisational co-ordination of ICT issues, which greatly contributed to their increased E-maturity score. Overall, thus, primary and secondary schools appear to have taken somewhat different paths towards greater E-maturity in the three years to 2005, but have achieved very similar aggregate levels of E-maturity and, perhaps most importantly, similar E-maturity scores on the dimension of ‘engaging the learner’ (see Section 2.1).
0.7 0.7 0.5
1.1 1.1 0.9 1.4
1.5 0.0
0 1 2 3 4 5
Infrastructure Org co-ordination
Engaging learner
Mean score
Table 2.3 Association between Aggregate E-maturity in 2005 and E-maturity Dimensions in 2002 - Regression Results for Primary and Secondary Schools
B P2
Primary Schools
2002 infrastructure 0.55 0.004 *** 2002 org co-ordination 0.27 0.358 2002 engaging the learner 0.22 0.436
Base 143
Secondary Schools
2002 infrastructure 0.42 0.035 ** 2002 org co-ordination 0.24 0.312 2002 engaging the learner 0.76 0.000 ***
Base 135
Note: *** statistically significant at 1% level ** statistically significant at 5% level
2
3 E-MATURITY AND SCHOOL CHARACTERISTICS
This section of the report considers the relationship between schools’ overall E-maturity score in 2005 and various school characteristics, including the profile of the pupils, the type of school, or the school's participation in government initiatives, such as the Excellence in Cities programme. The characteristics of schools classed as having high, medium or low E-maturity at wave 3 of the COL survey were compared in order to provide a picture of whether high achieving schools differ systematically from those that are less E-mature. Regression analysis was used to examine the strength of association between different characteristics and school’s level of E-maturity in 2005. Subsequent analysis looked at change in E-maturity and considered whether schools that had improved their E-maturity position relative to other schools between 2002 and 2005 differed from schools whose position had stayed the same or got worse.
3.1 The Profile of E-mature Schools
Tables 3.1 and 3.2 provide a snapshot comparison of the key characteristics of primary and secondary schools with high, medium, and low levels of E-maturity in 2005. We restrict this presentation to schools that participated in the COL evaluation in both, 2002 and 2005. The school characteristics pertain to early 2006, when the data were obtained from the relevant sources.
Whereas the comparison is mainly descriptive, we specifically analyse the statistical significance of differences in the characteristics of schools with high and with low E-maturity scores in 2005. These two groups of schools will be the focus of additional analysis in later parts of this report, when we seek to draw out the key features of schools that made some of the greatest progress towards E-maturity in recent years.
In brief, the main findings from the comparison of E-maturity scores for primary schools are:
• Schools scoring high on E-maturity had, on average, a significantly higher proportion of pupils with special educational needs.
• School type was associated with E-maturity. High E-maturity schools were significantly less likely to be voluntary aided schools and more likely to be community schools.
• E-mature schools were more likely to be Roman Catholic than low scoring schools, whilst low scoring schools were most likely to have no religious denomination. However, the differences between high and low scoring schools were not statistically significant.
• A higher proportion of schools classed as having high E-maturity were part of Excellence in Cities (14%) compared with low scoring schools (4%). However, the difference between groups was not statistically significant.
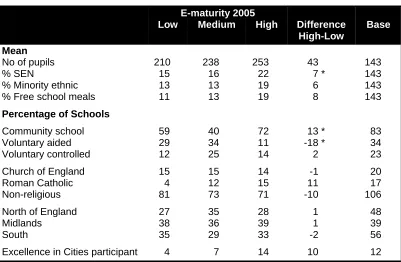
Table 3.1 Characteristics of Primary Schools by 2005 E-maturity Score
E-maturity 2005
Low Medium High Difference
High-Low
Base
Mean
No of pupils 210 238 253 43 143
% SEN 15 16 22 7 * 143
% Minority ethnic 13 13 19 6 143
% Free school meals 11 13 19 8 143
Percentage of Schools
Community school 59 40 72 13 * 83
Voluntary aided 29 34 11 -18 * 34
Voluntary controlled 12 25 14 2 23
Church of England 15 15 14 -1 20
Roman Catholic 4 12 15 11 17
Non-religious 81 73 71 -10 106
North of England 27 35 28 1 48
Midlands 38 36 39 1 39
South 35 29 33 -2 56
Excellence in Cities participant 4 7 14 10 12
Note: * statistically significant different between high and low E-maturity schools at 5% level
The main findings for secondary schools were:
• There was a statistically significant relationship between schools’ E-maturity score and their subject specialism. Sixty-one percent of the most E-mature schools were specialist science or technology schools compared with only 29% of schools with low E-maturity scores. Thirty-seven percent of schools with low E-maturity scores had no specialism compared with only 12% of high scoring schools. Schools classed as “medium” in terms of E-maturity were most likely to specialise in a non-science subject, e.g. humanities or languages.
• A higher proportion of schools classed as having high E-maturity (48%) were part of Excellence in Cities compared with schools classed as having low E-maturity (31%). However, this difference was not statistically significant.
Table 3.2 Characteristics of Secondary Schools by 2005 E-maturity Score
E-maturity 2005
Low Medium High Difference Base
Mean
No of pupils 1091 1017 1092 1 135
% SEN 17 15 18 1 135
% Minority ethnic 18 15 20 2 135
% Free school meals 15 13 18 3 135
Percentage of schools
Community school 64 62 66 2 85
Foundation school 22 20 22 0 29
Voluntary aided 13 16 11 -2 20
Church of England 12 21 10 -2 20
Roman Catholic 15 8 19 4 19
Non-religious 72 71 70 -2 95
North of England 20 38 30 10 46
Midlands 38 50 35 -3 41
South 43 12 35 -8 48
Science/technology specialism 29 24 61 32 * 51
Other specialism 34 63 27 -7 55
No specialism 37 13 12 -25 * 29
Excellence in Cities (EIC) participant
31 33 48 17 65
Note: * Statistically significant difference at 5% level
3.2 School Characteristics and Progress on E-maturity
In order to establish the extent to which E-maturity scores achieved in 2005 were affected by the school characteristics listed in Tables 3.1 and 3.2, a series of regression analyses were conducted. The analyses controlled for a school’s E-maturity score in 2002 and their results, therefore, provide an indication of how school characteristics are related to progress on E-maturity. We also controlled for the number of teacher questionnaires that each school returned (up to 3), as we expected returns might reflect responses or, more generally, attitudes to E-maturity. In the end, this variable proved not to be associated with either.
In interpreting the findings, it must be borne in mind that the school characteristics relate a shortly after the end of the E-maturity observation period rather than coincide with the latter. It is, thus, possible that some of the schools' characteristics may have had changed in the intermittent period, although major changes are unlikely. Regression analysis B-coefficients shown in the following tables that, unlike percentages or number, relate to categorical3 data are estimated in relation to a comparator variable, which we indicate by placing it in round brackets.
3
The main statistically significant findings from the regression analysis for primary schools are:
• A positive association between pupil numbers and progress on E-maturity. Controlling for their level of E-maturity in 2002, schools with higher numbers of pupils scored higher on E-maturity in 2005.
[image:23.595.85.415.214.496.2]• A positive association between the percentage of pupils with special educational needs and progress on E-maturity. Controlling for E-maturity in 2002, schools with a higher proportion of SEN pupils scored higher on E-maturity in 2005.
Table 3.3 Association between School Characteristics and E-maturity 2005 – Regression Results for Primary Schools
B P
No of pupils 0.01 0.012 **
% SEN 0.10 0.002 ***
% Minority ethnic -0.003 0.825
% Free school meals -0.01 0.767
Type of school (Foundation)
Community/voluntary controlled school -0.02 0.969
Religion (non-denominational)
Christian 0.64 0.230
Geography (North)
Midlands -0.89 0.208
South -0.84 0.119
EIC participant (No)
Yes 0.19 0.821
W1 E-maturity 0.35 0.007 ***
Returned Teachers Questionnaire 0.96 0.130
Base 143
Note: EIC = Excellence in Cities
***statistically significant at the 1% level ** statistically significant at the 5% level
The main statistically significant findings for secondary schools are:
• A negative association between pupil numbers and progress on E-maturity. Controlling for their level of E-maturity in 2002, schools with higher numbers of pupils scored lower on E-maturity in 2005. This finding is the inverse of that for primary schools and may be a reflection of larger schools already reporting higher E-maturity scores than smaller schools at the start of the observation period. This gave them less scope to improve.4
Table 3.4 Association between School Characteristics and E-maturity 2005 – Regression Results for Secondary Schools
B P
No of pupils -0.002 0.011 **
% SEN -0.001 0.980
% Minority ethnic 0.004 0.707
% Free school meals -0.001 0.960
Type of school (Foundation or voluntary aided)
Community/voluntary controlled school 0.56 0.209
Christian 0.21 0.607
Location (North of England)
Midlands 0.23 0.640
South -0.24 0.654
EIC participant (No)
Yes 0.72 0.172
Specialist school (Science & technology)
Other specialism -1.15 0.006 ***
None -2.29 0.002 ***
W1 E-maturity 0.41 0.000***
Returned Teachers Questionnaire 0.43 0.276
Base 135
Note: *** statistically significant at 1% level ** statistically significant at the 5% level
Comparing Upward Movers vs. Downward Movers
For both, primary and secondary schools, the logistic regressions found statistically significant differences in the characteristics of upward movers compared to downward movers (Tables 3.5 and 3.6; first results column). In addition, for primary schools, there were also statistically significant differences between upward movers and non-movers (Table 3.5; second results column).5
Turning first to primary schools and the comparison of upward and downward movers, the statistically significant results are:
• The higher the number of pupils at the school, the more likely the school was to be an upward mover. Although the odds ratio itself was small (1.01), because the odds increased per pupil, the school size effect was nevertheless substantial.
• The higher the proportion of pupils with special educational needs, the more likely the school was to be an upward mover.
• The odds of being an upward mover rather than a downward mover were reduced for schools that were part of the Excellence in Cities programme. It is unclear from the data why this should be the case.
The comparison of upward movers and non-movers among primary schools yielded somewhat different results:
• Primary schools were less likely to be upward movers than non-movers the larger the school.
• A greater proportion of pupils from ethnic minorities increased the odds of a primary school being an upward mover rather than a non-mover.
• A larger proportion of pupil eligible for free school meals was associated with reduced odds of the school being an upward mover rather than a non-mover.
5
Table 3.5 Association between school characteristics and progress on E-maturity - logistic regression results for primary schools
Upward Movers vs. Downward Movers
Upward Movers vs. Non-Movers
Odds Ratio P Odds ratio P
No of pupils 1.01 0.002 *** 0.995 0.036 **
% SEN 1.10 0.029 ** 0.979 0.536
% Minority ethnic 1.01 0.709 1.03 0.017 **
% Free school meals 1.00 0.966 0.949 0.026 **
Type of school (Foundation or voluntary-aided)
Community/voluntary controlled school
1.03 0.963 0.976 0.972
Religion (non-denominational)
Christian 0.76 0.681 0.840 0.767
Location (North)
Midlands 0.85 0.864 0.813 0.749
South 0.45 0.318 0.371 0.114
EIC participant (No)
Yes 0.13 0.065 * 1.89 0.506
Returned Teachers Questionnaire
2.23 0.308 3.44 0.115
Base 82 106
Note: *** statistically significant at 1% level ** statistically significant at the 5% level * statistically significant at the 10% level
For secondary schools, statistically significant differences were only found in the comparison of upward movers and downward movers. The results revealed:
• A greater number of pupils reduced the odds of a school being an upward mover rather than a downward mover.
• The higher the proportion of ethnic minority pupils, the greater the school's odds of being upward mover.
• Christian secondary schools were more likely to be upward movers than non-religious schools.
Table 3.6 Association between school characteristics and progress on E-maturity - logistic regression results for secondary schools
Upward Movers vs. Downward Movers
Upward Movers vs. Non-Movers
B P B P
No of pupils 0.998 0.019 ** 1.00 0.262
% SEN 0.95 0.270 1.00 0.989
% Minority ethnic 1.03 0.092 * 1.00 0.870 % Free school meals 1.02 0.642 1.00 0.934
Type of School (Foundation)
Community/voluntary controlled school
2.18 0.335 1.63 0.484
Religion (Non-denominational)
Christian 5.28 0.013 ** 1.13 0.831
Location (North of England)
Midlands 2.44 0.326 1.24 0.753
South 0.52 0.524 0.77 0.710
EIC participant (No)
Yes 0.30 0.210 1.14 0.838
Specialist school (Science/technology)
Other specialism 0.53 0.368 0.95 0.929
None 0.14 0.078 * 2.38 0.303
Returned Teachers Questionnaire
1.10 0.890 1.57 0.444
Base 67 101
Note: ** statistically significant at 5% level * statistically significant at 1% level
PART 2
4 E-MATURITY AND THE PERFORMANCE OF SCHOOLS AND
THEIR PUPILS
The aim of the second stage of the analysis, written up in this second part of the report, is to relate changes in schools' E-maturity to schools' performance. In other words, we want to observe the strength of association, if any, between E-maturity (and change in E-maturity) and attainment levels in schools.
For the analysis, pupil attainment data, received from the Department for Education and Skills (DfES) and pertaining to the schools in sample, were appended to the school data set. Attainment data were obtained for Key Stages 2 (primary schools) and Key Stages 3 and 4 (secondary school). Data covered school performance from the school year 2001/02 up until 2004/05. Details on the different measures of school performance used can be found in the introduction to the report.
In order to assess the association between E-maturity and school attainment, two types of analysis were undertaken. First, we conducted bivariate regression analyses, which measured the strength of association between schools' E-maturity score and one of a number of performance indicators in a given year. Second, we were concerned with establishing how change in schools' E-maturity between the COL evaluation waves might have been associated with school performance. To do so, regression analysis was used to measure the association between changes in E-maturity scores and performance data. We also reverted to our tri-partite division of low, medium and high performing schools that was used in Stage 1 of the analysis to determine the distinctive characteristics of ‘upward movers’ on the E-maturity scale of primary and secondary schools. Here, we used logistic regression analysis of this division to observe associations with schools performance. For the most part, these analyses proved to add little to the findings of the regression analyses, and, for this reason, we limit reporting of their results to reproducing the logistic regression tables in Appendix C.
4.1 Some Caveats
We nevertheless analysed changes in E-maturity and their relationship with performance indicators in waves 1 and 2 because we wanted to observe the effect of allowing for a time lag on the association between the two types of indicators. Specifically, it was assumed that improvements in E-maturity at schools would not immediately be associated with performance changes, but that the latter would take some time to emerge as pupils began to benefit from IT. Because performance data are not yet available for the school year 2005/06 it was not possible to allow for E-maturity to 'bed in' and observe associations with performance data following wave 3 of the COL evaluation. This was, however, possible by using COL evaluation data for wave 1 (2002) and wave 2 (2003), because we had performance data for two years after completion of wave 2. This said, the comparison was hampered by the shorter period of change in E-maturity that was covered and the consequent smaller change that was observable.
Performance data are frequently highly correlated, which precludes their concurrent use in regression analysis and is also likely to produce the same analysis results for different performance indicators. For this reason, we have restricted the analyses to variables, which we considered most valuable and insightful in the broader context of the study, removing other variables from the analyses6. Because the remaining variables were statistically highly correlated - as we show in Tables A.2 and A.3 in Appendix B , separate regression and logistic regression analyses were conducted for each of the relevant indicators.
As before, we report separately for primary and secondary schools, beginning with the former, and focussing initially on changes between waves 1 and 3. All results are shown for analyses after controlling for the school characteristics discussed in Part 1. The school variables are not shown in the Tables reproduced here, but where the inclusion of school characteristics changed the statistical significance of analysis results, this will be pointed out.
Table 4.1 below summarises key statistics for the first (2002) and the third (2005) waves of the COL evaluation used in the following analyses. With the exception of the mean percentage of pupils in secondary schools obtaining A* - C grades and the mean percentage of authorised absences in both primary and secondary schools, there were no substantive changes in performance rates recorded at the sampled schools between 2002 and 2005. Authorised absences decreased in both types of school, while the proportion of A*-C grades in secondary schools increased. Note that there were no data available for primary schools' Value Added between KS1 and KS2 in 2002.
In the following section, we turn to reporting the findings from the analyses of the association between (changes in) E-maturity and performance, beginning with primary schools.
Table 4.1 School Performance Data Background Statistics
2002 2005
Primary Schools
KS2 Average Points (Mean) 27.7 28.0
Min 22.6 22.6
Max 31.9 31.6
KS1-KS2 Value Added (Mean) N/A 100.3
Min N/A 97.4
Max N/A 103.1
% Authorised Absences (Mean) 5.3 4.7
Min 3.0 1.2
Max 11.0 8.7
E-maturity Score (Mean) 20.5 25.0
Min 15.3 15.6
Max 26.3 31.6
Secondary Schools
KS3 Average Points (Mean) 33.9 34.7
Min 26.8 27.5
Max 45.3 44.7
KS2-KS3 Value Added (Mean) 99.9 99.7
Min 96.3 96.7
Max 104.0 102.9
% A*-C (Mean) 49.9 56.6
Min 6.0 18.0
Max 100 100
% A* - G (Mean) 90.7 91.9
Min 68.0 60.0
Max 100 100.0
KS3-KS4 Value Added (Mean) 98.4 994.6
Min 92.4 937.0
Max 106.8 1064.2
% Authorised Absences (Mean) 7.7 6.6
Min 3.5 2.3
Max 13.7 11.5
E-maturity Score (Mean) 22.1 24.9
Min 15.0 19.6
Max 32.1 30.7
Base: Primary and secondary schools participating in both wave 1 (2002) and wave 3 (2005) of the Curriculum Online evaluation
4.2 Findings - Primary Schools
Table 4.2 Association Between Performance Indicator in Year 2002 and E-maturity at Wave 1 (2002) - Multivariate Regression Results for Primary Schools
B P
Average Points 2002 0.13 0.422
% Authorised Absences 2002 0.04 0.730
Base 121
Note: Results after controlling for school characteristics. Separate regressions run for each indicator.
Table 4.3 Association Between Performance Indicator in Year 2005 and E-maturity at Wave 3 (2005) - Multivariate Regression Results for Primary Schools
B P
Average Points 2005 -0.01 0.980
Value added 2005 -0.12 0.649
% Authorised Absences 2005 -0.22 0.637
Base 121
Note: Results after controlling for school characteristics. Separate regressions run for each indicator.
The association between performance indicators and the change in E-maturity scores was estimated by calculating the difference between scores in 2002 and 2005, and regressing these against the performance indicators. Because it may conceivably be the case that different initial E-maturity scores have differential effects on the propensity to improve on these scores in later years, the regression analyses also controlled for the initial score achieved in 2002.7 The high level of statistical significance between the nominal change in E-maturity and the E-E-maturity score at wave 1 of COL evaluation (2002) confirmed this expectation; E-maturity at the beginning of the analysis period was the strongest predictor of change in E-maturity over the following three years. By including the 2002 E-maturity value, we effectively created a statistical 'level playing field' between schools.
The analysis again found no evidence any association between E-maturity scores and pupils' average attainment scores during this period (Table 4.4). However, change in E-maturity was statistically significantly and inversely associated with the percentage of authorised absences in 2002. This suggests that, on average, schools that achieved greater changes in E-maturity originally reported lower percentages of authorised absences; on average, a one-point increase in E-maturity scores between 2002 and 2005 was associated with a 0.4 percentage points lower rate of authorised absences in 2002. No such association was discernible for absences in 2005, indicating that schools with higher authorised absence rates were catching up in terms of their E-maturity.
[image:31.595.87.398.248.325.2]Table 4.4 Association between Performance Indicators and Change in E-maturity 2002 to 2005 - Multivariate Regression Results for Primary Schools
B P
W1 E-maturity -0.60 0.000 ***
Average Points 2002 -0.15 0.488
Average Points 2005 -0.002 0.994
W1 E-maturity -0.61 0.000 ***
% Authorised Absences 2002 -0.41 0.030 ** % Authorised Absences 2005 -0.29 0.374
Base 121
Note: Results after controlling for school characteristics. Separate regressions run for each indicator. *** statistically significant at 1% level ** statistically significant at 5% level
4.3 Findings – Secondary Schools
In comparison to primary schools, a larger set of performance indicators was available for investigating associations with E-maturity scores in secondary schools. The analyses highlighted a number of positive and statistically significant associations between scores and performance indicators.
Table 4.5 Association Between Performance Indicator in Year 2002 and E-maturity at Wave 1 (2002) - Multivariate Regression Results for Secondary Schools
B P
KS3 Average Points 2002 0.19 0.068*
KS2-3 value added 2002 0.16 0.480
% A* - C KS4 2002 0.05 0.001 ***
% A* - G KS4 2002 0.04 0.350
KS3-4 value added 2002 0.14 0.134
Authorised Absences 2002 -0.25 0.064 *
Base 131
Note: Results after controlling for school characteristics. Separate regressions run for each indicator. *** statistically significant at 1% level ** statistically significant at 5% level * statistically significant at 10% level
The average Key Stage 3 point score for 2002 and the percentage of pupils achieving A*-C grades at KS4 2002 only turned statistically significant after including the school characteristics as control variables in the regression analysis. In contrast, the variable measuring the percentage of authorised absences in 2002 was statistically significant in the initial models that did not control for school characteristics as well as the final model shown in Table 4.5.
[image:33.595.87.449.550.680.2]Table 4.6 illustrates similar findings with respect to the association between E-maturity scores at wave 3 of the COL evaluation in 2005 and the three performance indicators pertaining to that year. Average point scores achieved by pupils at Key Stage 3 and the proportion of pupils achieving A* - C grades at Key Stage 4 were again positively and statistically significantly associated with E-maturity scores, whereas the percentage of authorised absences was inversely related to E-maturity scores. In addition, the value added by schools between Key Stages 3 and Key Stages 4 in 2005 was statistically significantly associated with E-maturity. As in 2002, thus, schools reporting higher E-maturity scores also reported higher attainment levels and lower absences.
Table 4.6 Association Between Performance Indicator in Year 2005 and E-maturity at Wave 3 (2005) - Multivariate Regression Results for Secondary Schools
B P
KS3 Points 2005 0.25 0.018 **
KS2-3 value added 2005 0.06 0.823
% A* - C KS4 2005 0.04 0.002 ***
% A* - G KS4 2005 0.07 0.139
KS3-4 value added 2005 0.03 0.032 **
% Authorised Absences 2005 -0.24 0.066 *
Base 131
Average point scores at Key Stage 3 and the percentage of authorised absences become statistically significantly associated with E-maturity scores only after the inclusion of the school characteristics in the regression model. No other variables were affected.
[image:34.595.87.454.264.550.2]Given these preliminary results from the cross-sectional analysis of the association between E-maturity and performance indicators in 2002 and 2005, it is unsurprising to see that the same measures were statistically significantly associated with changes in E-maturity between 2002 and 2005 (Table 4.7). Average points at Key Stage 3 in 2002 and 2005, and the percentage of pupils achieving A* - C grades at Key Stage 4 in 2002 and 2005 were all statistically significantly associated with increases in E-maturity during that time. However, the association between A* - C grades in 2002 and E-maturity change was only marginally statistically significant.
Table 4.7 Association between Performance Indicators and Change in E-maturity 2002 to 2005 - Multivariate Regression Results for Secondary Schools
B P
W1 E-maturity -0.64 0.000 ***
KS3 Points 2002 -0.43 0.025**
KS3 Points 2005 0.52 0.010**
W1 E-maturity -0.60 0.000 ***
KS23 Value added 2002 -1.00 0.679
KS23 Value added 2005 -0.04 0.866
W1 E-maturity -0.63 0.000 ***
% A* - C KS4 2002 -0.04 0.070 *
% A* - C KS4 2005 0.06 0.005 ***
W1 E-maturity -0.61 0.000 ***
% A* - G KS4 2002 0.05 0.252
% A* - G KS4 2005 0.01 0.916
W1 E-maturity -0.63 0.000 **
KS34 Value added 2002 0.06 0.534
KS34 Value added 2005 0.02 0.199
W1 E-maturity -0.60 0.000 ***
% Authorised Absences 2002 -0.06 0.687 % Authorised Absences 2005 -0.24 0.085 *
Base 131
Note: Results after controlling for school characteristics. Separate regressions run for each indicator. *** statistically significant at 1% level
** statistically significant at 5% level * statistically significant at 10% level
The percentage of authorised absences was inversely statistically associated with increased E-maturity, but only with respect to absence statistics relating to 2005. Neither the percentage of pupils achieving A* - G grades at Key Stage 4, nor the schools' value added between Key Stages 3 and 4 was statistically related to E-maturity.
In the case of the average points score achieved at Key Stage 4 and the proportion of pupils achieving A* - C grades at Key Stage 4, the coefficients for 2002 and 2005 change signs from
negative to positive.9 The regression analyses measure the association between
independent variables (here: scores and grades) and the dependent variable (here: the change in E-maturity scores) after controlling for all other variables' influence. This result thus shows that, all else equal, increases in E-maturity were associated with lower average
9
scores and grades in 2002, but higher scores and grades in 2005. The 'best' performers in terms of improved E-maturity, therefore, were those with lower performance scores at the start, and higher performance scores at the end of the observation period.
The logistic regression analyses that compared the performance indicators of schools, which, between 2002 and 2005, moved upwards in the tertile distribution of E-maturity scores with those that moved downwards in the distribution confirmed these findings only for A*- C grades in 2002 (see Table A.5 in Appendix C).
Overall, the analyses suggest a positive association between improvements in E-maturity and improvements in performance during the period from 2002 to 2005 in secondary schools.
4.4 Additional Analysis of Waves 1 and 2
The above analyses have given some indication of the associations between E-maturity or changes in E-maturity and the performance of schools in terms of their pupils' attainment and the prevalence of authorised absences. The analyses assumed that the comparisons of the indicators were not substantially affected by differences in the timing of their measurements.
However, it would be more realistic to expect a time lag to occur between schools achieving a given level of E-maturity or improvement in E-maturity and associated changes in performance indicators. Unfortunately, in the absence of performance indicators for more recent years, this assumption could not be tested for E-maturity scores and change values in 2005. However, it is possible to test the assumption using data from the second wave of the COL evaluation, conducted in 2003, since performance data are available for 2004 and 2005 as well as 2003. This said, any analysis of the association between change in E-maturity and performance indicators is hampered by the slow change in E-maturity. Between 2002 and 2003, E-maturity scores among the primary schools in the sample increased from, on average, 20.5 to 22.2; while they increased from 22.3 to 23.1 for secondary schools. Given these small changes, it is less likely that association with performance indicators will emerge.10 Moreover, E-maturity scores continued to change after 2003 (wave 2) and up to the years for which performance data were available. Insofar as the size and timing of these changes varied between schools, it is conceivable that these variations would have affected estimates of the association between changes in E-maturity and performance indicators beyond 2003.
Tables 4.8 and 4.9 summarise the results of the multivariate regression analyses for primary and secondary schools respectively. For greater readability, we have only re-produced statistically significant associations. Neither for primary nor for secondary schools do consistent statistical associations emerge.
Table 4.8 Association between Performance Indicator in Various Years and Change in E-maturity between 2002 and 2003 - Multivariate Regression Results for Primary Schools
B P
2003
W1 E-maturity -0.53 0.000 ***
KS2 Average Points 2002 0.14 0.510 KS2 Average Points 2003 -0.36 0.038 **
W1 E-maturity -0.58 0.000 ***
% Authorised Absences 2002 -0.02 0.908 % Authorised Absences 2003 -0.30 0.078 *
2004
2005
W1 E-maturity -0.56 0.000 ***
% Authorised Absences 2002 -0.05 0.748 % Authorised Absences 2005 -0.49 0.054 *
Base 120
Note: Results after controlling for school characteristics. Separate regressions run for each indicator. *** statistically significant at 1% level ** statistically significant at 5% level * statistically significant at 10% level
For secondary schools, the findings are similarly inconclusive. The analyses established statistically significant associations between E-maturity change up to 2003 and the percentage of authorised absences. However, the association with absence rates in 2003 is positive, whereas previous analysis of changes in E-maturity and performance indicators over the longer period up to 2005 suggested the association was negative. In addition, the percentage of pupils achieving grades A* to G at Key Stage 4 in 2003 emerges as statistically significantly associated with E-maturity change. This is the only occasion that this indicator was found to be associated with E-maturity.
Table 4.9 Association between Performance Indicator in Various Years and Change in E-maturity between 2002 and 2003 - Multivariate Regression Results for Secondary Schools
B P
2003
W1 E-maturity -0.21 0.025**
% A* - G KS4 2002 0.09 0.101
% A* - G KS4 2003 -0.13 0.029 **
W1 E-maturity -0.25 0.006 ***
% Authorised Absences 2002 -0.28 0.070 * % Authorised Absences 2003 0.31 0.075 *
2004
W1 E-maturity -0.23 0.010 **
KS3 Points 2002 -0.11 0.369
KS3 Points 2004 0.16 0.010 **
W1 E-maturity -0.24 0.008 ***
KS3-KS4 Value Added 2002 -0.11 0.253 KS3-KS4 Value Added 2004 0.03 0.068 *
2005
Base 119
5 SUMMARY AND CONCLUSIONS
This study analysed data from three waves of the evaluation of the Department for Education and Skills’ Curriculum Online (COL) initiative to measure and record the levels and intensity of use of ICT in primary and secondary school. The extent to which schools use ICT is referred to as E-maturity. An E-maturity index was constructed on the basis of responses by schools and school teachers to COL evaluation questions about the presence and quality of ICT resources in schools and their use inside and outside classrooms, and for preparing lessons. For each school an E-maturity score was calculated based on these responses. Change in these scores between 2002 and 2005 were studied and associations with school performance indicators analysed.
5.1 E-maturity and E-maturity Change between 2002 and 2005
The analysis determined that levels of e-maturity in schools had increased significantly between 2002 and 2005. The largest changes were seen in primary schools, which, despite lagging behind secondary schools in 2002, by 2005 had effectively achieved levels of e-maturity equal to those of secondary schools (24.8 and 24.9 points respectively). Schools with high levels of e-maturity overall outperformed schools with lower scores on all three dimensions that made up the e-maturity index: infrastructure and resources, organisational co-ordination, and engaging the learner. In primary schools, e-maturity in 2005 was positively associated with the school’s previous score on the infrastructure dimension in 2002. In secondary schools, e-maturity in 2005 was positively associated with the school’s previous performance on infrastructure and engaging the learner.
Schools’ organisational features and their workforce's attitudes towards ICT at the start of the observation period appeared not to influence their overall e-maturity rating in 2005. Improvements in e-maturity, therefore, were above all associated with resource upgrades and more intensive use of resources in the classroom, rather than by the teachers' and the schools' own (ability to) use and management of these resources.
Primary schools, on average, achieved higher e-maturity scores than secondary schools on the organisational co-ordination dimension of the e-maturity index, whereas secondary schools tended to be better equipped in terms of their ICT infrastructure. These were also the dimensions on which each school type improved most strongly in the three years to 2005. There was no statistically significant difference between primary and secondary schools' scores on the 'engaging the learner' dimension.
In both primary and secondary schools, changes in E-maturity were associated with specific school characteristics. E-maturity scores for 2005 increased in primary schools with the size of the school and the proportion of students with special educational needs, as well as the E-maturity baseline score in 2002. In secondary schools, the baseline score for 2002 also drove E-maturity scores in 2005. In addition, a major positive influence on a secondary school’s E-maturity score in 2005 was their status as a specialist school: specialist science and technology secondary schools were most likely to achieve high E-maturity scores.