National challenge schools: Statistics
Standard Note: SN/SG/5062 Last updated: 21 June 2010
Author: Paul Bolton
Section Social & General Statistics
The aim of the National Challenge is that by 2011 all secondary schools in England should have at least 30% of their pupils achieve 5 or more GCSE or equivalent passes at grades A*-C including English and Maths GCSE. National Challenge schools –those not currently meeting this threshold- have received additional funding, but also have the threat of closure or merger hanging over them. The number of schools not meeting the threshold has declined substantially over the past five years. Some of this has been due to closures. Results for individual schools can vary greatly year-on-year, but in general many more schools have improved to above 30% than fallen below.
Compared to the other secondaries these schools have a more deprived intake and well above average levels of special educational needs. When such factors are taken into account, only a minority of these schools perform significantly below average. Around one-in-five were rated as good or outstanding in their latest Ofsted report.
This note looks at some basic statistics on the number of schools who do not meet this threshold, including trends, types of school and variations across the country. It then looks in more detail at performance and pupil intake at schools below this target in 2008.
A linked Excel file lists the 247 schools currently below the threshold and includes some basic information including LEA, constituency, school type, exam performance and links to additional specific information about each school.
Background to the National Challenge is given on the Department of Children Schools and Families website and in the Library standard note Schools causing concern. Readers may also find the following notes useful:
Variations in GCSE performance 2006/07 Variations in GCSE performance 2007/08 Variations in GCSE performance 2008/09 Trends in GCSE attainment gaps
Academies: Statistics
This information is provided to Members of Parliament in support of their parliamentary duties and is not intended to address the specific circumstances of any particular individual. It should not be relied upon as being up to date; the law or policies may have changed since it was last updated; and it should not be relied upon as legal or professional advice or as a substitute for it. A suitably qualified professional should be consulted if specific advice or information is required.
Contents
1 Background 2
1.1 Definitions 2
2 Schools not meeting the 30% threshold 3
2.1 Trends 3
2.2 Regional and local variations 3
2.3 School type 4
3 Performance measures 5
3.1 Distribution of results 5
3.2 Pupil intake 6
3.3 CVA 6
3.4 Ofsted inspections 8
4 List of schools not meeting the 30% threshold in 2008. 9
1 Background
The National Challenge was established in summer 2008 with the initial aim of ensuring that all mainstream state schools in England met the 30% threshold by 2012. This has subsequently been moved forward to 2011. A total of £400 million of funding has been made available over the period to 2011 to support schools which are currently below the 30% threshold or at risk of falling below it.1
1.1 Definitions
The measure used for the National Challenge target, five or more GCSE or equivalent passes at grades A*-C including English and Maths GCSE (level 2 including English and Maths), was introduced into the school performance tables in 2006. This measure added the additional Maths and English ‘hurdles’ alongside the earlier headline measure (five or more GCSEs or equivalent at A*-C, or level 2). It means that pupils have to pass at least two or more GCSEs to meet it as equivalent qualifications do not count towards the Maths and English part. Pupil attainment is measured at the end of Key Stage 4 (year 11) and includes any qualifications gained in earlier years. Pupils are included in a school’s results whether they took any examinations or not. Two exceptions are newly arrived pupils from overseas with little or no English and pupils who were permanently excluded from other schools in the past two years.2
The National Challenge target covers mainstream schools only. The 2009 performance tables included results for schools which had subsequently closed. There were 54 such schools.
1
www.dcsf.gov.uk/nationalchallenge/
2
2
Schools not meeting the 30% threshold
2.1 Trends
In 2008/09 247 schools did not meet the 30% threshold (excluding schools that closed between the end of 2008/09 and the publication of the performance tables). Recent trends in their number are illustrated in the table below.
Schools not meeting the National Challenge threshold
2004/05 2005/06 2006/07 2007/08 2008/09
Number 909 781 631 439 247
% of secondary
schools 29.4% 25.5% 20.7% 14.5% 8.3%
Source: GCSE and Equivalent Results in England, 2008/09 (Revised), DCSF
Between 2004/05 and 2008/09 the number and percentage of schools not meeting the threshold fell by almost three-quarters. Over the same period the percentage of all pupils in maintained schools in England who achieved level 2 including English and Maths increased from 42.5% to 50.7%.3 Although not published at the time it has been estimated that around
50% of schools did not meet the threshold in 1997.4
Between 2007/08 and 2008/09 the number of schools which did not meet the 30% threshold fell by 191. However, this only tells us part of the story. Of the 440 schools originally below the threshold5 in 2007/08:6
215 (49%) were also below the 30% threshold in 2008/09 222 (50%) were above the 30% threshold in 2008/09 3 (1%) closed during the academic year
In total 69 (16%) of these schools have now closed,7 this includes 15 that improved their results to above the 30% threshold in 2008/09
22 schools which were above the 30% threshold in 2007/08 saw their results decline to below it in 2008/09, compared to 83 the previous years. A further 21 new schools had results published in the performance tables for the first time which were below the threshold. All but two were academies.
There has been considerable turnover in ‘National Challenge schools’ which is not picked up in net change figures. The number of schools in this category has fallen in part due to closures. Four of the 247 schools in 2008/09 have subsequently closed and a further 39 are proposed to close (mainly to be re-opened as academies).8
Although the number improving beyond the threshold was larger than the number moving the other way, the relatively large numbers involved illustrates the fact that trends at a school level can be erratic.
2.2 Regional and local variations
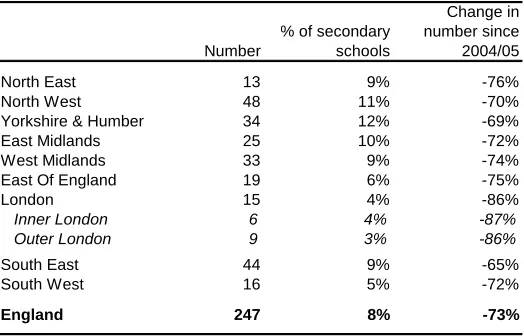
Regional variations are illustrated in the table below. London had the smallest proportion of schools below the 30% threshold and has seen the largest percentage fall since 2004/05. Yorkshire and the Humber and the North West had the highest proportion of schools falling below the threshold; around one in nine or double the rate in London. The patterns in the
3
GCSE and Equivalent Results in England, 2008/09 (Revised), DCSF
4
DCSF press release 14 January 2009, Number of National Challenge schools down
5
The number has subsequently been revised to 439
6
DCSF performance data; EduBase, DCSF
7
Includes amalgamations and schools that have re-opened as academies.
8
table below bear some relation to the overall proportion of pupils reaching this standard in each region. There are exceptions, for instance overall pupil performance in the West Midlands was better than that in inner London, but the percentage of schools below the threshold was lower in inner London. Such results arise due to differences in the distribution
of results at a schools level.
Schools not meeting the National Challenge threshold, by region, 2008/09
Number
% of secondary schools
Change in number since 2004/05
North East 13 9% -76%
North West 48 11% -70%
Yorkshire & Humber 34 12% -69%
East Midlands 25 10% -72%
West Midlands 33 9% -74%
East Of England 19 6% -75%
London 15 4% -86%
Inner London 6 4% -87%
Outer London 9 3% -86%
South East 44 9% -65%
South West 16 5% -72%
England 247 8% -73%
Source: GCSE and Equivalent Results in England, 2008/09 (Revised), DCSF
There were greater variations at a local authority level. More than one in four secondary schools were below the threshold in Middlesbrough, Knowsley, Hull, Bristol and Brighton. in. 542 local authorities (35%) had no schools below the 30% threshold.9
Overall 7.4% of pupils of compulsory school age in mainstream secondaries were in schools below the 30% threshold in 2009. Hull had the highest rate at 37%.10 It should be noted that these figures
are based on pupils at schools in a particular local authority, not pupils who live in that area.
2.3 School type
The table on the next page summarises various school category types for 2009 and compares these to a breakdown of school types across all schools (final column).
9
GCSE and Equivalent Results in England, 2008/09 (Revised), DCSF
10
'National Challenge schools' 2008/09 summary of school type
Number
% of National Challenge schools
% of mainstream state schools included in performance tables
Status
Community 194 64% 53%
Voluntary Controlled 1 0% 3%
Voluntary Aided 19 6% 17%
Foundation 46 15% 24%
Academy 41 14% 4%
City Technology College 0 0% 0%
Gender
Mixed 289 96% 87%
Boys 10 3% 6%
Girls 2 1% 7%
Selection
Modern 34 11% 5%
Comprehensive 265 88% 89%
Grammar 0 0% 5%
Faith
Non-denominational 265 88% 83%
Faith school 47 11% 17%
Source: DCSF performance data; Edubase, DCSF
This shows that, compared to all schools, those below the 30% threshold were more likely to be community schools, academies or modern schools. They were less likely to be single-sex, faith, grammar, foundation or voluntary aided schools. It should be noted that this analysis is based on all 301 schools below the threshold in 2008/09 including those that have since closed.
3 Performance
measures
3.1 Distribution of results
All 301 schools in this category are grouped together in terms of their threshold performance. However, there were large variations in performance as illustrated in the chart below. More than half of these schools were in the 25-29% range and there were an even larger number just above the 30% threshold (results are rounded to the nearest percentage point in the performance tables).
Below the threshold 'Near misses'
0 10 20 30 40 50 60
0% 2% 4% 6% 8% 10% 12% 14% 16% 18% 20% 22% 24% 26% 28% 30% 32% 34% Distribution of schools below the 30% threshold
The next chart puts the schools below the threshold in the context of the entire distribution.
0.0% 0.5% 1.0% 1.5% 2.0% 2.5% 3.0%
0% 5% 10% 15% 20% 25% 30% 35% 40% 45% 50% 55% 60% 65% 70% 75% 80% 85% 90% 95% 100% Proportion
of schools
Percentage of pupils achieving level 2 including English and Maths performance
Distribution of schools by pupil performance on level 2 including English and Maths, 2008/09
The main difference with the 20007/08 results, other than the smaller number below the threshold, is the shift rightwards in the ‘local’ peak from the low 30 per cents to the high 30s. There are fewer schools just above the threshold.
When looking at schools on either side of the threshold it is important to realise that a school’s results in any one year can vary for many reasons, some of which are beyond their control such as pure chance. While a school may be on a long-term upward path, we would not expect an even percentage increase in its performance each and every year. Some increases will be larger than average, its improvement may stall or results may fall for a single year. These random variations will have a greater impact for smaller schools.
3.2 Pupil intake
The pupil intake at schools below the 30% threshold is not typical of the country as a whole. For instance rates of Special Educational Need (SEN)11
among pupils were 35% compared to 20% across all state funded secondaries. The proportion of pupils eligible for free school meals at these schools was 28%, double the national rate in secondary schools of 13%.12
While overall the academic performance of pupils in these categories is well below average, the relationship between pupil intake (on any measure) and school performance is not straightforward. There are numerous examples of schools with a similar pupil intake to those below the threshold where pupils perform much better. Similarly, some schools below the threshold have below average rates of SEN and/or free school meals.
The Contextual Value Added (CVA) measure has been developed to take differing pupil intake into account and provide a more meaningful comparison between schools. Results are presented in the next section
3.3 CVA
CVA measures were first published for all English state funded secondary schools in the 2006 performance tables. They follow on from earlier 'simple' value added measures. CVA is based on a pupil’s score in their best eight results at GCSE/equivalent compared to results at Key Stage 2. This is adjusted for such factors as gender, special educational needs,
11
Statemented and unstatemented.
12
movement between schools and various socio-economic factors -all of which are known to affect pupil performance. The result at a pupil level is a comparison of progress with similar pupils nationally. At a school level the average CVA score is intended to make comparisons between schools more meaningful, even those with very different pupil intakes or local factors.
CVA scores are given at school level and presented as a number based around 1,000. A score of 1,000 is the expected level of progress nationally. If a school's CVA score is above 1,000 its pupil make more progress than similar pupils nationally and vice versa. Although the scores have no direct meaning, an increase of six implies an average improvement of one GCSE grade higher in a single subject per pupil across the school. An improvement of 48 implies average results are one GCSE grade higher in each of the eight subjects that count to the CVA.
It has often been pointed out that some schools which fall below the 30% threshold actually perform above average on their CVA score. The Labour Government responded by stating:13
Our first and most urgent commitment is to raise standards in schools with low attainment. This is vital if we are to meet our twin goals of raising standards across the school system; and to narrow attainment gaps, improve the life chances of children from deprived backgrounds and help to eradicate child poverty. We recognise that some of these schools have good rates of progression and high contextual value added (CVA), but are clear that young people need more than this – achieving good qualifications, including English and mathematics, is central to improving their life chances and their prospects of progressing to further study and a successful career.
[…]
The majority of secondary schools where more than half of pupils are eligible for free school meals are in the National Challenge. Improving these schools offers their children a route out of poverty. We know that schools serving deprived communities have a difficult job to do and that many of their children face complex challenges. To do well at school, these children need first class teaching alongside coordinated support for their social and emotional development and support to help them stay safe and be healthy.
We therefore reject any suggestion that we should have lower expectations of children from deprived communities, or the schools that serve them. There are already many examples of individual pupils and schools succeeding in challenging circumstances, as a result of excellent teachers, outstanding leadership, and effective support to meet additional needs.
13
The charts opposite compare the distribution of schools below the 30% threshold with all state funded secondaries that had a CVA score in 2009. This shows that overall the distribution of schools below the threshold was appreciably further to the left hand side –a greater proportion of schools had lower CVA scores and vice versa. It also shows that a large minority of schools below the threshold had above average (1000) CVA scores and many had higher CVA scores than those above the threshold. CVA scores for individual schools also include confidence intervals. At an individual school level the relatively small number of pupils means that test results (and hence CVA scores) can vary appreciably due to chance, rather than the
school’s effectiveness. This effect will be larger for schools with smaller numbers of pupils. The range of the confidence interval indicates where the school’s ‘true’ CVA score lies.14
Among the 301 schools below the 30% threshold in 2008/09: 41% had a CVA score not significantly different from the national average (pupil progress was broadly in line with similar pupils nationally), 38% were significantly below (we can be reasonably certain that pupils progressed at a slower rate than similar pupils nationally) and 22% significantly above.15
<955 955 970 985 1000 1015 1030 1045 1060 1060+ 0% 5% 10% 15% 20% 25% 30%
Schools below the 30% threshold
<955 955 970 985 1000 1015 1030 1045 1060 1060+ 0% 5% 10% 15% 20% 25%
30% All state
funded schools
Distribution of CVS Results -proportion of schools in each band
3.4 Ofsted inspections
Ofsted bases its inspection judgements on a range of evidence including the school’s self evaluation plan, views of pupils and parents, what the inspectors see in the classroom and detailed performance data. Schools are graded as either outstanding, good, satisfactory or inadequate. There are two categories of schools ‘causing concern’. Schools are placed in
special measures when pupils are not receiving an acceptable standard of education and the
school’s management does not demonstrate the capacity to improve the situation. Schools are given a notice to improve when their performance is significantly below expected levels or where pupils are not receiving an acceptable standard of education, but the school’s management demonstrates the capacity to improve the school.16
At the end of March 2010, 22 schools below the threshold were subject to special measures. This was just over one third of all state funded secondaries in special measures at the time. Overall 9% of schools below the threshold were in special measures; nearly six times the rate in other state funded secondaries (1.5%). 13 of the 63 secondaries in the Notice to Improve category (21%) were below the 30% threshold. 5.3% of schools below the threshold had been given a notice to improve compared to 1.6% of other state secondaries. Thus
14
More background on confidence intervals can be found in the statistical literacy guide Confidence intervals and statistical significance.
15
DCSF performance data.
16
overall 35 out of the 244 open schools below the 30% threshold were in one of the categories of concern.17
278 of the 301 (open and closed) schools below the 30% threshold have been inspected by. Among these, three received an outstanding rating, 55 good, 180 satisfactory and 40 inadequate.18
4
List of schools not meeting the 30% threshold in 2008.
The attached Excel file contains a table (partially illustrated below) which lists all 440 schools and gives the following information:
• Local authority
• Parliamentary constituency • School type
• Proportion of pupils reaching level 2 including English and Maths in 2007, 2008 and 2009
• CVA scores in 2009
• Trends in the headline level 2 measure since 1995 • Links to further information about each school
The final two categories are illustrated in the screenshot of the Excel file opposite. The performance data is given as a trend line for each school along with the 1995 and 2009 values for schools that had been open during the whole period. Many schools were not, so only a partial trend is given (see opposite). Those new schools which were included in the performance tables for the first time in 2009 have no trend line only their 2009 figure.
Three links are given. The first is for the individual school’s EduBase profile. This is a database maintained by the DCSF which gives background detail about the school. The second link is for its school profile page. This includes an overview, a profile of the school which is normally written by the head teacher and links to performance data. The third is a link to the latest Ofsted report (where inspections have been carried out).
17
Data on schools causing concern, spring term 2010, Ofsted
18