***
* *
*
* *
*
***
Theme 6 External trade
Series 8
Short-term statistics
ISSN 1022-6524
~
eurostat
Newsletter
;r*.:.'il
EDICOM
INTIIASTATbll
1 D 1997
EDll'ORIAL
On
15April Eurostat published the
1996annual results of the external
and the intra-Community trade statistics of the European Union. There
are considerable improvements in the availability of data. Although not
completely satisfactory, the situation has,for the first time since Intrastat
was launched, returned to something like it was be/
ore the completion of
the Internal Market.
It is clear from the analysis of the results on intra-Community trade,
particularly the study of the mirror statistics which show a persistent and
unexplained discrepancy of approximately 5% between intra-Community
total dispatches and total arrivals, that the reliability and quality of the
data leave much to be desired. Eurostat and the national administrations
must give the highest priority to finding solutions to this problem, which
is crucial to the future of the system.
The
1996Intrastat Newsletter presented the various measures - the SLIM
initiative, EurostatMember States Restricted Group, and other studies
-which had been undertaken by the Commission and the Member States to
improve the operation of the Intrastat system.
The Internal Market Council of
26November
1996unanimously approved
the SLIM-lntrastat recommendations and asked the Commission to put
forward as soon as possible specific proposals for implementing them.
The Edicom Decision adopted by the Council in December
1996made it
possible to .continue and speed up the measures to modernise and automate
the systems for collecting and processing lntrastat returns.
The large number of parties involved, whether as users or as producers, in
the lntrastat process, the differing opinions on the usefulness of particular
measures (e.g. the simplification of the nomenclature) and the need to be
-' open to as wide a range of views as possible mean that this is a difficult
C')and ambitious task and a major challenge. Rapid progress is essential if
Rf ..
In this issue
INTRASTAT
• Slower growth in intra-EU trade
in 1996 ... p 3
• Data availability ... p 13 • Improvement of the statistics relating to
the exchange goods:The progress of the work ... pl4
• Simplification in statistics
- The Jntrastat case -... p 17
• Summary of the legislation on statistics
on trade between member states ... p 24
• Slim legislation adopted and the
pipe-line ... p 25
• Progress of work on the Combined
Nomenclature ... p25
EDICOM-COMEXT
11 COMEXI'CD-ROM new version 1.3 ... p26 • COMEXI'in view of the users ... p29 • Telecommunications for the INTRASTAT
data collection system ... p 30
11 Conformity label for software
which can be used to compile
Intrastat declarations ... p 33
• Automated Data Handling Operations
in the field of Intra-Community
Trade Statistics ... p 34
• Subscription. ... p 38
w
we are to consolidate the present system and meet today's demands for high-quality, pertinent statistics. At the same time, there
0
must be increased consideration of, and further studies on, systems other than lntrastat in order to find the best and most
~
economical way of coping with the ever-increasing need for statistical in/ ormation in the context of Economic and Monetary
Union.
~
eurostat
STATISTICAL OFFICE OF THE EUROPEAN COMMUNITIES L-2920 Luxembourg -Tel. 4301-1 -Telex COMEUR LU 3423 B-1049 Bruxelles, rue de la Loi 200-Tel. 299 11 11
© European Communities, 1997
Reproduction is authorized, except for commercial purposes, provided the source is acknowledged.
I
=Vil
eurostat
page
3
SLOWER
GROWTH
IN INTRA-EU TRADE IN f 996
B
ased on the figures that are initiallyavailable, intra-Community trade in-creased at a much slower pace in 1996 than in the previous two years. The dis-patches reported by the Member States amounted to ECU 1 049 billion last year, up by only 3 .3% over the previous year in comparison with increases of 13% in 1995 and 12.8%in 1994.
The trade figures for Germany, France,
the BLEU and the Netherlands, which
together account for more than half of intra-Community trade, were down by more than 8 points for both dispatches
and arrivals. Denmark, Austria,
Swe-den and Finland also experienced sharp
drops in growth, although in the case of the new Member States the figures have to be put into context because of the changes i1;1 methodology as a result of accession.
Dispatches from the United Kingdom,
Spain, Portugal and Italy continued at a
healthy rate. In the case of the United Kingdom, dispatches were up by almost the same rate as the previous year: +9% in 1996 compared with +9.4% in 1995. Dispatches from Spain ( + 10%) and Italy (+6.7%) slowed by only 4 points, while for Portugal (+7.6%)theywere down by 8 points.
Countries showing the biggest rise in arrivals included the United Kingdom
(+9.8%), Spain (+6.8%) and Portugal
( + 10.4%). The figures for Ireland ( + 11.3%) and Finland ( +9. % ) were also well above the Community average (+2.4%).
Although the breakdown by product is incomplete because of a lack of data from some Member States, it is already clear
that in 1996 manufactured goods, which accounted for roughly 80% of trade in terms of value in 1995, lost the momen-tum behind trade growth in the last two years. In the case of food products, the main dispatches show no change, while trade in raw materials is generally de-creasing. Trade in energy products is running counter to the sharp increases of more than 25% in connection with the rise in oil prices at the start of the year.
Annual growth rate of intra-EU dispatches
15% - - , , , - - - .
10% +
5 % +
-0%
-5%
1995
[3!n
eurostat1993 1994
···-·--····-···-·--·-·-..
··---··--·--··---·-·---·
1996I =V!1
eurostatpage 4
BELGIUM
AND
LUXEMBOURG
I
n 1996 the Belgo-Luxem-bourg Economic Union recorded a trade surplus ofECU 12.9 bil-lion, matching the figure for the previous year. The growth in intra-Community trade ( + 3 .2% for dispatches and + 3. 7% for arrivals) was much less vigorous than the year before, due to a decline in trade with the three main partners ( Germany, France and the Netherlands), who ac-counted for close on 70% of the BLEU's intra-Community trade in 1996. In par-ticular, dispatches to Germany were down by 1.1 % and arrivals by 3 .1 %.The drop in the figures for Belgium-Lux-embourg stems from reduced trade in other manufactured goods (SITC 6 and 8) and to a lesser extent in raw materials and food products. On the other hand, trade in machinery and transport equip-ment maintained its moequip-mentum ( +9. 7% for dispatches and+ 13 .4% for arrivals).
DENMARK
•
Denmark
saw its trade surplus improve from ECU 1.2 billion in 1995 to 1.9 billion in 1996. Dispatches ( + 3 .1 % ) performed bet-ter than arrivals (unchanged at 0.4%), due in part to dispatches to Sweden ( + 10.5%) and the United Kingdom(+ 14%). Trade with Germany, which accounts for more than 30% of Denmark's trade, was down for both dispatches (-2.6%) and arrivals (-52%).The improved trade surplus was helped by an ECU 1.8 billion cut in the structural deficit in manufactured goods. The sur-plus on food products was stable at ECU 3. 7 billion.
GERMANY
@
T o offset the effect of non-response and threshold levels in returns, Germany re-adjusts its figures for intra-Community trade once a year. In 1995 these adjust-ments amounted to ECU 10 .4 billion (4.7%) for dispatches and ECU 18.5 bil-lion (9.3%) for arrivals. The adjusted fig-ures are not yet available for 1996, which means that it is very likely that there will be significant changes to the data shown below.According to the provisional data re-ceived by Eurostat, German trade in 1996 was below the levels of previous years, after dispatches had been up in 1995 by 11.8% (-2% in 1996) and arrivals by 14.2% (-4.7% in 1996). Germany's trade figures were down with France (-6.2% for dis-patches and-4.5% for arrivals), Belgium-Luxembourg (-4% and -5 .5% ), Italy (-1.2% and -5.9%) and the Netherlands (-1.7% and -1.8%). Dispatches rose only to Spain, Portugal, Finland and Austria. Similarly, arrivals increased only from the United Kingdom, Spain and Portugal.
There was a structural surplus of about ECU 21.2 billion in the German trade bal-ance in 1996, thanks to a surplus ofECU 44.9 billion generated by manufactured goods. These products account for
about 80% of the country's intra-EU trade. Trade in other products shows a deficit, especially in the case of food ucts (ECU -9.7 billion) and energy prod-ucts (ECU -7.8 billion).
Germany's extra-EU trade was also slow-ing down in 1996, with exports risslow-ing by 5 .5% ( compared with 10. 7% in 1995) and imports by2.4% (7.3% in 1995).
GREECE
· ~
'A
~::s~!;!~:te:~;
Greece's intra-Community trade in 1996, dispatches were down by 8.2% and
ar-rivals by 3.8% as a result of a drop in trade with its two main partners, Germany and Italy. Greece's trade deficit never-theless remained stable at ECU 8.7 bil-lion.
SPAIN
· · " '
0
"Th
r
d- e pattern o tra e between Spain and the other Member States in 1996 was
Most Member States (all except Greece, Spain, France, Italy,
Portugal and Finland) adjust the totals of intra-EU trade
bro-ken down
by partner country in order to allow for non-response
and the threshold
effect These estimates cannot be allocated
at the most detailed level of breakdown in the product
classifi-cations.
again - as in 1995 - among the most
vig-orous in the EU. Dispatches increased by 10%, which with the smaller increase in arrivals (6.8%) meant that the coun-try's deficit fell to ECU 6.9 billion ( com-pared with ECU 8 billion in 1995).
The continuing growth in trade with France ( + 11. 7% for dispatches and + 12.8% for arrivals), which is Spain's fore-most trading partner, and the strong up-turn in dispatches to countries such as the United Kingdom ( + 19. 7%) and Por-tugal(+ 12.3%) offset the slowdown in
~
80
70
60
55 50 50
40
...l
z
~ tt:
[3!ZI
eurostat
80
70
55
61
60 59
55 50
40
~ 0
0
trade with other countries, especially
qermany and Benelux.
In 1996 the growth in trade depended primarily on the machinery and transport equipment sector(+ 14% for dispatches and+ 16% for arrivals). The reduction in Spain's trade deficit comes from the in-crease in its surplus on trade in food prod-ucts (ECU + 1.2 b~llion between 1995 and 1996) and, to a lesser extent, from the smaller deficits for raw materials and other manufactured goods ( each down by ECU 0.4 billion).
I =Vil
eurostat
page
5FRANCE
F
ranee's intra-Com-munity trade grew at a rate below the Community average in 1996. Dispatches were up by 2.0% and arrivals by 1.5%. The trade deficit came to ECU 5. 7 billion, slightly down on the 1995 figure of6.4 billion.SHARE IN % OF INTRA-EU TRADE IN THE TOTAL TRADE
OF THE MEMBER STATES IN 1996 80 81 77
Dis9atches
71
66 67 67 62 63
56
0 Cl) ~ i:i. ~ < ~ ~ ...l ...l Q.,
:2
0 i::i:: 0
e:
co
::J
~
SHARE IN % OF INTRA-EU TRADE IN THE TOTAL TRADE OF THE MEMBER STATES IN 1996
Arrivals 75 76 73
70 68 68 68 65 66
63 64 61
~
IJ'l~ ~ ...l i:i. ~ Cl) ~ ~ < Q.,
-
~ 0i::i:: i:i. i:c ::J
I
§l<l
eurostat
page 6
The slowdown in French trade was miti-gated by growth in trade with Spain and the United Kingdom. The drop in dis-patches to Germany (-0.9%) and Italy (-2.6%) was thus partly offset by better export performances to Spain (9.9%) and the United Kingdom (3.2%). Similarly, the fall in arrivals from France's two main partners, Germany (-3.1 %) and Belgium-Luxembourg (-0.6%) was offset by in-creased imports from Spain (+8.3%) and the United Kingdom ( + 7 .2% ).
Dispatches of raw materials excluding energy ( -10%) and other manufactured goods (SITC 6 and 8) fell between 1995 and 1996. The food-surplus went down by ECU 0.3 billion as a result of a drop in dispatches (-0.8%). This cut in the food surplus was more than offset by the smaller deficit ( down by ECU 1.8 billion) affecting manufactured goods (SITC 5-8). Lastly, the sharp rise in the value of imported energy products ( + 22.4%) was a factor in the worsening trade balance in this sector (by ECU 0.8 billion).
Gennany
France Netherlands United Kingdom
Italy
B.LE.U. Spain Sweden Austria Ireland Denmark Finland Portugal Greece
0% 5%
IRELAND
ij
T o allow for the effectof the thresholds and non-response by some operators, Ireland makes adjustments to its figures for in-tra-Community trade. Last year, these amounted to 18% of the total. The ad-justed figures show that arrivals ( + 11.3 % ) were growing much faster than dis-patches ( +5 .3% ). This did not have any significant effect on Ireland's trade sur-plus, which in 1996 was ECU 8.8 billion (compared with 9.2 billion in 1995).
JO%
Ireland is one of the Member States whose external trade is most geared to the European Union, which in 1996 ac-counted for 70% of the country's exports and 66% ofits imports. The United King-dom is the main partner, far ahead of Ger-many, and took 34.2% oflrish dispatches and provided 62.5% ofits arrivals.
15% 20% 25%
ITALY
~
Although the paceslackened in com-parison with 1995, Italy m~intained a healthy growth in its dispatches in 1996 (+6.7%). The more marked slowdown affecting arrivals ( +3 .6% in 1996) pushed the country's trade surplus up by ECU 3.5 billion to a figure ofECU 10 billion.
Germany remained Italy's primary part-ner, accounting for about a third of the country's intra-Community trade. The growth in Italian dispatches stemmed mainly from exports to the United King-dom (+14.9%), France (5.9%) and Spain (+ 11.4%). The lower growth rate for ar-rivals was mainly the result of a drop in arrivals from Gennany(-0.4%) and France (+0.4%), which together accounted for 52.5% of the total in 1996.
30%
The rise in the trade surplus is primarily due to manufac-tured goods (ECU +3.2 billion), while the structural defi-cits recorded for food products (ECU -4.9 billion) and chemical products (ECU -6.9 billion) showed little or no change in 1996. The sectors in which dispatches increased the most in 1996 were ma-chinery and trans-port equipment (+ 10%), chemical products ( +9. 7%) and food ( + 7 .5% ).
Austria, Finland and Sweden have been using the Community
methodology only since they joined the European Union in 1995.
Because of this change in methods, any comparison of growth
rates for 1995 and 1996 is relatively meaningless.
1995. Thanks to a more modest rise in imports (
+
3 .6% ), Italy achieved a record surplus ofECU 24.7 billion, in addition to its intra-EU surplus.NETHERLANDS
.if
T~:r
~::::::i
0~::,::~
tions on intra-Community trade is par-ticularly high in the Netherlands. The
adjustments to the figures for 1996
amounted to 12% of dispatches and 17% of arrivals.
[3!il
eurostat
for Dutch dispatches in 1996. These two partners also account for more than 50% of Dutch arrivals.
The adjustments concerning intra-Com-munity trade are not redistributed by product, which means that the available figures for sectoral trends have to be viewed with caution. However, accord-ing to these data, the rise in the trade surplus apparently stems primarily from
an increase ofECU 2.6 billion in the sur-plus for energy products. In 1996, be-cause of the rise in oil prices, dispatches of energy products were up by 32.5%. The trade surplus on food rose slightly (ECU +0.4 billion), while the surplus on
manufactured goods fell by ECU 0.8
bil-lion.
I =V!1
eurostatpage
7AUSTRIA
A
ccording to the estimates of intra-Com-munity trade compiled by Austria, growth in dispatches was down to 1.3% in 1996, with the corresponding figure for arrivals down to 3.5%. This pushed the country's deficit up from ECU 9.4 billion in 1995 to 10.4 billion in 1996. These figures mainly reflected the slowdown in trade with Germany, which accounts for more than 60% of Austria's intra-Community trade, to-gether with only a slight increase in trade with Italy.
On the other hand, Austria has a sur-plus in trade with non-member countries. With exports up by 15.0% and imports by 13 .1 %, this surplus amounted to ECU 1.9 billion in 1996.
According to the adjusted figures, the country's trade surplus amounted to ECU 37.3 billion last year. This was an improvement of 2.6 billion, since the reduced growth rate for dispatches (+4.1%) was less than that for arriv-als (+2.8%). This
surplus should
however be ana-lysed in conjunc-tion with the coun-try's deficit in rela-tion to extra-Com-munity trade and its role as a transit country in Euro-pean trade.
SHARE OF EACH MEMBER STATE IN THE EU ARRIVALS
Germany (35.6%) and the BLEU (17.5%) were the main destinations
Gcm1any France United Kingdom Italy B.L.E.U. Netherlands Spain Austria Sweden
Pnnugal Ireland Finland Greece
0% 5% 10% 15% 20%
01986 •1996
I =Vd
eurostat
page
8PORTUGAL
~he other Member States
.l
account for much of Por-tugal's external trade, taking 80% of the country's exports and providing 76% of its imports. The figures for intra-Com-munity trade continued to show healthy increases in 1996, with dispatches up by 7 .6% and arrivals by 10 .4%. The net re-sult was that Portugal's trade deficit worsened by ECU 0.8 billion in 1996, to end up at 5 .3 billion.The main destinations for Portugal's dis-patches were Germany (+6.0%), Spain (+4.2%) and France (+8.9%). Dispatches to Belgium-Luxembourg (+46.8%) pro-vided the greatest extra growth (ECU 0.3 billion), although the BLEU accounted for only 5.2% of Portugal's dispatches.
The strong increase in arrivals was pri-marily the result of Portugal's flourish-ing trade with its two main partners, Spain ( + 16.6%) and Germany ( + 16.1 % ), as well as with the United Kingdom (+9.6%).
The growth in intra-Community trade in 1996 was led by the increased trade in machinery and transport equipment, af-fecting both dispatches (+30.4%) and arrivals ( + 20% ). Growth in dispatches trailed growth in arrivals in other sec-tors, with the result that there was a wors-ening of the trade balance.
FINLAND
A
fter 1995, when Finland experienced a boom in trade with the other Member States, in-tra-Community trade slowed cons'ider-ably in 1996, with dispatches down in value terms (-0.9%) and a slower rate of growth for arrivals ( +9 .6% compared with + 36.3% in 1995). The difference betweenthe two flows produced Finland's low-est intra-Community trade surplus in the last five years. The 1996 figure was ECU 1.6 billion ( compared with 3 .1 billion in 1995).
With more than 60% of the total, Ger-many, Sweden and the United Kingdsom are Finland's main trading partners in the European Union. While dispatches to Gennany declined (-0.9% ), those to Swe-den and the United Kingdom rose by + 18.3% and +6.9% respectively, thereby limiting the downturn for dispatches. Although arrivals from Sweden ( + 11.8%) and the United Kingdom ( + 12.2%) had a greater impact, there were significant in-creases in purchases from France ( + 24.8%) and Denmark ( + 17% ).
The decline in Finland's surplus in 1996 was primarily due to a fall in structural surpluses for manufactured goods (ECU -1 billion)andrawmaterials(ECU-0.3 bil-lion). Arrivals in the food sector were also up by 27. 7%, which increased the existing deficit in this sector by ECU 0.2 billion.
SWEDEN
(j
I>fJ~
S
weden's intra-Community trade recorded modest growth of3. 7% for arrivals in 1996, while the stronger performance for dispatches (6.1%) pushed the country's surplus up to ECU 3 .1 billion ( compared with ECU 2.1 billion in 1995).Sweden's foremost partners in the Euro-pean Union are Germany and the United Kingdom, which in 1996 accounted for 21.4% and 16.8% respectively of Swe-den's dispatches and 28.6% and 14.8% of its arrivals. Denmark ranks third, with 11.4% for dispatches and 11.5% for ar-rivals in 1996.
Most of Sweden's surplus in 1996 stemmed from trade in raw materials ex-cluding energy (ECU 2.3 billion) and manufactured goods (SITC 5-8) for ECU
1.1 billion. The sharp increase in arrivals of food (+20.8%) and energy products (+70.9%) helped to increase the deficits in these two sectors by ECU 0.2 billion and 0.5 billion respectively.
UNITED KINGDOM
" . ~ -'.1.••:.,•:.· •. •.,_··.•.'.·.·.·::,,,_••_,•':',.:::.•: .. •.,•,.•·:'•:·:·,,_••.:,_:_:••-:._,_ •• ::,_•·.•,
rt
•. :,.'.·.,.
~~
~he United
King-.ldom's trade was
lit-tle affected in 1996 by the slackening of intra-Community trade, and its growth rate is now ahead of the Community av-erage. Dispatches were up by 9%, al-most matching the previous year's fig-ure of9 .4%. The growth in arrivals (9 .8%, compared with 6.6% in 1995) meant that the trade deficit worsened to ECU 8.2 billion ( compared with 6.6 billion in 1995). "Adjustments" amounted to 8% of dis-patches and 11 % of arrivals in 1996.
Among the main destinations for United Kingdom goods, France ( + 13 .9% ), the Netherlands ( + 11.2%) and Ireland ( + 13%) experienced a greater rise in UK dis-patches than Germany (+4.4%) and the BLEU (+5.1 %). The increase in UK ar-rivals was also spread among its EU part-ners, with the major increases affecting Germany ( + 7.2% ), France ( + 11.8% ), the Netherlands(+ 11.2%), Belgium-Luxem-bourg (+ 11.8%) and Spain(+ 19.7%).
TABLE
J:
EVOLUTION OF INTRA-EUROPEAN UNION TRADE (EVRJ
5)
EURJS
B.L.E.U.
Denmark
Germany
Greece
Spain
France
Ireland
Italy
Netherlands
Austria
Portugal
Finland
Sweden
United Kingdom
EUR15
B.L.E.U.
Denmark
Germany
Greece
Spain
France
Ireland
Italy
Netherlands
Austria
Portugal
Finland
Sweden
United Kingdom
Value in millions of ECU E: estimated data
DISPATCHES
1992 1993
Value Value 93192
833 693 797 379 -4.4% 79 917 81 804 2.4% 21243 20 963 -1.3% 210 342 189 958 -9.7% 5 212 4247 -18.5% 36 246 35498 -2.1% 125 612 113 609 -9.6% 16 814 17 909 6.5% 84 696 82 566 -2.5% 94409 93 052 -1.4% 23 323 22473 -3.6% 11 434 10 529 -7.9% 11 850 11496 -3.0% 26 882 25102 -6.6% 85 713 88 174 2.9%
ARRIVALS
1992 1993
Value Value 93/92
838 365 767 552 -8.4% 75 892 75 148 -1.0% 18 740 17 877 -4.6% 196 685 172 679 -12.2% 12 221 11 843 -3.1% 47 288 43 061 -8.9% 136 682 117 743 -13.9% 12 502 12129 -3.0% 91 675 75 317 -17.8% 71 137 69 330 -2.5% 29 349 28 742 -2.1% 17 914 15 406 -14.0% 9403 8 767 -6.8% 24 170 22 759 -5.8% 94 707 96 752 2.2%
1994
Value 94/93
899 366 12.8% 90 525 10.7% 23 004 9.7% 208 246 9.6% 4 516 6.3% 42 970 21.0% 130 142 14.6% 21 058 17.6% 92 528 12.1% 105 838 13.7% 24 563 9.3% 12 092 14.8% 14203 23.5% 30 501 21.5% 99179 12.5%
1994
Value 94193
859 940 12.0% 80 060 6.5% 20 809 16.4% 190 027 10.0% 12276 3.7% 49 611 15.2% 134 545 14.3% 14 064 16.0% 86263 14.5% 77 878 12.3% 31 781 10.6% 16 716 8.5% 10 746 22.6% 27 226 19.6% 107 940 11.6%
[3ZB
eurostat
1995 1996
Value 95194 Value 96195
1016 172 13.0% 1049 420 E 3.3%E 101 998 12.7% 105 220 3.2%
25 200 9.6% 25 974 3.1% 232 766 11.8% 228 029 -2.0% 5 080 12.5% 4664 E -8.2% E 49 065 14.2% 53 987 10.0% 145 033 11.4% 147 985 2.0% 25 043 18.9% 26 361 5.3% 102 384 10.7% 109 238 6.7% 124 167 17.3% 129 287 4.1% 29 036 18.2% 29408 1.3% 13 952 15.4% 15 018 7.6% 17 787 25.2% 17624 -0.9% 36199 18.7% 38 409 6.1% 108 461 9.4% 118 215 9.0%
[3ZB
eurostat
1995 1996
Value 95/94 Value 96195
974 269 13.3% 997 846 E 2.4%E 89 063 11.2% 92 335 3.7% 23 961 15.1% 24 047 0.4% 216 974 14.2% 206 782 -4.7% 13 879 13.1% 13 346 E -3.8% E 57 061 15.0% 60 921 6.8% 151 471 12.6% 153 713 1.5% 15 817 12.5% 17610 11.3% 95 845 11.1% 99251 3.6% 89495 14.9% 91 976 2.8% 38 439 20.9% 39 765 3.5% 18436 10.3% 20 346 10.4% 14 647 36.3% 16054 9.6% 34 085 25.2% 35 331 3.7% 115 096 6.6% 126 370 9.8%
I =Vd
eurostatpage
9 [image:9.584.66.503.73.817.2]I
=f/Jj
eurostat
page 10
TABLE
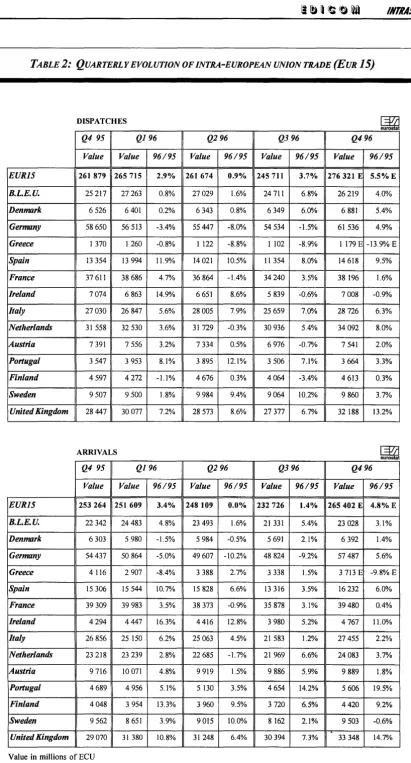
2:
QUARTERLY EVOLUTION OF INTRA-EUROPEAN UNION TRADE (EURJ
5)
DISPATCHES
Q4 95 Ql 96 Value Value 96/95 EUR15 261 879 265 715 2.9%
B.L.E.U. 25 217 27 263 0.8%
Denmo.rk 6 526 6 401 0.2%
Germany 58 650 56 513 -3.4%
Greece l 370 1260 -0.8%
Spain 13 354 13 994 11.9%
France 37 611 38 686 4.7%
Ireland 7074 6 863 14.9% Italy 27030 26 847 5.6%
Netherlands 31 558 32 530 3.6%
Austria 7 391 7 556 3.2%
Portugal 3 547 3 953 8.1%
Finland 4 597 4272 -1.1%
Sweden 9 507 9 500 1.8%
United Kingdom 28 447 30 077 7.2%
ARRIVALS
Q4 95 Value EUR15 253 264
B.L.E.U. 22 342
Denmo.rk 6 303
Germany 54437
Greece 4116
Spain 15 306
France 39 309
Ireland 4294
Italy 26 856
Netherlands 23 218
Austria 9716
Portugal 4 689
Finland 4 048
Sweden 9 562
United Kingdom 29 070 Value in millions of ECU E: estimated data
QI 96
Value 96/95
251 609 3.4% 24483 4.8% 5 980 -1.5% 50 864 -5.0% 2 907 -8.4% 15 544 10.7% 39 983 3.5% 4447 16.3% 25 150 6.2% 23 239 2.8% 10 071 4.8% 4 956 5.1% 3 954 13.3% 8 651 3.9% 31 380 10.8%
Q296 Q396 Value 96/95 Value 96/95
261 674 0.9% 245 711 3.7% 27029 1.6% 24 711 6.8% 6 343 0.8% 6 349 6.0% 55 447 -8.0% 54534 -1.5% I 122 -8.8% 1 102 -8.9% 14021 10.5% 11354 8.0% 36 864 -1.4% 34240 3.5% 6 651 8.6% 5 839 -0.6% 28 005 7.9% 25 659 7.0% 31 729 -0.3% 30 936 5.4% 7 334 0.5% 6 976 -0.7% 3 895 12.1% 3 506 7.1% 4676 0.3% 4064 -3.4% 9984 9.4% 9064 10.2% 28 573 8.6% 27 377 6.7%
Q296 Q396 Value 96/95 Value 96/95
248 109 0.0% 232 726 1.4% 23 493 1.6% 21331 5.4% 5 984 -0.5% 5 691 2.1% 49607 -10.2% 48 824 -9.2% 3 388 2.7% 3 338 1.5% 15 828 6.6% 13 316 3.5% 38 373 -0.9% 35 878 3.1% 4416 12.8% 3 980 5.2% 25 063 4.5% 21 583 1.2% 22 685 -1.7% 21 969 6.6% 9919 1.5% 9 886 5.9% 5 130 3.5% 4 654 14.2% 3 960 9.5% 3 720 6.5% 9015 10.0% 8162 2.1% 31 248 6.4% 30394 7.3%
Sources: COMEXT2 and information transmitted by the Member States up to 24.04.1997
[¥ii
eurostat
Q496 Value 96/95
276 321 E 5.5%E 26 219 4.0%
6 881 5.4% 61 536 4.9% 1179E -13.9% E 14 618 9.5% 38 196 1.6% 7 008 -0.9% 28 726 6.3% 34 092 8.0% 7 541 2.0% 3 664 3.3% 4 613 0.3% 9 860 3.7% 32 188 13.2%
[3?11
eurostat
Q496 Value 96/95
265 402 E 4.8%E 23 028 3.1%
6 392 1.4% 57 487 5.6% 3 713 E -9.8% E 16232 6.0% 39480 0.4% 4767 11.0% 27 455 2.2% 24 083 3.7% 9 889 1.8% 5 606 19.5% 4420 9.2% 9 503 -0.6%
.
[image:10.587.100.511.55.818.2]TABLE
3:
STRUCTURE OF INTRA-EUROPEAN UNION TRADE (EUR15)
BY PRINCIPAL PRODUCT GROUPS - YEAR
1996
-DISPATCHES
Foods, beverages,
REPORTING tahacco S/TCO+l
COUNTRIES Evolution
Value 96/95
B.L.E.U. II 911 1.9%
Denmark 5949 0.4%
Germany 13184 0.9%
Greece : :
Spain 8353 9.1%
France 21693 -0.8%
Ireland : :
Italy 8137 7.5%
Netherlands 20367 0.1%
Austria : :
Portugal 870 4.6%
Finland 311 12.9%
Sweden 878 23.7%
United
Kingdom 7 636 -3.5%
ARRIVALS
Foods, beverages,
REPORTING tabacco
SITCO+l
COUNTRIF.S Evolution Value
96/95
B.L.E.U. 9 060 -8.3%
Denmark 2204 3.2%
Germany 22 839 -2.6%
Greece : :
Spain 5 503 -8.8%
France 15 807 0.7%
Ireland : :
Italy 13 029 3.8%
Netherlands 9268 -3.6%
Austria : :
Portugal 2 111 7.0%
Finland I 071 27.7%
Sweden 2260 20.8%
United
Kingdom 12 035 1.9%
Values in millions of ECU « : »: unavailable data
Raw materials S1TC2+4
Evolution Value
96/95 3 015 -1.7% 1233 2.6%
5 034 -20.2% : :
I 762 3.0% 4 308 -10.0%
: :
1489 3.6% 6 685 1.1% : : 666 -25.7% I 658 -16.2% 3 201 -14.6%
1975 -14.2%
Raw material . .,
S1TC2+4
Evolution Value
96/95 3 477 -10.1%
897 -9.1% 7192 -14.9% : : 2244 -11.9% 4110 -11.0% : :
5 962 -6.3% 2 872 -9.2% : : 547 -3.5% 594 -9.0% 882 -13.6%
3 204 -9.0%
Source: COMEXT2 on 24.04.1997
Fuel products SITC3
Evolution Value
96/95 3 082 24.3%
1424 59.1% 3 427 48.8% : : 904 21.7% 3 487 2.9% : : 584 15.8% 12 208 32.5% : : 192 -27.3% 554 77.0% I 163 19.2%
8 822 23.8%
Fuel productf
SITC3
Evolution Value
96/95 6 528 29.3%
412 23.0% 11 251 25.3% : : 921 14.6% 4 784 22.4% : : 1477 20.6% 2 678 18.9% : : 419 0.8% 899 44.9% 1 720 70.9%
1 701 11.3%
Chemicals Machinery, transport Other manufactured equipment gomls SITC5
SITC7 S/TC6+8
Evolution Evolution Evolution Value Value Value
96/95 96/95 96/95 18 557 2.5% 31 250 9.7% 33 945 -0.3%
2 266 8.5% 6 064 13.8% 7 393 5.3% 29 862 -3.1% 104 507 -1.3% 59115 -6.2% : : : : : :
3 902 -0.2% 24 545 14.1% 13 984 5.0% 20 571 2.1% 59 722 5.3% 37 785 -0.1%
: : : : : : 8 796 9.7% 40 319 10.0% 49 060 3.5% 18 039 -2.4% 31173 8.9% 24 756 -2.8% : : : : : : 647 -4.8% 5158 30.4% 7 484 2.2% I 054 -2.7% 5 441 10.3% 8 385 -6.0% 3172 0.2% 13 628 4.8% 12 486 0.3% 15174 1.7% 46 564 6.1% 28102 -0.3%
Chemicals Machinery, transport Other manufactured S/TCS equipment goods
SITC7 SJTC6+8
Evolution Evolution Evolution Value
96/95 Value 96/95 Value 96/95 13 885 4.8% 26 853 13.4% 25 593 -1.4%
2 961 -2.7% 8 250 -0.9% 7 217 -4.2% 21 779 -5.6% 71219 -0.6% 55 621 -10.3% : : : : : : 8469 3.6% 27 258 16.0% 15 982 1.5% 19997 0.6% 62 849 4.3% 45 917 -2.4% : : : : : : 15 712 4.4% 36 960 7.2% 24 866 -0.8% 11173 -4.8% 27161 9.9% 23 080 1.2% : : : : : : 2 377 5.9% 8 239 20.0% 6 542 4.8% 2 257 4.8% 6 750 12.0% 4 083 2.7% 4 173 2.6% 14 538 5.5% 9494 -1.0%
14 806 -3.8% 49 688 6.3% 30 202 -0.7%
I =V!1
eurostat
page
11@?B
eur OS tat
Other S/TC9+ adjustments Evolution Value 96/95 3 461 -16.0% 1645 -39.9% 12 902 13.9% : : 536 151.8% 419 31.4% : : 853 4.4% 16059 4.1% : : 1 17.7% 221 -22.6% 3 881 80.3%
9943 140.4%
@?B eurostat Other SITC9+ adjustment., Evolution Value 96/95 6 939 -6.0% 2107 31.4% 16 880 -12.6% : : 544 121.1% 249 133.1% : : 1245 13.3% 15 745 3.6% : : 111 -I 1.5% 400 6.6% 2 263 -17.8%
[image:11.589.44.530.56.806.2]l=Vd
eurostat
page 12
DISPATCHES
REPORTING
COUNTRJFS B.LE.U. Denmark
B.L.E.U.
-
1.2%Denmark 3.1%
-Germany 11.0% 3.2%
Greece
Spain 4.2% 0.9%
France 13.2% 1.4%
Ireland 7.0% 2.0%
Italy 4.9% 1.5%
Netherlands 17.5% 2.0%
Austria 2.9% 1.2%
Portugal 5.2% 2.2%
Finland 4.6% 5.6%
Sweden 8.3% 11.4%
United
8.9% 2.3%
Kingdom
ARRIVALS
REPORTING
COUNTRIES B.LE.U. Denmark
B.L.E.U. - 0.8%
Denmark 5.2%
-Germany 12.5% 3.1%
Greece
Spain 5.7% 1.2%
France 14.9% 1.4%
Ireland 2.7% 1.3%
Italy 7.9% 1.5%
Netherlands 17.5% 1.7%
Austria 3.4% 1.0%
Portugal 4.4% 1.1%
Finland 5.0% 7.9%
Sweden 5.5% 11.5%
United
8.7% 2.3%
Kingdom
«:»:unavailable data
TABLE
4:
STRUCTURE OF INTRA-EUROPEAN UNION TRADE (EUR15)
BY PARTNER COUNTRIES-J
996
-PARTNER COUNTRIES
Germany Greece Spain France Ireland Italy Nether- Austria Portugal Finland lands
27.5% 0.8% 4.0% 24.3% 0.6% 7.3% 17.5% 1.4% 1.0% 0.8% 34.0% 1.2% 3.0% 8.3% 0.8% 6.0% 6.6% 1.6% 1.1% 4.0%
-
1.2% 6.3% 19.3% 0.8% 13.2% 13.2% 9.9% 1.8% 1.7%
-20.4% 1.4%
-
28.5% 0.6% 12.4% 4.6% 1.2% 12.1% 0.4% 27.5% 1.3% 12.2%-
0.8% 14.7% 7.0% 1.8% 2.2% 0.8%19.4% 0.9% 3.5% 12.5%
-
5.5% 10.1% 0.8% 0.6% 0.8%31.6% 3.4% 8.8% 22.6% 0.7%
-
5.3% 4.3% 2.4% 0.9% 35.6% 1.0% 3.6% 13.7% 0.9% 7.3%-
1.9% 0.9% 1.1% 58.0% 0.8% 3.4% 6.7% 0.4% 13.4% 4.1%-
0.6% 1.0% 26.6% 0.6% 17.8% 17.7% 0.6% 4.6% 6.1% 1.5%-
1.0% 22.4% 0.9% 3.9% 8.1% 1.1% 4.7% 7.3% 1.6% 0.9% -21.4% 0.7% 3.6% 8.5% 1.1% 5.8% 10.2% 2.0% 0.9% 9.4% 21.6% 1.2% 7.0% 17.8% 9.0% 8.4% 14.1% 1.3% 1.8% 1.9%PARTNER COUNTRIES
Germany Greece Spain France Ireland Italy Nether- Austria Portugal Finland lands
26.1% 0.2% 2.5% 20.2% 1.9% 5.6% 24.6% 0.8% 0.7% 0.8% 31.4% 0.2% 1.8% 8.0% 1.8% 6.3% 10.1% 1.4% 1.5% 4.1%
- 0.7% 5.5% 18.6% 2.0% 13.7% 19.0% 6.6% 1.9% 1.6%
-22.7% 0.5%
-
27.0% 1.3% 13.5% 6.9% 1.5% 4.3% 1.0% 28.4% 0.3% 10.0%-
2.0% 14.6% 9.9% 1.2% 1.6% 1.0% 11.7% 0.1% 2.0% 6.7%-
3.2% 5.7% 0.4% 0.5% 1.0% 30.7% 1.2% 6.9% 21.8% 1.7%-
9.6% 3.8% 0.8% 0.9% 34.6% 0.2% 3.2% 11.5% 1.7% 5.5%-
1.3% 1.0% 1.4% 62.9% 0.3% 1.5% 6.1% 0.5% 11.3% 6.3% - 0.4% 0.8% 20.5% 0.2% 29.7% 14.7% 0.7% 10.9% 5.9% 0.8% - 0.7% 23.9% 0.3% 1.9% 6.7% 1.2% 5.7% 8.4% 1.7% 1.0%-28.6% 0.2% 1.9% 8.8% 1.9% 5.0% 10.4% 1.6% 1.1% 8.7% 27.3% 0.4% 5.0% 17.8% 7.2% 8.8% 12.4% 1.1% 1.7% 2.6%
Sources: COMEXT2 and information transmitted by the Member States up to 24.04.1997
[3?Lj
eurostat
Sweden United TOTAL Kingdom
1.9% 11.7% 100.0% 16.4% 13.9% 100.0% 4.2% 14.2% 100.0% : 1.3% 12.0% 100.0% 2.2% 14.8% 100.0% 2.7% 34.2% 100.0% 1.8% 11.7% 100.0% 2.9% 11.7% 100.0% 2.2% 5.4% 100.0% 2.6% 13.5% 100.0% 19.8% 18.9% 100.0%
-
16.8% 100.0% 4.6%-
100.0%[3?Lj
eurostat
Sweden United TOTAL Kingdom
3.6% 12.2% 100.0% 17.8% 10.4% 100.0% 3.3% 11.4% 100.0% : 2.1% 12.3% 100.0% 1.9% 12.7% 100.0% 2.2% 62.5% 100.0% 2.3% 10.9% 100.0% 4.3% 15.9% 100.0% 2.0% 3.6% 100.0% 1.6% 8.9% 100.0% 22.9% 13.4% 100.0%
[image:12.589.41.566.35.504.2]I
=Vil
eurostatpage 13
DATA AVAILABILITY
Status of data sent to Eurostat on 2 June
J
997
0 Intra
+
Extra:
./ Detailed data (CN8 data)
8 Intra / Extra:
• Detailed data (CN8 data)
• Global data with breakdown by partner country
.·
PERIOD Eur.15 BLEU
DK
D EL E F lRL I NL A p FINs
UK' .
i
' .,/ .,/ .,/ .,/ .,/ .,/ .,/ .,/ .,/ .,/ .,/ .,/ .,/ .,/ .,/
, ... January ...
1:.c,• . I·
.. Febrttal"Y · .... .,/ .,/ .,/ .,/ .,/ .,/ .,/ .,/ .,/ .,/ .,/ .,/ .,/ .,/ .,/
I•• I:
I•
.,/ .,/ .,/ .,/ .,/ .,/ .,/ .,/ .,/ .,/ .,/ .,/ .,/ .,/ .,/
I 'March
I .
••
.,/ .,/ .,/ .,/ .,/ .,/ .,/ .,/ .,/ .,/ .,/ .,/ .,/ .,/ .,/
· April
:• : ..
:.1 ·
:Ma'V
.,/ .,/ .,/ .,/ .,/ .,/ .,/ .,/ .,/ .,/ .,/ .,/ .,/ .,/ .,/....
9
June
.,/ .,/ .,/ .,/ .,/ .,/ .,/ .,/ .,/ .,/ .,/ .,/ .,/ .,/ .,/9 July· .,/ .,/ .,/ .,/ .,/ .,/ .,/ .,/ .,/ .,/ .,/ .,/ .,/ .,/ .,/
.. ,.
6
. Aua:ust,
.,/ .,/ .,/ .,/ .,/ .,/ .,/ .,/ .,/ .,/ .,/ .,/ .,/ .,/ .,/·.
1: ••• ·•·•· September
.,/ .,/ .,/ .,/ .,/ .,/ .,/ .,/ .,/ .,/ .,/ .,/ .,/ .,/ .,/
•••
.. ·. Octrtber :
.,.
.,/ .,/ .,/•1•
.,/ .,/ .,/ .,/ .,/ .,/ .,/ .,/ .,/ .,/<
.. November··
.,.
.,/ .,/ .,/•1•
.,/ .,/ .,/ .,/ .,/ .,/ .,/ .,/ .,/ .,/.
•.:: .
1.: '
December
.,.
.,/ .,/ .,/•1•
.,/ .,/ .,/ .,/ .,/ .,/ .,/ .,/ .,/ .,/I•::,;,:: ..
I.•
PERIOD Eur.15 BLEU DK' D EL E F lRL I NL A p FIN
s
UK···.· ' .
January .,/ .,/
.,.
.,/ .,/_,.
.,/ .,/ .,/ .,/ .,/February ...
.,/ .,/ .,/ .,/_,.
.,/_,.
.,/ .,/9
··March
_,. _,.
_,. _,.
_,. _,.
.,.
9 April
7
MaY
I =Vt1
eurostatpage
14IMPROVEMEN'I OF 'IHE S'IA'IISl'ICS
RE&A'FING '10 'IHE EXCHANGE GOODS:
'IHE PROGRESS OF THE WORK
Eurostat and the Member States have set up three working groups
responsible in various domains for improving the operation of the
lntrastat system and enhancing the quality of the statistics (cf.
Newsletter 2/1996, page 13). The progress of work is described
below.
WORKING GROUP
I
W
orking Group I (' Statisticalmeth-ods and links with taxation') has made progress in harmonising the treat-ment of 'specific' movetreat-ments of goods. As well as aligning the rules applicable to extra-Community and intra-Commu-nity movements (ships and aircraft, com-plete industrial plant, etc. ), common methods have been proposed in the fol-lowing fields: marine products, military goods, ships' and aircraft's stores and supplies and staggered consignments. The purpose of these methods - which in some cases will require the national authorities to introduce specific controls and the use of several sources of infor-mation - is to achieve greater conformity with the United Nations recommenda-tions. These proposals should shortly be reflected in amendments to the Com-munity rules currently in force.
As far as the link between Intrastat and VAT is concerned, a working document has been drawn up in close collabora-tion with DG XXI, the Commission DG responsible for customs and indirect taxation. This document sets out and discusses - for the various types of com-mercial transaction - the formalities re-quired under the transitional VAT sys-tem and Intrastat. Its main purpose is to
simplify and improve the national depart-ments' checks, which rely on matching up statistical and fiscal information.
The group will continue its work on im-proving and adapting statistical meth-ods over the coming months. However, the proposals relating to simplification of the Intrastat system will be examined within a broader context in collaboration with all the Member States.
WORKING GROUP
II
A
s already described in the lastEdicom Newsletter (2 : 1996, page 14 ), Working Group II is investi-gating ways to improve processing and verification procedures within the Mem-ber States.
The first stage of the Group's activities has focused on gaining in-depth infor-mation about the types of processing and control procedures of each Member State present. The countries involved (France, Germany, Italy, the Netherlands, and the UK) have marked differences in their systems and this wide variety in the way information is collected and processed presents difficulties for com-paring procedures directly.
Therefore, the second stage has focused on how control and correction proce-dures in the different countries can be sensibly evaluated. Approaching effi-ciency of controls and corrections it can initially be said that measuring the total costs and benefits of the national sys-tems is a very difficult task. The quality of the statistics presented will finally be the result of a large mix of factors e.g. error handling routines, use of informa-tion systems for declarainforma-tion, cooperainforma-tion with declarants etc., and it is nonnally not possible to isolate the effect of one factor from another. It was therefore de-cided to determine indicators for the ef-ficiency of the control and correction procedures. It is, however, not excluded that elements of costs are to be found on the list of indicators.
The Group has preliminary identified a number of indicators which have been roughly divided into control categories. Some examples are as follows:
Controls
for Completeness
• non response at due date, publica-tion date, and Eurostat delivery (number of enterprises and estimated value).
• number of partially responding en-terprises at due date, publication date, Eurostat delivery.(number of enterprises and estimated value)
• penalties
~ the penalty for non-response
usually applied
~ effects of penalty actions
enter-prise register and the cost of mainte-nance.
Q total number of enterprises in the register
Q how often the register is updated and which data elements are up-dated
Q number of enterprises which have been deleted/made inactive and why
Q number of new enterprises placed on the register
Controls
for Validity
• as a proportion of total declarations ( above assimilation threshold) - how many fail validity checks and what is their value
• how many man-hours per month are spent on validity controls?
• how many automatic corrections are performed in an average month? • how many manual corrections are
performed?
• what is the difference in the number of validity failures between ED I/dis-kette/tape/paper declarations?
Controls
for Accuracy
• what comprises the credibility checks?
• which declarations are credibility checks. applied to?
• are 100% of high value items checked for credibility? - what is high value? • how many declarations fail credibil-ity checks and what is the value as a proportion of total declarations checked
• what are the number and value of credibility failures that are corrected? • the size of late revisions to the
sta-tistics
• number of trade challenges from us-ers.
Helping Declarants
Help 1'hernselves
• number and nature of trader inquir-ies.
The third stage of the Group's activities will focus on the creation of a question-naire around the indicators and gather-ing proposals from the Member States on which indicators they can employ, and how this can be done.
The forth stage will see the Member States measuring the efficiency and ef-fectiveness of their control and correc-tion systems. The resulting data will be collected via the questionnaire.
The Group realised at an early stage that, given the enormous differences in the National systems, it can not aim to stand-ardize controls over the Member States. Instead the aim for the fifth, and final, phase of the Group's work is to present a report which states how effective and efficient each Member State finds their system of controls and if interested, other Member States can approach the Mem-ber State concerned for more details of their system. The results of the ques-tionnaire will form the basis for this re-port.
WORKING GROUP
III
W
orking Group III deals with data adjustment and quality. The first aim of the group is to produce a detailed report on adjustment procedures cur-rently in use in different Member States. Based on the report, the group would like to recommend some good and suit-able adjustment methods for those Mem-ber States that do not yet adjust (see the table following). The need foradjust-1
=Vd
eurostat
page 15
ments arises from, for example, partial and non response or below threshold trade.
The working group had its second meet-ing on 20 and 21 February 1997 at the CBS in Heerlen. Since the first meeting held in London at the end of September last year (a detailed report of the meet-ing can be found in Newsletter 2/96) Ger-many joined the group. In addition, the UK representative has been changed (the United Kingdom chairs the group). Other members are Ireland, the Netherlands and Sweden.
In Heerlen the working group discussed the latest version of the "Overview of adjustment procedures in the 15 EU Member States". It was agreed that all Member States should be invited to up-date their entries later this year before the group's report is produced. Eurostat also reported progress on the work on adjusting mirror statistics for the part of trade that is not broken down by partner country.
The working group agreed that the re-port of the group should include sec-tions on estimation for: partial and non response, below threshold trade, and rapid results ( on the table one can find current activities of the Member States
in these fields). In addition, it was agreed that whilst a lot of information on esti-mation techniques in use had been as-sembled, very little comparative evalua-tion of the techniques was available and this should be a priority for the group.
I =Vt1
eurostatpage
16
RDE:
COMEXT:
Overview of Adjustment Practices in Member States
Adjustments are included into data sent for Rapid Data Exchange but not into detailed COMEXT data. Adjustments are included into detailed data sent for the COMEXT database. ·
No
RDE No simplification threshold No
COMEXT (since 1996) No Quantities are estimated - No COMEXT
COMEXT Quantities are estimated- No
COMEXT (since 96)
No No simplification threshold No
Until December 1995, for SNA and
BOP only. Since January 1996, No simplification threshold No provided to Eurostat.
Yes, but not provided to Eurostat. No No
COMEXT No simplification threshold No
No No simplification threshold No
Nature of transaction and mode Yes, but for national statistics only. of transport are estimated for No
national oses onl .
RDE No simplification threshold No
Yes, but not provided to
Yes, but not provided to Eurostat No simplification threshold No Eurostat
Trade between assimilation threshold The simplification threshold is and simplification threshold is in fact used as an assimilation No included in annual publications only. threshold.
Total arrivals and COMEXT No simplification threshold dispatches (no
breakdown by partner country)
ROE; for COMEXT not
RDE; for COMEXT not in standard in standard format
00 ;
w
~ ~
;
lJ lJ
~ ~
1J-1J-fi'r.).I!
I
~
IC
<9
~
IKTIASTAT(i/
I =Vd
eurostat
page
17SIMP&IFICAl'ION IN
Sl'Jll'ISl'ICS
- l'HE
INl'RJISl'JII'
CASE
-By Jurgen Heimann* Report presented at the conference on "The Quality of the European and National Legislation and the Internal Market" held on 23-25 April 1997, The Hague
Introduction
0
•
The Intrastat case - excessive rules and costs?
a)
Intrastat legislation
b)
costs for administrations and respondents
c)
. . . and the benefits?
0
The SLIM initiative just in time
a)
before Slim
b)
SLIM at the right time
l
d)
c)
problems of implementation found
the Intrastat SLIM team and its proposals
0 Lessons from Intrastat and the SLIM initiative
1.
INTRODUCTION
S
implification in statistics is not a new topic. In the past many statistical in-stitutes in the Member States have had to face budget cuts which could not be met solely by the rationalisation of inter-nal working operations but where a re-duction of the statistical programmes be-came necessary. More recently, strong political movements advocating deregu-lation and simplification oflegisderegu-lation am-plified the pressure to achieve further simplification of administrative obliga-tions. These initiatives, conducted at national and EU level, focus on the ad-ministrative burden of business and aim to lighten this burden in order to improve the competitiveness of enterprises and thus their employment creating poten-tial. Within this setting, statistics have been targeted for simplification.pression at the political level as well and may explain why statistics attract rela-tively high political attention in the de-bate on simplification despite the fact that statistical obligations only count for about 5% of total administrative costs carried by enterprises.1
Under these circumstances the produc-ers of official statistics are confronted with a challenging situation. On the one hand they should contribute, with ap-propriate simplification measures, to per-ceptible cost reductions at the level of the responding enterprises, on the other hand users expect their steadily increas-ing needs for statistical information to be met. It is interesting to note that the main users, government services and business federations, come from the same camp as those requesting simplifi-cation.
The following presentation of the Intrastat case illustrates these
conflict-ing interests and presents the experi-ences which have brought about accept-able solutions for both the providers and users of these statistics.
2. THE INTRASTAT
CASE - EXCESSIVE RULES
AND COSTS?
a) Intrastat legislation
W
hen customs formalities wereabandoned with the completion of the Single Market on I January 1993, a system called Intrastat was set up to collect statistical information directly from enterprises on the trading of goods between Member States. The core of the new collection system is its link to the VAT system. The decision to link statis-tics to fiscal procedures had important methodological and practical conse-quences which are reflected in the Intrastat legislation2
( e.g. scope,
defini-tion of parties responsible for providing information, date/period of registration of intra trade transaction, possibility of combined fiscal and statistical declara-tions, register of intra Community opera-tors, data transfer from tax administra-tion to statistics for control/quality pur-poses).
It is clear that the reference to the VAT system and the corresponding legisla-tion has complicated the Intrastat
legis-Statistics suffer a certain unpopularity. Small and medium sized enterprises (SMEs) in particular argue that the sup-ply of statistical information is a cost with little or no benefit. This view finds
ex-The author, Principal Administrator in Eurostat, European Commission, is not presenting the position of his Institution, but expressing his personal views.
A. Machin (1995), 'Statistical burdens on business'; P. Caille (1997), 'The question of the cost of administrative information'.
I
eurostat=Vil
page
18lation. However, most of these provisions were made to assure parallelism concern-ing the fiscal and statistical treatment of trade operations which contribute to simplification of data reporting from trad-ers. Certainly, the question to be asked is, whether EU legislation has been ex-cessively extended and is unnecessarily detailed? The author's personal opinion is affirmative, as experiences have shown the functioning of the Intrastat system is less reliant on these detailed provi-sions than was envisaged when the leg-islation was drafted and, in practice, is far more influenced by differences within the national administrations.
The Intrastat legislation differs from most other EU legislation in the statisti-cal field by its direct intervention into the conceptual choice and design of the collection system, which normally is the responsibility of the Member State. What are the reasons for this? First proposals made in 1985 by the Statistical Office of the European Communities (Eurostat) favoured an autonomous system of data collection for one flow (intra exports) only. Such a system without any sup-port from other administrative procedures and tied in national statistical infrastruc-tures was rejected by Member States because of doubts on its applicability and the risks concerning the reliability of the data. They requested that the Com-mission define a collection system which established links to other administrative systems in order to assure contro 1 of cov-erage and/or to allow a combination of administrative and statistical reporting.
Therefore, the provisions made concern-ing the collection system constituted a prerequisite for the adoption of the new EU legislation by the Member States in this domain. The Commission had to ac-cept this framework, or jeopardise the deadline (1.1.1993) for the introduction of the lntrastat system. A simpler and more output orientated approach was thereby abandoned.
The introduction of a threshold system3
was another very sensitive issue which contributed to the increased complexity
of EU legislation. In this case, however, the traders profited directly from these provisions which set the conditions for partial or total exemption from reporting obligations. The threshold system, as well as the co1lection system in general, required vastly more complex provisions to ensure the differing situations in the Member States could be accommodated.
Finally, the EU legislation looks overdetailed as it has not just set mini-mum requirements to satisfy Community information needs but also fixed mini-mum/maximum limits ( e.g. listed manda-tory and optional data elements) and in-cludes other means to equalise the sta-tistical burden of reporting traders across all Member States.
In conclusion, there are a number of good reasons (and not simply the eurocrat's mania for regulation) which explain the degree of complexity of these rules; it has been done, at least in part, to protect the interests of data providers. However, there are areas for which simplification of that legislation is desirable (see para-graphs on the SLIM project). In cases where complexity cannot be reduced, it would be appropriate to improve com-munication with the users of legislation by issuing explanatory notes, comments on legal texts, and examples of specific cases.
h) costs /or traders
and national administrations
The
EU legislation on Intrastat deter.l
mines, to a great extent, the statisti-cal burden of intra Community operators by setting the rules for the threshold sys-tem, the list of mandatory data to be trans-mitted, and the delays and frequency of that transmission. Nevertheless, the compliance costs for the respondents are also influenced by the specific national regulations which, in conformity with the EU rules, fix:• the value levels of the thresholds (the lowest being 26,000 ECU for in-tra imports in Greece and the highest being 621,500 ECU for intra exports in Ireland),
• the list of additional data (from the EU list of optional data, maximum 5 additional data elements),
• the conditions for specific conces-sions granted to traders for opera-tions which are still not harmonised at EU level, e.g. simplified declara-tions for motor vehicle parts etc.
In addition, the national choice of decla-ration mode (purely statistical declara-tions or combined fiscal and statistical declarations) as well as the offered data transmission infrastructure (paper forms, electronic media, EDI), which still varies a lot between the Member States, affects the costs for traders.
Finally, costs are also determined by the characteristics of the traders: size of the company, number of trade operations, internal organisation, and tools used for data production and transmission to the national services.
Eurostat has conducted different stud-ies on the costs of lntrastat which pro-vide the following picture:
• Between 450,000 and 500,000 traders (mainly SMEs) in EU 15 submit Intrastat declarations ( 1996), • Less than 20% of all intra
Commu-nity traders provide 95% of the total value of intra trade,
• More than 2/3 of all lntrastat decla-rations are made on paper,
• The yearly total running costs of Intrastat for the responding enter-prises are estimated at about 500 mil-lion ECU (accuracy: +/- 200 milmil-lion
EClJ),
• The yearly running costs for national compilers of Intrastat are estimated to amount to approximately 100 mil-lion ECU,
According to an opinion poll
4carried out
in 1995 among 4 700 providers oflntrastat data in 12 Member States on behalf of Eurostat, 37 % believe that - compared to the previous customs declaration sys-tem - the introduction of Intrastat has reduced their costs, 34% think that costs are at similar level and only 20% think that costs have increased. The opinion that costs have been reduced is con-firmed by other studies 5
• Moreover, the
opinion poll did not indicate the full di-mension of simplifications introduced as it did not cover those traders which have been fully exempted from Intrastat obli-gations. The introduction of the thresh-old system has led to the exclusion of2/3 of all intra Community traders from mak-ing any kind of statistical declaration, obviously reducing their statistical bur-den.
The opinion poll also revealed that SMEs spend on average less than 1 man-day per month producing the Intrastat dec-laration, large companies with a higher volume of trade average at least 2 man-days.
However, Intrastat was the target of much criticism among SMEs as these statistics appeared as a new and unex-pected task. Few enterprises realised that the former customs system included sta-tistical reporting; the forwarding agents, which often completed the formalities, invoiced this service without any differ-entiation as the statistics were fully inte-grated in the customs declaration. In addition the criticism focus on the level of detail at which information on intra trade has to be provided. 6
In conclusion, it appears from traders' reactions that the lntrastat system is still too costly, too many SMEs are encum-bered with detailed data requirements.
Eurostat ( 1996) Intrastat opinion polls p.44
On the compilers' side, a few national
services are very active in exploring sim-plification measures designed to reduce the budget share devoted to Intrastat. They consider lntrastat ties up re-sources which are needed in other sta-tistical domains.7c) •...•
and the benefits
I
n order to judge if the costs oflntrastat are excessive it is necessary to evalu-ate the benefits of these statistics ( or the losses if they were to be abolished). It would be very difficult to express the benefits in quantitative terms (value) as there does not exist a true market price for official statistics. A quantitative meas-urement of the benefits would inevita-bly suffer from arbitrary assumptions and would consequently led to disputable results.lntrastat data are mainly used by national and EU administrations, the national and European business federations, and com-panies. Within the sphere of economic statistics, foreign trade statistics is un-doubtedly the area with the largest number of data disseminated (millions of figures every month) and, more impor-tantly, the largest number of users pre-pared to pay for this data. User requests mainly concern monthly figures at the detailed product level. There is no sig-nificant difference in the demand pattern of the various user groups; however ad-ministrations concentrate their detailed data requests on those sectors which ceive subsidies or are under specific re-gimes like the agricultural, steel, or en-ergy sectors. Intrastat provides that de-tailed information according to a goods classification code, the Combined No-menclature, which is applied in extra Com-munity trade as well. This nomenclature
European Parliament (1996), 'The impact of VAT and Intrastat obligations on SMEs'
A. Lunden (1996), 'The Intrastat system from the SME point of view' p.12lff J. Kidgell ( 1996), 'Intrastat- Have we achieved a single system for the single market?' p.66 G. Rambaud-Chanoz (1996), 'Options for Intrastat: progress and outlook' p.187ff. and L. Iapadre ( 1996), 'The Intrastat system from a user's perspective' p.305ff.
1
=Vd
eurostat
page
19
serves, with nearly 11 OOO coded
sub-headings, not only statistical but also customs/tariff purposes.Users may, of course, only benefit from that detailed breakdown if the results published are timely and are of sufficient reliability. Undoubtedly, the quality of intra trade statistics suffered with the introduction of the new collection sys-tem. A significant difference in the pat-tern of data can be clearly seen using time series analyses between pre-1993 data and the data collected under the lntrastat system. Also observed has been increased inconsistencies at the global and detailed levels by comparing corresponding flows (mirror statistics). Monthly statistics at the detailed prod-uct level for all declarant Member States were initially published about 8 months too late; however this situation has im-proved as both declarants and adminis-trations are now more used to the sys-tem, but there are still a few Member States that are 3 months behind.
The main weakness oflntrastat, besides the cost of the system, is the size of in-consistencies in the results leading to high uncertainty about the real trade
performance of a given Member State. 8