]
--, iL''-J,
I
*
rr*
**
**
*****
EUROPEAN COMMISSION
DIRECTORATE GENERAL XIXBUDGETS Expenses
Structural Actions
MAY 1996
WORKING
DOCUMENT
ttilDINBIOPT
Implementation
of the
Structural
Funds
Budget
1989-1995
I
)t
Implementation of the Structural Funds budget 1989-95
.St
1.
Problemswith
a
"top-down"
approach toprogramming
The
overall
allocation
for
the
Sfru:cturalFunds
is
determined
in
advance
of
anyprogramming
exercise and constitutes, within thefinancial
perspective, not only aceiling
but also
a
targetfor
spending. Thisfact
was takeninto
account when theprogramming
documents
(CSFs
and
SPDs)were adopted
in
1994
and
1995,
allocating
theappropriytions
by programme to the various objectives andMember States.In
the
caseof
commitmentappropriations,
thereis
no
distinction
betweenthe
annualforecasts,
which
are
merely annual
instalments
calailated'
on
the
basis
of
theprogramming
docaments,and
the multi-annual progratnming,which
is itself
based on budgetfiguresrather
than genuineplntning.
There
is
noprogramming
in
thestrict
senseof
the
termfor
Pryment
appropriations. Forecastsare
calculated accordingto a
somewhat mechanical method,on
the basisof
theoretical due datesfor
payments.2.
(Jnderspending ofStructural Fund
appropriatians givescausefor
concernIn
both
1994and
lgg5EC(l
2billion
of
the commitment appropriations allocatedto
theStructural Funds went unused. Apart
from
the problems caused by the timerequiredfor
adopting programming documents
for
the neu,period,
the Member States haddfficulties
putting
up
the national
cofinancingfunds
in
a
climate
of
budgetary
restraint. In
accordance
with
the
Interinstitutional
Agreement
of
1993,
unused
commitmentappropriations
will
be re-enteredin
the budget to ensure that the spending targetsfor
theStructural
Funds are met. This meansputting
off
to the endof
the programmingperiod
the
question
of
whether the Member
Statesare able
to
absorb
thefull
amount
of
appropriafions.
There wasalso
inntffcient utilization
of
pryment
appropriations
in
1994
and
1995. Some ECU 4.5billion
was unusedin
1994 and ECU 4billion
in
1995.This meant
that
the Member States made ovailable own resourcesunnecessarily.
Thereason
for
this under-utilization ofpryment
appropriations is that payments were slowerthan
in
theprevious programming
period.
This, coupledwith
the large
increasein
commitment appropriations, has been the main reason
for
the increasein
the volumeof
outstanding commitments (the camulative
total
of
commitmentsstill
awaiting payment)from ECU I5 biltion
in
1993 to ECU 23billion
in
1995. Contrary toawidely held
view,however,
the pace
at
which
outstanding
commitmentsare
being cleared has
not
slackened over the years.
3.
Excessive concentration of the use of oppropriations at the endof
theyear
Use
of
appropriations
has been heavity concentrated towards the endof
theyear in
the54%
in
1994and
38%in
1995. Thisnot only
caused administrative problemsbut
also affected the management ofindividualfiles.
!
lr
t.
UTILTZATION
OFCOMMTMENT
APPROPRIATIONSFORTIfi
STRUCTURALFT.JNDS SINCE 1989...
...61.1.
1994...
...:...-...---.71.2.
1995 ...l.3.'Breakdownofutilizationbyobjective...
1.4.
Breakdown of utilization byMemter
State
...'...-UilLVATION
OF PAY-I\{B:I{T APPROPRIATIONSFOR
THE
STRUCTLJRAL FTJNDS SINCE 1989AI'ID
TREND
IN
OLTTSTAI.IDINGCOMMITMENTS
.-...
..." 132.1.
Utilization
of payrrent appropriations...----...
-.-...""
132.2.
Trendin
outstandingcommitments
..."
142.3.
Breakdown of outstanding commitments by Fundand by Member State
...
...--..---17RELIABILITY
OF FORECASTS...
...202.
3.
Implementation
of theStructural
Funds budget, 1989-95Detailed a is and comments
Since
the
introduction
of
the
most
recent reforms,
there
has been
substantialunder-utilization
of
both the commitment appropriations and the payment appropriationsallocated
to
the
Community'sStructural
Funds(EAGGF
Guidance,ERDF, ESF
andFFG).I In
1995
heading2
of
the
financial
perspective showedthe lowest
rates
of
utilization:
at the endof that
yearF;CIJzbillion in
commitment appropriations and over ECU 4billion
in payment appropriations available for the Structural Funds were not used.Before
analysing the waysin
which the
appropriations concerned areutilized,
attentionmust
first of
all be drawnto
their special nature since they represent both a ceiling and atarget
for
expenditure.The
Struchyal Funds appropriations, thetotal
amountof
whichwas
setin
Edinburghin
December
1992
for the-period lgg4-gg
andthen
increasedin
December 1994in
the contextof
enlargement, are the subject of programmes covering the period1994'99-The
sums
in
question
were
allocatedby
objective
and
by
Member State and
theCommission
informed
eachMember
Stateof
the
annualfigures
designedto
ensurecompliance
with the
ceilings setin
Edinburgh andthus
remainwithin the
expenditureceiling
for
heading2.
The
schedulesfor
the useof
these overall amounts were then setforth in
numerous operational programmes (OPs)and.single
Programming Documents (SpDs)2 drawnup
atthe
endof
1994for
the
existing Member Statesof
the Union
and expandedin
1995to
cover the three new Member States.Since
the
expenditurefigure
representsa
target, the
total
commitment appropriations entered in the budget must be equivalent to the original overallallocation.
The budgetaryarrangements
for
heading2
(as distinct
from
alt the other
budgetary
spending) are essentially " top-down".It
should also be pointed out that the amounts set asidefor
the Structural Funds have beenthe
subjectof
a political
decision,which
has beengiven
shapein
formal
Commissioninstruments. Under the legislation as
it
now stands, these amounts represent targets which everyeffort
should be madeto
achieve.The payment appropriations, on the other hand, do not represent expenditure
targets.
Theuttto.rni
proposedby the
Commissionin its
preliminary
draft
budget
is
basedon
anIn
this document the figures and cornments relatingto
the FIFG cover fishery stnxctures measures implemented over the period 1989-95, although the FIFG itself had no legal existence before 1993.It
is
on the basisof
these documents that appropriations are committed. The Community Support Frameworks, which lay down general guidelines. do not forrn the b:rsis for budgetary commitment.estimate
of
the
sums neededto
cover
both
new
appropriations andthe
paymentof
outstanding commitments. The utilization
of
such appropriations isof
great importance, however, sinceit
determines the level of own resources called in from Member States.1.
Utilization
of
commitment appropriations
for
the Structural Funds
since1989
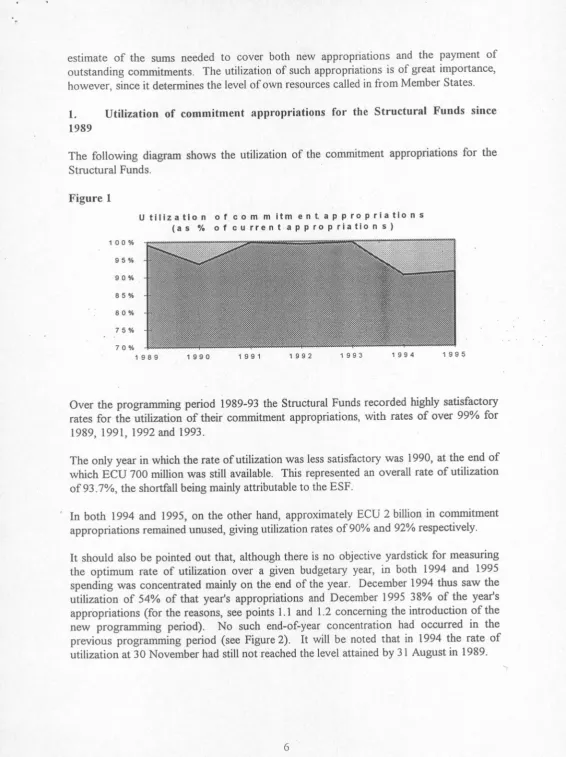
The
following
diagram shows theutilization
of
the
commitment appropriationsfor
the [image:6.591.12.579.36.794.2]Structural Funds.
Figure
1U
tltlzatlon of com
mltm enLap propriatlons
(as % of current aPProPriation
s)
1000
95c6 90% 85%
8Oo/c
7 50h 7 Oo/o
1992 1993 1994 1995
Over
the
programmingperiod
1989-93 the Structural Funds recorded highly satisfactory ratesfor
theutilization
of
their
cornmitment appropriations,with
ratesof
over
99Yofor
1989, 1991,1992 and 1993.
The only year in which the rate of utilization was less satisfactory was 1990, at the end
of
which ECU
700 million wasstill
available. This represented an overall rateof utilization
of
93.7Yo, the shortfall being mainly attributable to the ESF.In both
1994 and 1995, onthe
other hand, approximately ECIJ 2billion
in
commitment appropriations remained unused, giving utilization rates of 90% and 92% respectively.It
should also be pointedout
that, although there isno
objective yardstickfor
measuringthe
optimum rate
of
utilization
over a
given
budgetary year,in
both
1994and
1995spending was concentrated mainly on the end
of
theyear.
December 1994 thus saw theutilization
of
54Yoof
that
year's appropriations and December 1995 38yoof
the
year'sappropriations
(for
the reasons, see pointsl.l
and 1.2 concerning the introductionof
then"*
programming
period). No
such
end-of-year concentrationhad occurred
in
theprevious programming
period
(see Figure2).
It
will
be notedthat
in
1994the rate
of
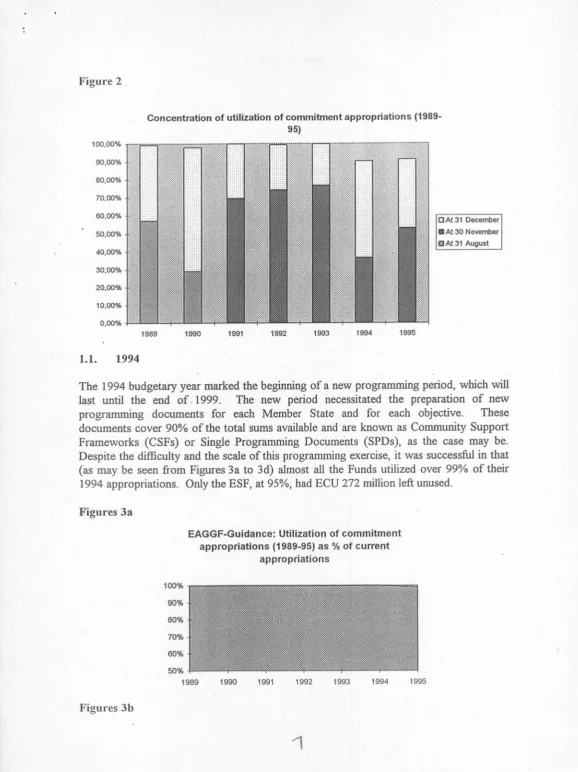
Figure
2100,o0% 90,o0%
80,o0%
70,@oh
60,0O0/6 50,000/6
4Q,OOo/o
30,000/6
20,OO0/6
'lo.0006
O.OO0/6
Concentration of utilization of commitment appropriations (1989-es)
1989 1990 1991 1993 1994 I OOq
1.1.
t994
The
1994 budgetary year mz!.rked the beginningof
a new programming period, whichwill
last
until the
end
of.1999.
The new period
necessitatedthe
preparation
of
newprogramming
documentsfor
each
Member
State
and
for
each
objective.
These documents cover 90Yoof
thetotal
sums available and areknown
as Community SupportFrameworks (CSFs)
or
Single Programming Documehts (SPDs), asthe
casemay
be.Despite the
difficulty
and the scaleof
this programming exercise,it
was successful in that(as may be seen
from
Figures 3ato
3d)
almostall
the Fundsutilized
over 99o/oof
their1994 appropriations. Only the ESF, at
g|oh,hadBcu
272 million left unused.Figures 3a
EAGGF-Guidance: Utilization of commitment
appropriations (1989-95) as % of current
appropriations
100016
9006 80%
700h
60%
50%
1 994
{ oo?
1 992
1991
1
Figures 3b
10006 90%
80%
700h
60%
50%
FIFG: Utilization of commitment
appropriations (1990-95) as % of current
appropriations
1992 1993
ERDF: Utilization of commitment
appropriations (1989-95) as % of current
appropriations
1 989 1990 1 992 1993 1994 1995
ESF: Utilization of commitment
appropriations (1989-95) as % of current appropriations
1990 1991 1994 1995
Figures
3cFigures 3d
100%
90%
q0%. 70%
6006
50%
10006 .
90%
80%
700h
60016
50%
The
main
reasonfor
underutilizationof
Structural Funds appropriationsin
1994 was,however,
that
(asis
shownin
Figure 3e)only
l2o/oof
the appropriationsfor
Community [image:9.591.15.582.24.801.2]initiatives were committed.
Figure
3eCommunity initiatives: utilization
of
commitment appropriations (1991-95) as %
of
current appropriations
60,00%
40,ff)%
20,00%
0,00%
1991
Of
the
ECU
1 927million
allocated
to
Community initiatives
for
1994,
onlyF;CIJ 230 million was spent in that
year.
Of theECU
I
697 million which remained at the endof
the year, ECU 339 million was carried overbut
only ECU 310million
wasin
factused
in
1995.This underspend derives
from
the fact that before the Community initiative prograrnmescould be drawn up, the Commission had
to
lay down guidelinesfor
Community initiativesover the
period
lgg4-gg,
for
unlikethe
CSFsor
SPDs, whichreflect
national prioritiesdeclared
by the Meniber
States, these initiatives reflect Communitypriorities
setby
the Commission.The
communicationslaying down
these guidelinesand
requestingMember
Statesto
submittheir
prograrnmeswithin four montls
were
publishedin
the
Official
Journalin
July1994.
It
was notuntil
late-November 1994, therefore, that the Commission receivedfrom the
Member
States
the
first
applications concerning
the
implementation
of
'Community initiative programmes.
Despite
the
Commission's effortsto
adopt as many programmes as possiblein
1994, thetime remaining before the end of the financial year was
too
shortfor
the properutilization
of the appropriations available.1.2.
q
Although
in
1995 decisions had already been taken on almost all the CSFs and SPDsfor
the
period
lgg4-gg, a number of operational programmes (OPs) had still to be adoptedfor
the CSFs.At
the endof
1995 the position as regards utilization was different from that at the endof
1994, forit
was the "national expenditure" (CSFsor
SPDs) which accountedfor
mostof
the appropriationsleft
unused.Most
of this under-utilization was attributableto
the ESF(ECU
I
585 million not utilized, i.e. a utilization rate of only 76%).There
were various
reasonsfor
the difficulties
encounteredby the
CSFsand
SPDsin
1995.
In
the
first
place,
aswas
probablythe
casein
1990,there had
beena
delay
in
thepreparation and therefore
the
adoptionof
the
programming documentsin
the
previousyear and
this
hadin turn
delayed the implementationof
the
prograormesin
1995.
Therequirement that 40o/o
of
a given tranche must be utilized before thefollowing
tranche canbe
committed makes
for a
certain
inertiq
so
that
1995 suffers
as
a
result
of
an unsatisfactory rate of utilizationin
1994.This
difficulty is
amplifiedby the.fact that the
Singte Programming Documents,which
bring
togetherthe
CSFs and operational programmesin
one stage andwhich
have been chosen by many Member States as a programmingtool,
have madeit
possibleto
committhe
first
tranche
more
rapidly.
Thus,
in
all
caseswhere
an
SPD
in
the
presentprogramming
period
has
replacedthe
various CSFs
and
OPs used
in
the
previousprogramming period, the progra^mmed amounts are larger than those figuring in the OPs,
with
the result that a higher levelofutilization(in
absolute terms) must be achieved before the next tranche can be committed.Moreover,
sincethe
Community assistance grantedthrough the
Structural Fundsmuit
always
be
matchedby
a
national contribution"it
is
conceivablethat
certain
MemberStates, anxious
to
keep their public spendingwithin
limits, may have deliberately delayed the implementation of certain programmes quali$ingfor
Structural Fund assistance.In
the caseof
the Community initiatives, the failureto utilize
some ECU 245million
may be attributedto
a combinationofthe
following three factors:-
firstly,
a large numberof
CIPs were not approved until very latein
1995 and some indeed notuntil
1996;-
secondly, althoughthe
1993 reform was a successin
that the numberof
typesof
assistance
provided under
the
CSFsand
SPDsfor
the
various
objectives wasreduced,
this
did not
apply
to
the
CIPs, which
outnumber
the
forms
of
"mainstream" assistance atthough accounting
for
only
9%oof
total
expenditure under the Funds;-
thirdly,
a
feature
of
the
current period
has beenthe
large number
of
smallprogrammes
and,
more
particularly,
the
ever-increasing numberof
multi-fundprogrammes in which one or more Funds have only a marginal
participation.
Thisnot
only
makes
the
procedures
for
adopting
the
programmes
extremely cumbersomebut
also adds considerablyto
the
complexityof
the proceduresfor
managing and monitoring the programmes, at both Community and national levels.Although the
first
of
thesefactors
shouldnot
influence developmentsin
subsequentbudgetary years, this
will
not be the casewith
thetwo
other factors andwith
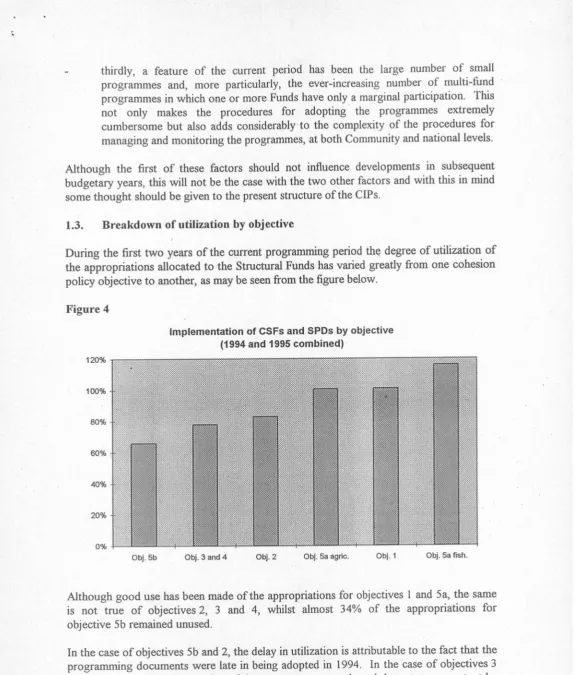
this in mind some thought should be given to the present structure of the CIPs'1.3.
Breakdown of
utilization
by objectiveDuring
thefirst
two
yearsof
the current programming period thq degreeof utilization
of
the appropriations allocated tothe
Structural Funds has varied greatlyfrom
one cohesion [image:11.591.15.591.22.698.2]policy objective
to
anottrer, as may be seen from the figure below.Figure
4lmplementation of CSFs and SPDs by objective
(1994 and 1995 combined)
120%
100%
80%
6006
4%
20%
o%
obj.
5b
Obj. 3 and 4 Obj.5aagric.
Obi.1
Obj.5a fish.Although good use has been made of the appropriations
for
objectivesI
and 5a, the sameis
not
true
of
objectives2,
3
and4,
whilst
almost
34o/oof
the
appropriationsfor
objective 5b remained unused.
In
the caseof
objectives 5b and2,
the delay in utilization is attributable to the fact that theprogramming documents were late in being adopted
in
1994.
In
the caseof
objectives 3and 4, the actual implementation of the programmes was slowed down
to
some extent by the introductionof
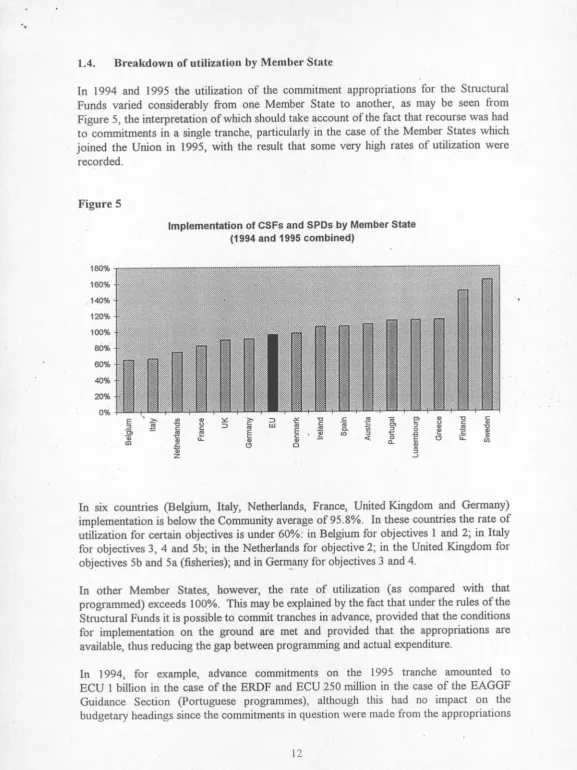
a new objective.1.4.
Breakdown of
utilization
byMember
State [image:12.591.3.581.29.800.2]In
1994and
1995the utilization
of
the
commitment appropriationsfor
the
Structural Fundsvaried
considerablyfrom
oneMember
Stateto
another, asmay
be
seenfrom
Figure 5, the interpretation of which should take account of the fact that recourse was hadto
commitmentsin
a single tranche, particularlyin
the caseof
the Member States whichjoined the Union
in
1995,with
the resultthat
somevery high
ratesof
utilization
wererecorded.
Figure
5lmplementation of CSFs and SPDs by Member State
(1994 and 1995 combined)
't80%
160%
140%
s
'->
5a
'6,
6
dt
In
six
countries (Belgiurn,
Italy,
Netherlands, France, UnitedKingdom and
Germany) implementation is below the Community averageof
95.8o/o.In
these countries the rateof
utilization
for
certain objectives is under 600/o. in Belgiumfor
objectivesI
and 2;in ltaly
for
objectives 3,4
and 5b;in
the Netherlandsfor
objective2; in
the United Kingdomfor
objectives 5b and 5a (fisheries); and in Germany
for
objectives 3 and 4.In
other Member
States,however,
the
rate
of
utilization (as
comparedwith
thatprogrammed) exceeds
I00l/o.
This may be explained by the fact that under the rules of theStructural Funds
it
is possibleto
commit tranches in advance, provided that the conditionsfor
implementationon the
ground are
met
and provided
that the
appropriations are available, thus reducing the gap between programming and actual expenditure.In
lgg4,
for
example,
advance commitmentson the
1995
tranche amounted to
ECU
I
billion in
the caseof
theERDF
and ECU 250million
in
the caseof
the EAGGFGuidance
Section
(Portuguese programmes),although
this
had
no
impact
on
thebudgetary headings since the commitments in question were made from the appropriations
120% 100% 80% 6006 &o/o 20% 0%
stilt
availableat the
endof
theyear.
Such advance commitment, provisionfor
which
is made in the rules governing the implementation of the Structural Funds, brought about anoverall improvement in the utilization of appropriations
in
1994 and 1995 butit
should notdivert
attentionfrom
the
delayswhich
have affected implementationin
certain Member States and which may be of a structural nature'In
1995 the appropriationsfor
objectiveI
were greatly increased at the costof
the otherobjectives
(an
additional
ECU 410million going
to
EAGGF
Guidanceand an
extraECU
628 millionto
theERDF).
Certain Member States covered by objective 1 (Portugal,Spain, Greece and Ireland) were able
to
committheir
1996 trancheat the
endof
1995whilst
others (notably Italy) were unableto
commit the entirety oftheir
1995tranche-Z.
Utilization
of
payment
appropriations
for
the Structural
Funds since
1989and
trend in
outstanding
commitments2.1.
Utilization
of payment appropriations
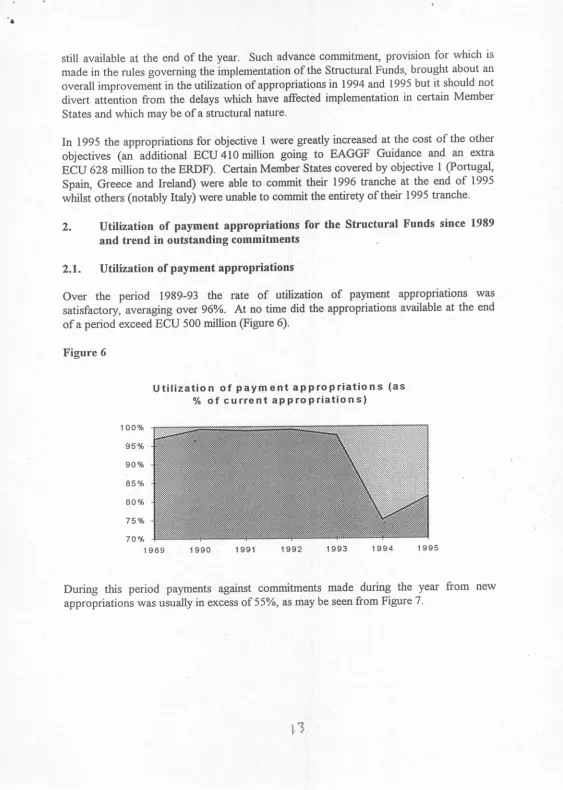
Over
the
period
1989-93
the
rate
of
utilization
of
payment appropriations
wassatisfactory, averaging over 96Yo.
At
no time did the appropriations available at the end [image:13.591.16.579.37.827.2]of
a period exceedECU
500 million (Figure 6).Figure
6Utilization of
paym
ent
appropriations
(as
%
of current
aPProPriations)
1000,6
95 06
90 06
85 06
80 06
7 50h 7 Oo/o
1 989 1 990 1 991 1992 1 993 r
994
1 995During
this
period
payments against commitmentsmade
during the year
from
appropriations was usually in excess
of
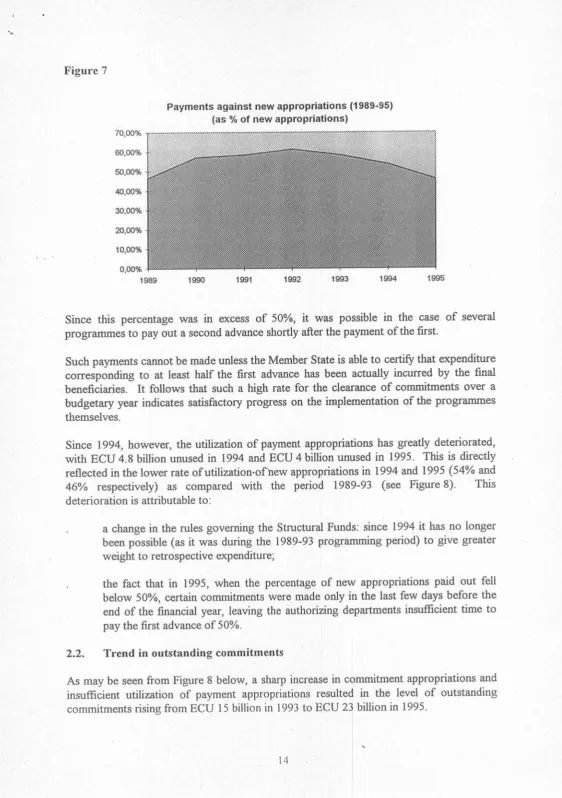
55Yo, as may be seen from Figure 7.Figure
7Payments against new appropriations (1989-951
(as % of new appropriations)
30,0006
20,00%
10,00%
0,0006
1989
Since
this
percentagewas
in
excessof
5OoA,it
was
possiblein
the
caseof
severalprograrnmes
to
pay out a second advance shortly after the payment of the first.Such payments cannot be made unless the Member State is able
to
certify that expenditurecorresponding
to
at
leasthalf the
first
advance has been actually incurredby
the final
beneficiaries.
It
follows that
such a high ratefor
the clearanceof
commitmentsover
abudgetary year indicates satisfactory progress on the irnplementation
of
the programmes themselves.Since 1994, however, the
utilization
of
payment appropriations has greatly deteriorated,with
ECU
4.8billion
unusedin
1994 and ECU 4 billion unusedin
1995.
Thisis
directlyreflected in the lower rate of
utilization.ofnew
appropriationsin
1994 and 1995 (54o/o and46,
respectively)
as
compared
with
the
period
1989-93 (see
Figure8).
This deterioration is attributable to:.
a changein
the rules governing the Structural Funds: since 1994it
hasno
longerbeen possible (as
it
was duringthe
1989-93 programming period)to
give greaterweight
to
retrospective expenditure;.
the
fact
that
in
1995, whenthe
percentageof
new
appropriationspaid
out
fell
below
50o/o, certain commitments were made only in the lastfew
days before the endof
the financial year, leaving the authorizing departments insufficienttime to
pay the
first
advanceof
50o/o.2.2.
Trend in
outstanding
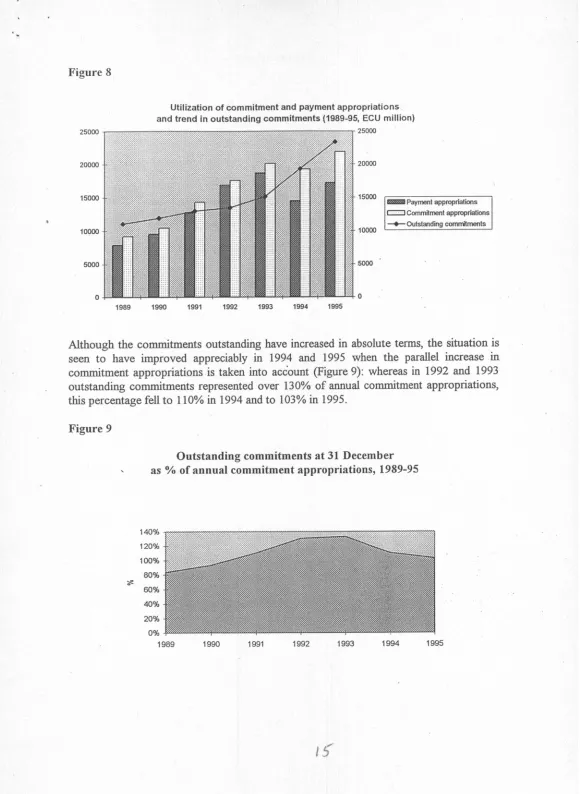
commitmentsAs
may be seen from Figure 8 below, a sharp increasein
commitment appropriations andinsufficient
utilization
of
payment appropriations resultedin
the
level
of
outstanding commitments rising fromECU
l5
billionin
1993 to ECU 23billion in
1995.Figure
8Utilization of commitment and payment appropriations
and trend in outstanding commitments (1989-95, ECU million)
appmprbtbns
appmpdations
-a-
otrtstarding cornnitr€ntsAlthough
the commitments outstanding have increasedin
absolute terms, the situation isseen
to
have improved
appreciablyin
1994and
1995when
the
parallel increasein
commitment appropriationsis
takeninto
aciount
(Figure9):
whereasin
1992and
1993outstanding commitments represented
over I30%
of
annual commitment appropriationgthis percentage fell
to
ll}Yoin1994
andto
103%in
1995.Figure
9Outstanding
commitments at 31 Decemberas Y" of
annual commitment appropriations,
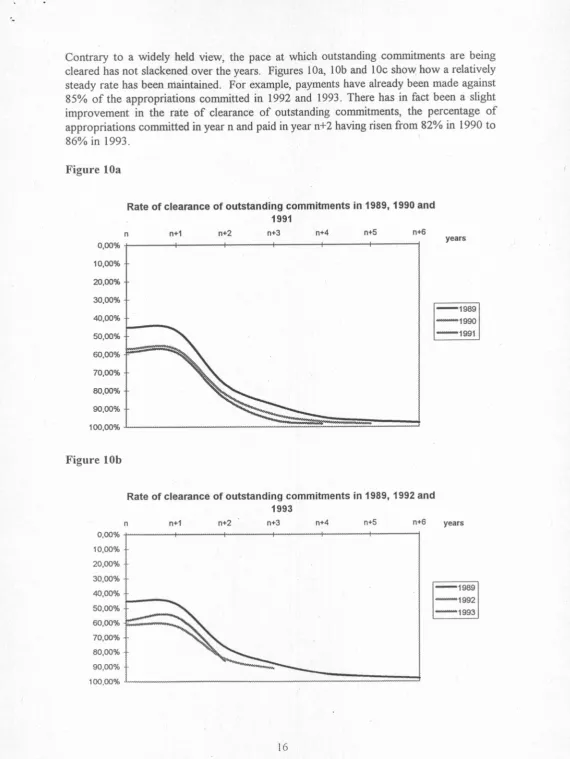
f 989-95Contrary
to
a widely
heldview,
the paceat which
outstanding commitments are being cleared hasnot
slackened over the years. Figures 10a, lOb and 10c show how a relativelysteady rate has been niaintained. For example, payments have already been made against 85Yo
of
the
appropriations committedin1992
and 1993. There hasin
fact beena
slight improvementin
the
rate
of
clearanceof
outstanding commitments,the
percentageof
[image:16.591.14.585.35.795.2]appropriations committed in year n and paid in year 1+2 having risen from 82o/o
in
1990to
860/oin
1993.Figure
10aRate of clearance of outstanding commitments in 1989, 1990 and
1991
n
n+1
n+2
n+3
n+4
n+5
n+6 o,00%10,00%
20,00%
30,00%
40,00%
50,00%
60,0006
70,00%
80,00%
90,00%
100,0006
Figure
10byears
Rate of clearance of outstanding commitments in 1989, 1992 and
,|993
n+2
n+3
o+4 o,oo%10,o0%
20,0006
30,o0% 40,00% 50,00% 60,00% 70,00% 80,o0% 90,000,6 100,000,6
years
Figure
10c0,0006
10,00% 20,00%
30,ff)%
40,00%
50,0006
60,00% 70,00% 80,00% 90,00% 100,00%
Rate of clearance of outstanding commitments in 1989, 1994 and
1995
n+2
n+3
n+4
n+5n+6
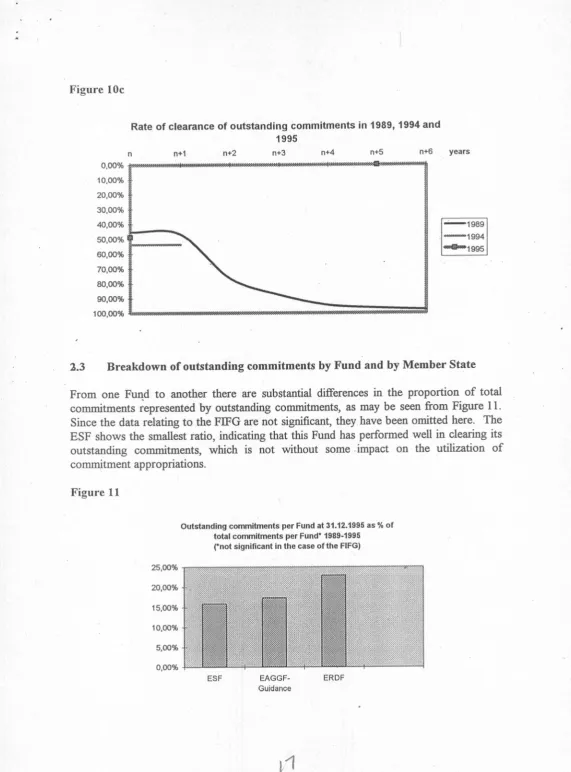
years2.3
Breakdown
ofoutstanding
commitments byFund
andby Member
StateFrom
one
Fun!
to
anotherthere are
zubstantial differencesin
the
proportion
of
total
commitments represented
by
outstanding commitments, as maybe
seenfrom
Figure 11.Since the data relating
to
theFIFG
arenot
significant, they have been omittedhere.
TheESF shows the smallest
ratio,
indicating that this Fund has performedwell
in
clearing itsoutstanding
commitments,which
is
not
without
some.impact
on
the utilization
of
commitment appropriations.
Figure
1l
Outdanding cornmitments per Fund at 31.12.1995 as % of
total cornrnitnents per Fund' 1989-1995
fnot significant in the case of the FIFG)
25,00%
20,00%
15,00%
10,00%
5,O0%
0,00%
Figure 12 gives a breakdown
of
outstanding commitments by Member State, showing thepercentage
of
total
outstanding commitments accountedfor by
eachMember
State at3l
December 1995.Figure
12Breakdown of outstanding commitments by Member State at
31.12.1995
uK 0,f;".0't"'''ln
DE 12,6%INL
s,1961'3%
IRL 2,1%
Figure
13
shows,
for
each Member State,
the
outstanding commitments
at3l
December 1995 as a percentageof
total
commitments over theperiod 1989-95.
Thispercentage reflects
the
relative "performance"of
the Member Statesin
the
clearanceof
their commitment appropriations.
FR 10,3%
t
Figure
l3
Outstanding commitments by Membel State at 31.12.1995 as % of total commitments per Member
State over the period 1989-95
Fg
sppgFSa
qqEE[a
dd*"E
fiza
YE
f: 6 dt
Six
Member States (United Kingdom, Belgium,Spaiq
Greece, Netherlands and.France) score closeto
the averagefor
the Communityof
Twelve, their outstanding commitments representing between 18% and 2lo/oof
allappropriations committed and duefor
payment.Two
Member States record slightly higher percentages.Three Member States (Ireland, Portugal and Denmark) are particularly efficient at clearing
their
appropriation6whilst in
the
caseof Italy
outstanding commitments: accountfor
avery substantial percentage (32%) of total commitments.
It
should
be pointed out that the
figures
for
Finland,
Austria and
Swedenare
not significant since thefirst
commitments were made onlyin
1995-A
comparison of Figures 12 and 13 revealstwo
interesting facts:.
thefive
Member Stateswith
outstanding commitments exceedingljYo
(Germany,Greece,
Spain, Franceand
Italy)
accountfor
almost 77o/oof
all
outstanding commitments:.
three
of
these Member States (Germany, France andItaly)
arenot
among the countries whose clearance of outstanding commitments has been satisfactory.When these
two
factors are borne in mind,it
may be concluded that any improvements inthe
clearancerate
achievedby
oneor
moreof
these Statescould
havea
considerableimpact on the overall level of outstanding commitments.
a
3.
Reliability
of forecastsFor
the .lasttwo
years the forecastsof
the implementationof
the
Structural Funds haveproved
unreliable.
The estimates drawnup
at the beginningof
each year havenot
beenbo.r,"
outin
practice.
In
the caseof
the commitment appropriations one consequenceof
this
inadequate forecasting has been the high level ofunderutilization.
In
the caseof
thepayment appropriations
the
consequenceshave been even
more
serious,
for
theseappropriations form the basis for the payment of own resources by the Member States and
if
they
are over-estimatedthis
can have an adverse impact on the nationaltreasury.
Onthe
other
hand,
if
the paynent
appropriationsare
under-estimated,this
may
causedifficulties in
that budgetary availabilities may then prove insufficientto
meet applicationsfor
paymentDepending on the type
of
appropriations involved, different reasons may be foundfor
the unreliability of these forecasts.In
the
caseof
commitment appropriations, the forecasts arenot
solidly based on factualassessments
of
actual progress "on thegfound".'All
too
often the annual forecasts are nodifferent from the
multiannual programmingwhich
is
itself
basedon
budgetary
data (compliancewith
the
Edinburgh figures)rather
thanon
anyreal
planning.
Thus,
the programming exerciseis
in
a
sense"top-down"
and takes inzufficient accountof
how
projects arein
fact
progressingin
the
Member States, althoughthis would
bethe
onlyreliable way
of
assessing the requirementsfor
commitment appropriations in a given year.In
the
caseof
payment appropriations, the programmingis
somewhat mechanical, being basedon
theoretical due datesfor
payments. The
shortcomingsof
this
method derivefiom
the factthat,
on the one hand,no
account is takenof
variationsin
the clearanceof
outstanding commitments
and,
on
the
other
hand,
the
possibleunderutilization
of
commitment appropriations is not anticipated.In
1994and
1995 there werevery
substantial movementsof
appropriationswithin
thebudget,
both
by
internal transfer and
by
external
transfer.
The
total
sums moved representedin
absolute terms 13.\yo of the original appropriationsfor
1994 and 17.5o/oof
those
for
1995.
In
all. over
ECU 4billion was
moved
in
the
courseof
thesetwo
[image:20.591.22.583.32.814.2]budgetary years.
Figure
14t!
t
Budgetary transfers as a % of original appropriations (1989-95)
18,0006
16,00%
14,OOoh
12.000h
10,00%
8,0006 6,0006
4,O0%
2,OO%
0,000,6
1992 1993 1994'
1995'excluding external transfer frotn heading B0tt0
The
transfers madein
1994 arenot
necessarily attributableto
a
discrepancy betweenprogramming
and
implementation sincemost
of
these transfers, carriedout
under theNotenboom procedure
in
I.994, were intendedto
bring the budget backinto
linewith
theprogrammes embodied
in
the
CSFs andSPDs.
Whenthe
preliminarydraft
budgetfor
1994 was drawn
up,
precise programming data werenot yet
available asthe
CSFs and SPDs had not yet been adopted.In
1995, although certain programming documents hadstill not
been adopted when thebudget
was
drawn
up,
the
transfersof
appropriationsreflect
the fact that the
delayaffecting certain objectives was offset by more rapid implementation
of
objective1.
The scale of these transfers raises the question ofwhether the financial programming containedin the CSFs and SPDs